. 2024 Jul 3:15:1394971.
doi: 10.3389/fgene.2024.1394971. eCollection 2024.

Key co-expressed genes correlated with blood serum parameters of pigs fed with different fatty acid profile diets

Affiliations

Key co-expressed genes correlated with blood serum parameters of pigs fed with different fatty acid profile diets

Simara Larissa Fanalli et al. Front Genet. .

Abstract

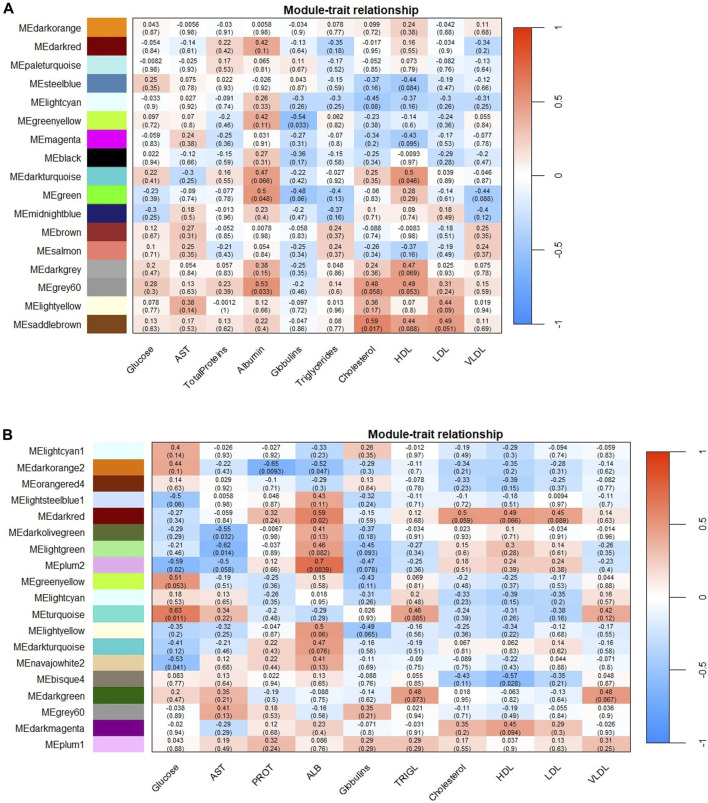
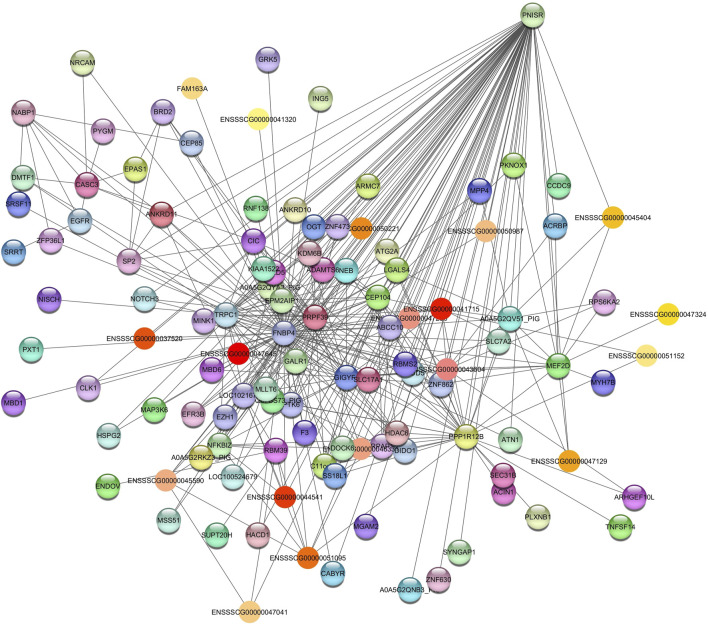
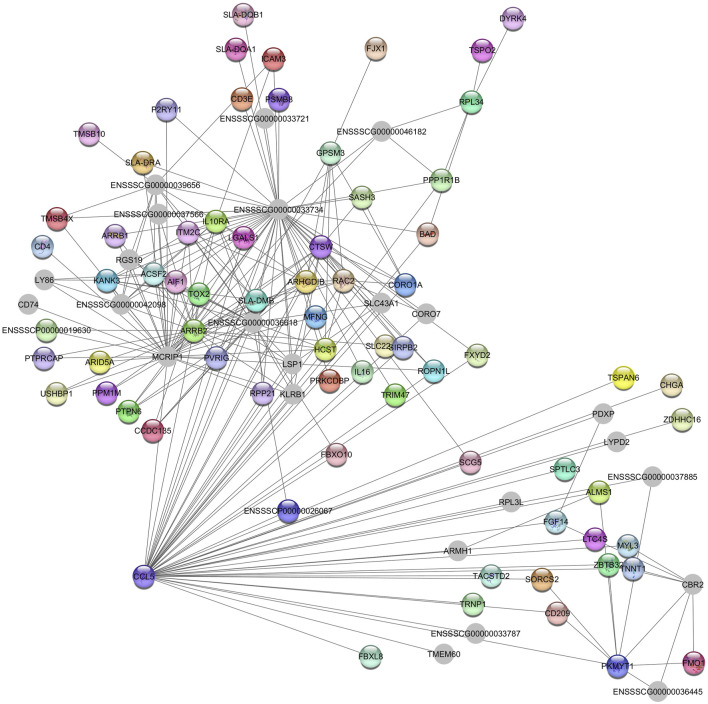
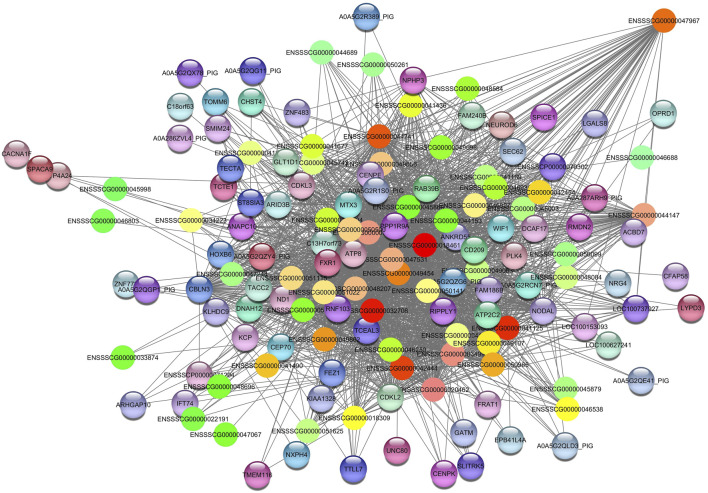
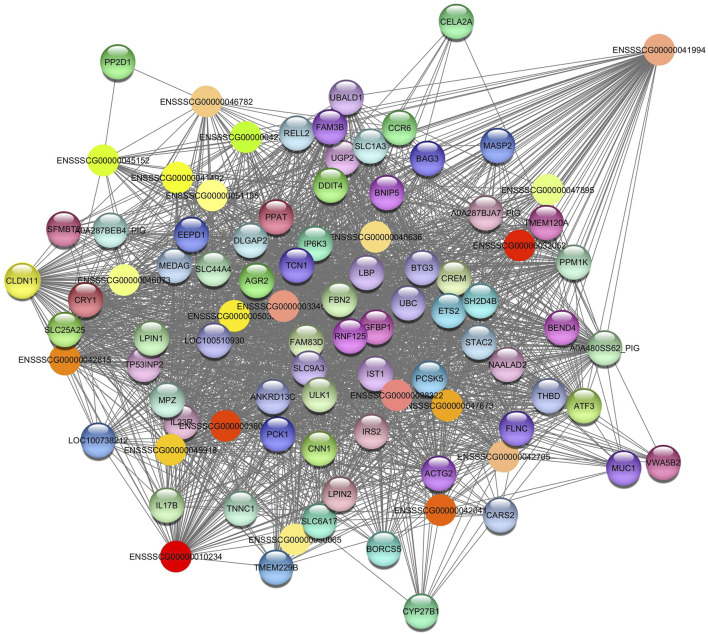
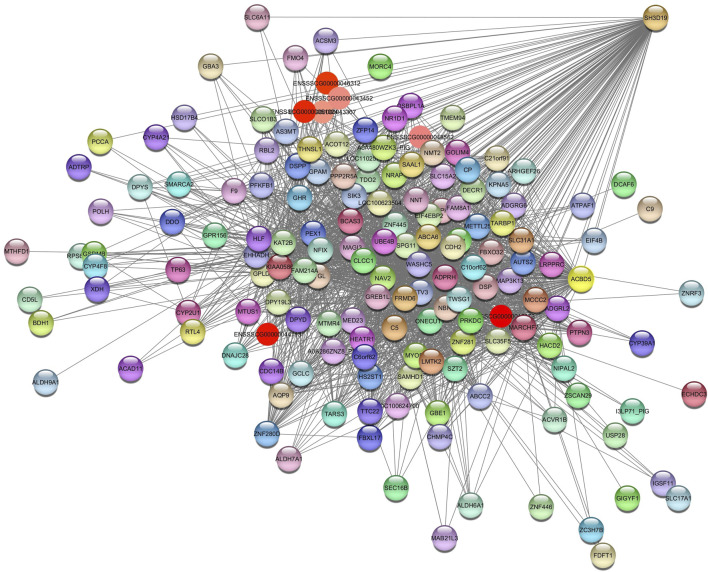
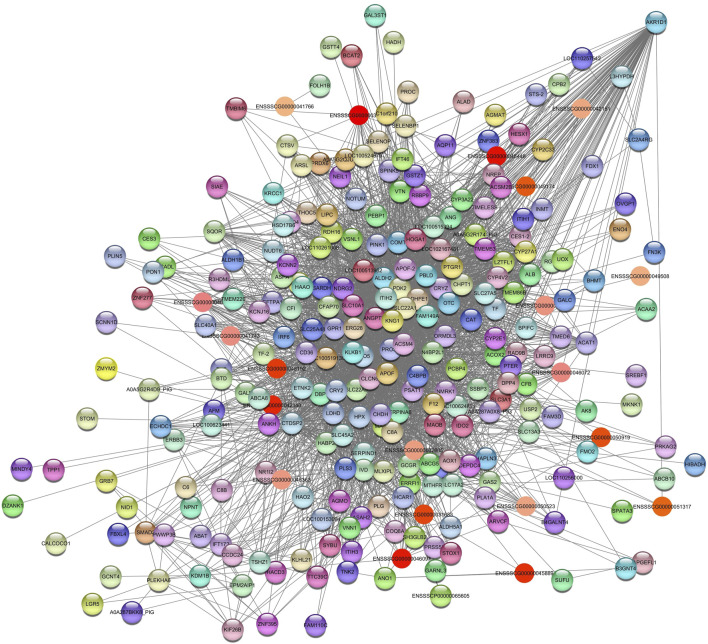
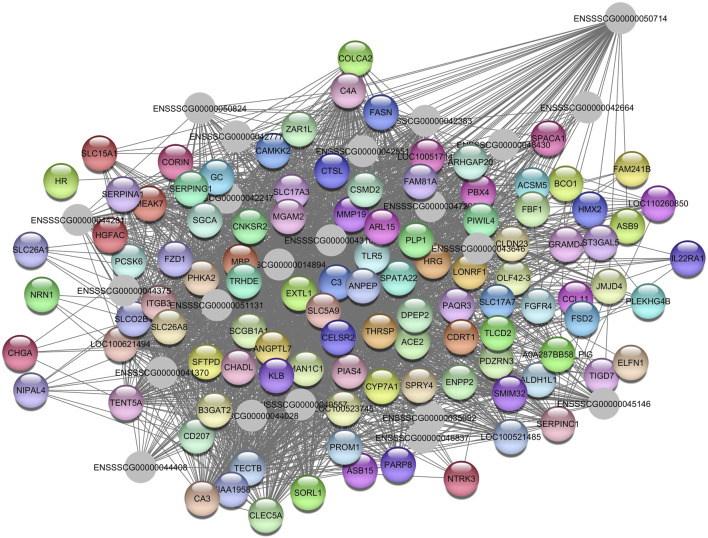
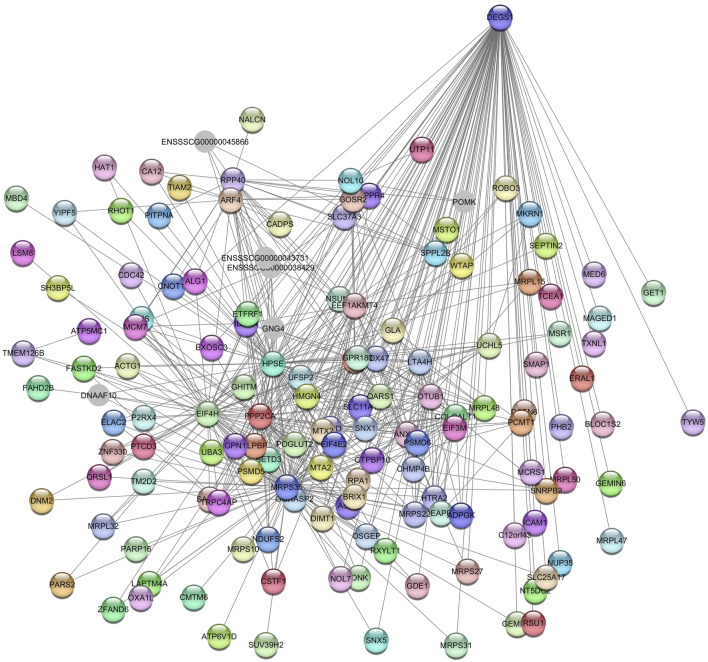
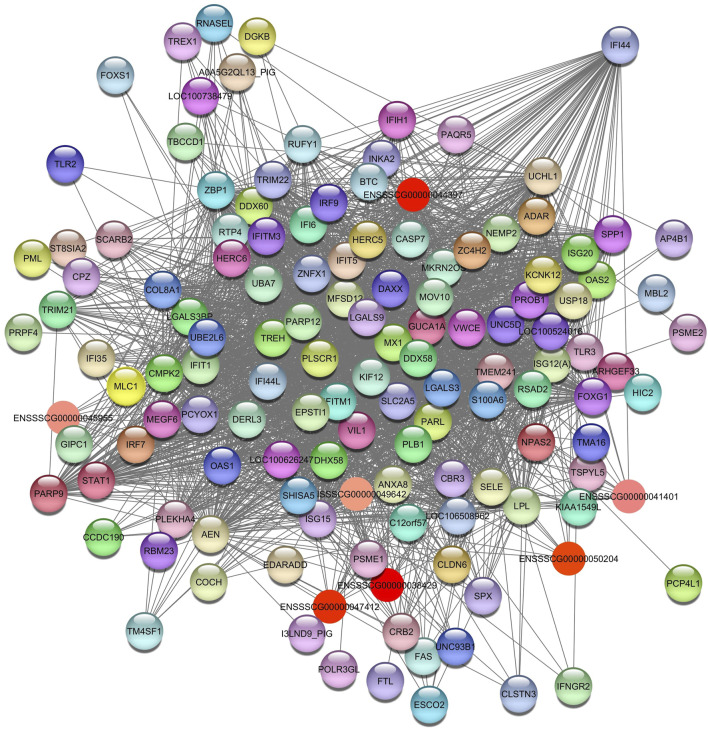
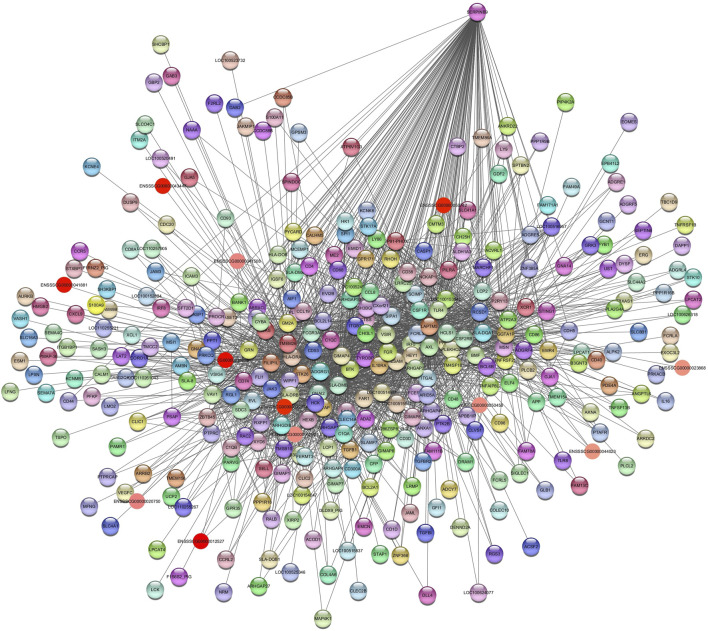
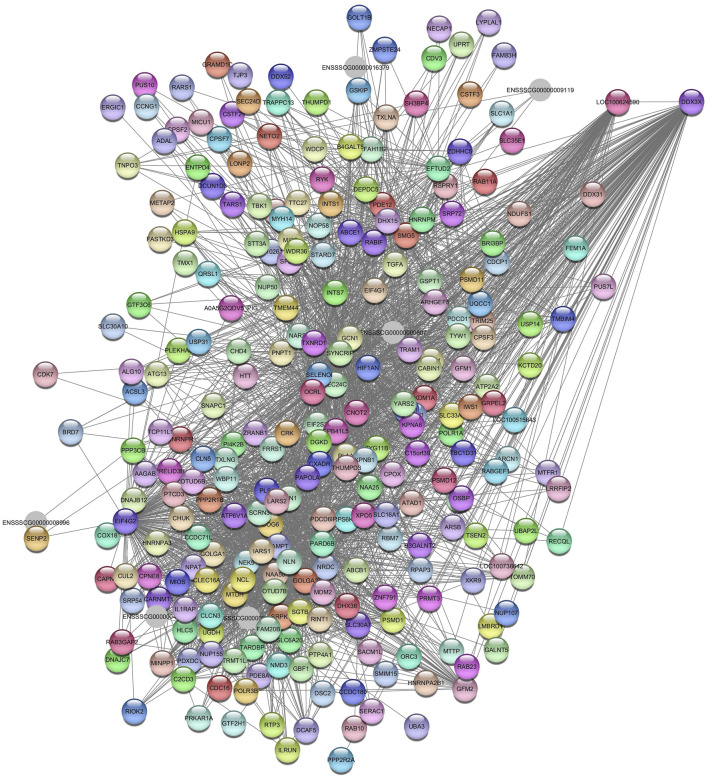
This study investigated how gene expression is affected by dietary fatty acids (FA) by using pigs as a reliable model for studying human diseases that involve lipid metabolism. This includes changes in FA composition in the liver, blood serum parameters and overall metabolic pathways. RNA-Seq data from 32 pigs were analyzed using Weighted Gene Co-expression Network Analysis (WGCNA). Our aim was to identify changes in blood serum parameters and gene expression between diets containing 3% soybean oil (SOY3.0) and a standard pig production diet containing 1.5% soybean oil (SOY1.5). Significantly, both the SOY1.5 and SOY3.0 groups showed significant modules, with a higher number of co-expressed modules identified in the SOY3.0 group. Correlated modules and specific features were identified, including enriched terms and pathways such as the histone acetyltransferase complex, type I diabetes mellitus pathway, cholesterol metabolism, and metabolic pathways in SOY1.5, and pathways related to neurodegeneration and Alzheimer's disease in SOY3.0. The variation in co-expression observed for HDL in the groups analyzed suggests different regulatory patterns in response to the higher concentration of soybean oil. Key genes co-expressed with metabolic processes indicative of diseases such as Alzheimer's was also identified, as well as genes related to lipid transport and energy metabolism, including CCL5, PNISR, DEGS1. These findings are important for understanding the genetic and metabolic responses to dietary variation and contribute to the development of more precise nutritional strategies.

Keywords: RNA-seq; WGCNA; co-expression; immune response; lipid metabolism; soybean oil; systems biology; transcriptome.


Conflict of interest statement

The authors declare that the research was conducted in the absence of any commercial or financial relationships that could be construed as a potential conflict of interest. The author(s) declared that they were an editorial board member of Frontiers, at the time of submission. This had no impact on the peer review process and the final decision.

Figures

FIGURE 1
FIGURE 1
Module-trace associations between eigengene modules (ME) and the biochemical parameters studied. Panel (A) corresponds to SOY1.5 dietary treatment associations, while panel (B) corresponds to SOY3.0. Each row corresponds to an eigengene module, and each column to a biochemical parameter. Each cell contains the Pearson coefficient (number outside the parentheses) and the correction p-value (number in parentheses). The graphs are color-correlation coded according to the legend, where red represents a positive correlation and blue represents a negative correlation. AST: Aspartate aminotransferase; PROT: Total protein; ALB: Albumin, and TRIGL: Triglycerides.
FIGURE 2
FIGURE 2
Network view highlighting interactions of the hub gene PNISR. Interaction networks within the liver tissue from pigs fed a diet with 1.5% soybean oil inclusion (SOY1.5) were constructed using Cytoscape, followed by the stringApp plugin. The network associated with the Grey60 module is co-expressed with the albumin phenotype. Colored nodes represent genes/proteins included in the query.
FIGURE 3
FIGURE 3
Network view highlighting interactions of the hub gene CCL5. Interaction networks within the liver tissue from pigs fed a diet with 1.5% soybean oil inclusion (SOY1.5) were constructed using Cytoscape, followed by the stringApp plugin. The network associated with the Green module is co-expressed with the albumin phenotype. Colored nodes represent genes/proteins included in the query.
FIGURE 4
FIGURE 4
Network view highlighting interactions of the hub gene ENSSCG00000047967. Interaction networks within the liver tissue from pigs fed a diet with 3% soybean oil inclusion (SOY3.0) were constructed using Cytoscape, followed by the stringApp plugin. The network associated with the Darkred module is co-expressed with the albumin phenotype. Colored nodes represent genes/proteins included in the query.
FIGURE 5
FIGURE 5
Network view highlighting interactions of the hub gene ENSSSCG00000041994. Interaction networks within the liver tissue from pigs fed a diet with 3% soybean oil inclusion (SOY3.0) were constructed using Cytoscape, followed by the stringApp plugin. The network associated with the Darkorange2 module is co-expressed with the total protein and albumin phenotypes. Colored nodes represent genes/proteins included in the query.
FIGURE 6
FIGURE 6
Network view highlighting interactions of the hub gene SH3D19. Interaction networks within the liver tissue from pigs fed a diet with 3% soybean oil inclusion (SOY3.0) were constructed using Cytoscape, followed by the stringApp plugin. The network associated with the Plum2 module is co-expressed with the glucose and albumin phenotype. Colored nodes represent genes/proteins included in the query.
FIGURE 7
FIGURE 7
Network view highlighting interactions of the hub gene AKR1D1. Interaction networks within the liver tissue from pigs fed a diet with 3% soybean oil inclusion (SOY3.0) were constructed using Cytoscape, followed by the stringApp plugin. The network associated with the Lightgreen module is co-expressed with the AST phenotype. Colored nodes represent genes/proteins included in the query (small nodes indicate proteins with unidentified 3D structure, large nodes indicate those with known structures).
FIGURE 8
FIGURE 8
Network view highlighting interactions of the hub gene ENSSSCG00000050714. Interaction networks within the liver tissue from pigs fed a diet with 3% soybean oil inclusion (SOY3.0) were constructed using Cytoscape, followed by the stringApp plugin. The network associated with the Darkolivegreen module is co-expressed with the AST phenotype. Colored nodes represent genes/proteins included in the query.
FIGURE 9
FIGURE 9
Network view highlighting interactions of the hub gene DEGS1. Interaction networks within the liver tissue from pigs fed a diet with 1.5% soybean oil inclusion (SOY1.5) were constructed using Cytoscape, followed by the stringApp plugin. The network associated with the Greenyellow module is co-expressed with the globulin phenotype. Colored nodes represent genes/proteins included in the query.
FIGURE 10
FIGURE 10
Network view highlighting interactions of the hub gene IF144. Interaction networks within the liver tissue of pigs fed a diet with 3.0% soybean oil inclusion (SOY3.0) were constructed using Cytoscape, followed by the stringApp plugin. The network associated with the Bisque4 module is co-expressed with the HDL phenotype. Colored nodes represent genes/proteins included in the query.
FIGURE 11
FIGURE 11
Network view highlighting interactions of the hub gene SERPINB9. Interaction networks within the liver tissue of pigs fed a diet with 3.0% soybean oil inclusion (SOY3.0) were constructed using Cytoscape, followed by the stringApp plugin. The network associated with the Turquoise module is co-expressed with the glucose phenotype. Colored nodes represent genes/proteins included in the query.
FIGURE 12
FIGURE 12
Network view highlighting interactions of the hub gene DDX3X. Interaction networks within the liver tissue of pigs fed a diet with 3.0% soybean oil inclusion (SOY3.0) were constructed using Cytoscape, followed by the stringApp plugin. The network associated with the Najowhite2 module is co-expressed with the glucose phenotype. Colored nodes represent genes/proteins included in the query.

References

    1. Alencar S. A. da S., Kiefer C., Nascimento K. M. R. de S., Viana L. H., Corassa A., Gomes M. de N. B., et al. (2021). Dietary soybean oil modulates fatty acid composition of pork. Trop. Anim. Health Prod. 53, 357. 10.1007/s11250-021-02804-1 - DOI - PubMed
    1. Almeida V. V., Silva J. P. M., Schinckel A. P., Meira A. N., Moreira G. C. M., Gomes J. D., et al. (2021). Effects of increasing dietary oil inclusion from different sources on growth performance, carcass and meat quality traits, and fatty acid profile in genetically lean immunocastrated male pigs. Livest. Sci. 248, 104515. 10.1016/J.LIVSCI.2021.104515 - DOI
    1. Ashburner M., Ball C. A., Blake J. A., Botstein D., Butler H., Cherry J. M., et al. (2000). Gene ontology: tool for the unification of biology. The Gene Ontology Consortium. Nat. Genet. 25, 25–29. 10.1038/75556 - DOI - PMC - PubMed
    1. Avallone R., Vitale G., Bertolotti M. (2019). Omega-3 fatty acids and neurodegenerative diseases: new evidence in clinical trials. Int. J. Mol. Sci. 20, 4256. 10.3390/ijms20174256 - DOI - PMC - PubMed
    1. Belinskaia D. A., Voronina P. A., Batalova A. A., Goncharov N. V. (2021). Serum albumin, 65–75.

LinkOut - more resources