. 2024 Jun 6;27(7):110203.
doi: 10.1016/j.isci.2024.110203. eCollection 2024 Jul 19.

Regulation of the DLC3 tumor suppressor by a novel phosphoswitch

Affiliations

Regulation of the DLC3 tumor suppressor by a novel phosphoswitch

Yannick Frey et al. iScience. .

Abstract

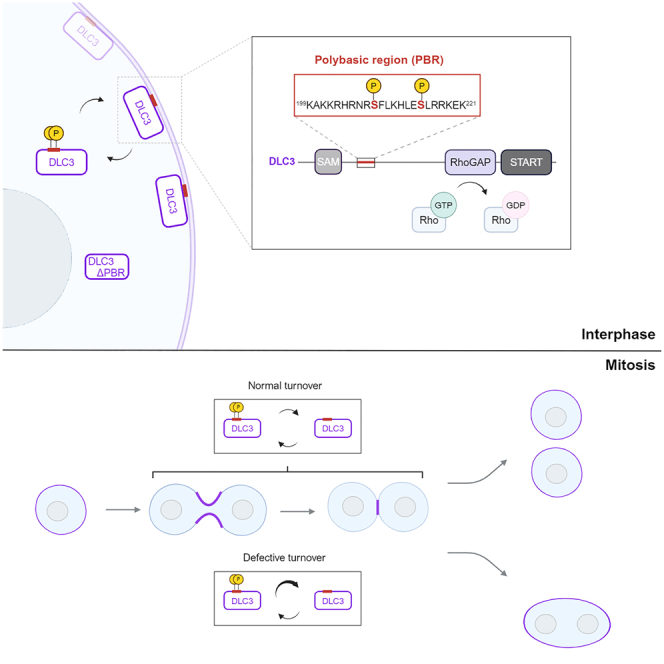
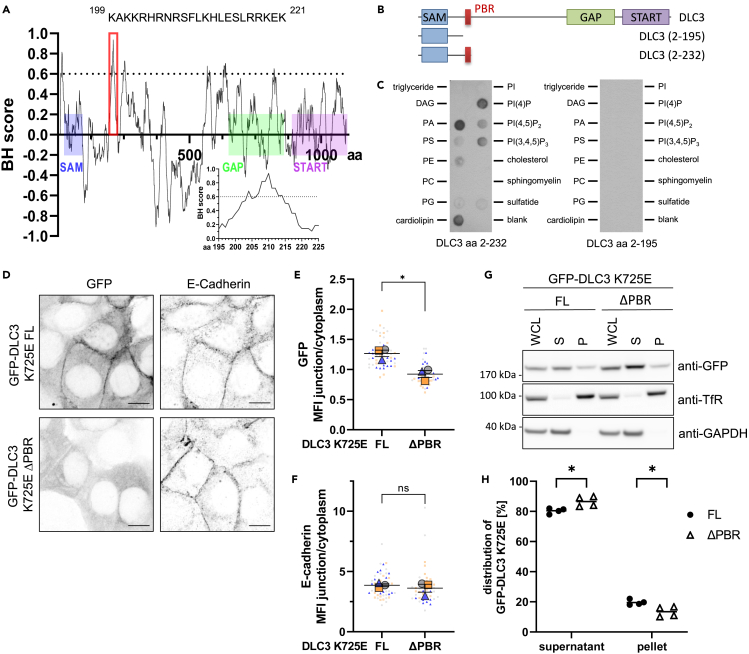
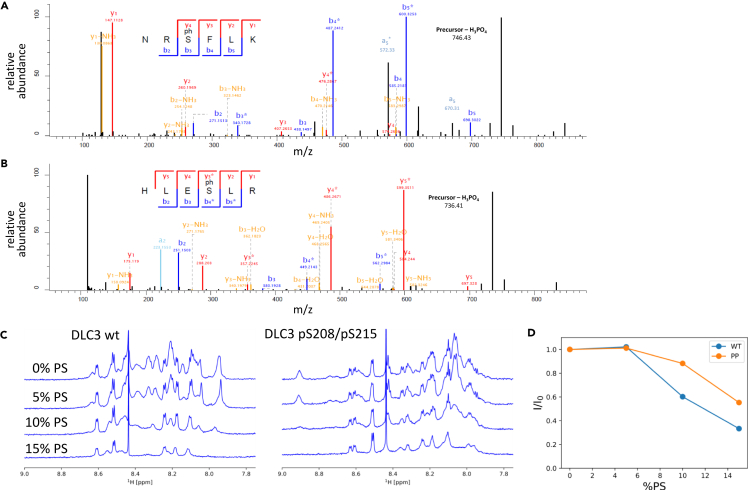
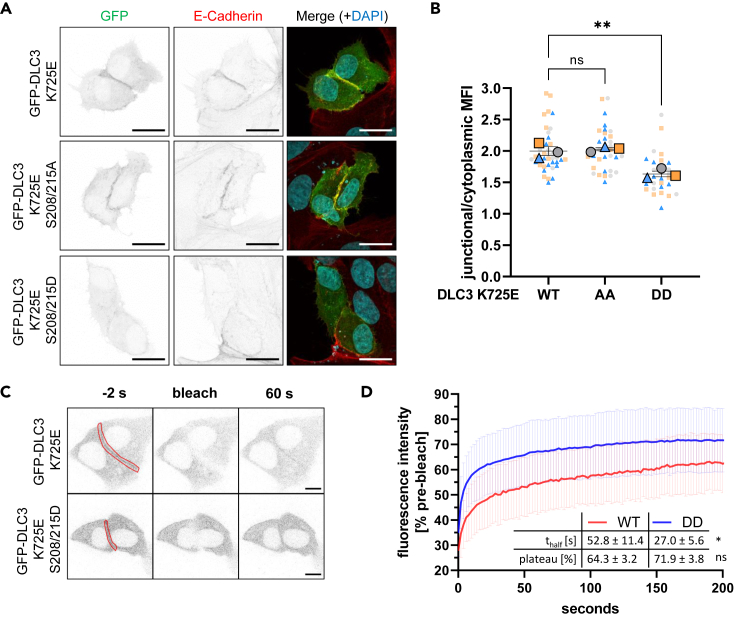
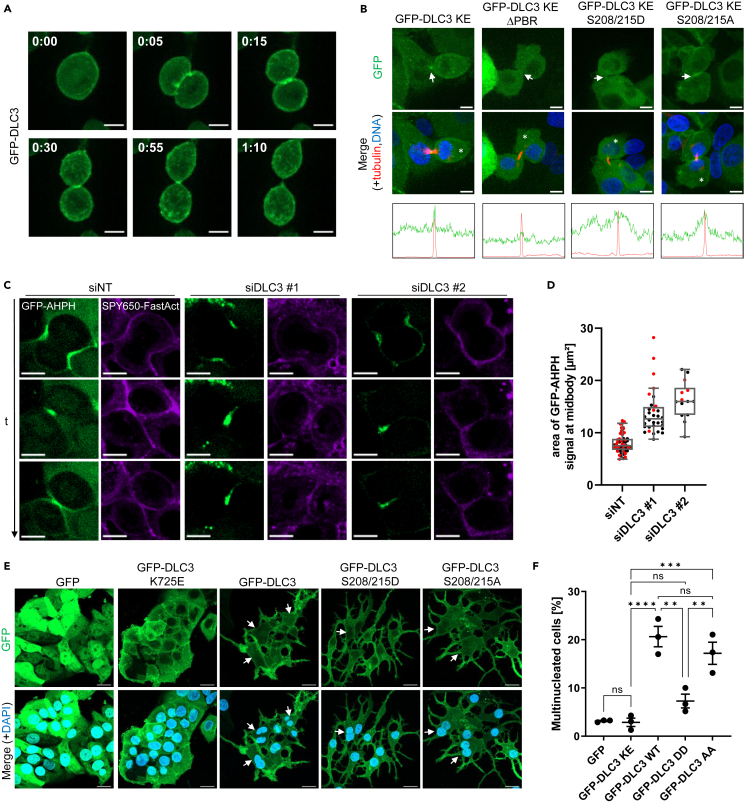
Deleted in liver cancer 3 (DLC3) is a Rho GTPase-activating protein (RhoGAP) that plays a crucial role in maintaining adherens junction integrity and coordinating polarized vesicle transport by modulating Rho activity at the plasma membrane and endomembranes. By employing bioinformatical sequence analysis, in vitro experiments, and in cellulo assays we here identified a polybasic region (PBR) in DLC3 that facilitates the association of the protein with cellular membranes. Within the PBR, we mapped two serines whose phosphorylation can alter the electrostatic character of the region. Consequently, phosphomimetic mutations of these sites impaired the membrane association of DLC3. Furthermore, we found a new PBR-dependent localization of DLC3 at the midbody region, where the protein locally controlled Rho activity. Here, the phosphorylation-dependent regulation of DLC3 appeared to be required for proper cytokinesis. Our work thus provides a novel mechanism for spatiotemporal termination of Rho signaling by the RhoGAP protein DLC3.

Keywords: Cell biology; Molecular interaction; Proteomics.


Conflict of interest statement

The authors declare no competing interests.

Figures

None
Graphical abstract
Figure 1
Figure 1
Regulation of DLC3 membrane association by a novel polybasic region (A) BH plot of basic and hydrophobic residues in DLC3 using the scale developed by Brzseska et al. The relative localization of the SAM, GAP and START domains are schematically annotated on the profile. The red box marks the identified polybasic region (PBR) spanning amino acids (aa) 199–221 with the sequence given. The blot of this region is magnified in the insert. (B) Line diagram showing the domain organization of full-length DLC3 and fragments used for the lipid overlay assay in (C), with the PBR marked in red. (C) Recombinant GST-tagged N-terminal DLC3 fragments containing the PBR (left) or lacking the PBR (right) were incubated with lipid strips. Bound protein was detected by immunoblotting with anti-GST antibody, followed by HRP-coupled secondary antibody. DAG = diacylglycerol, PA = phosphatidic acid, PS = phosphatidylserine, PE = phosphatidylethanolamine, PC = phosphatidylcholine, PG = phosphatidylglycerol, PI = phosphatidylinositol, sulfatide = 3-sulfogalactosylceramide. (D) Localization of GFP-DLC3 K725E full-length (FL) and ΔPBR in MCF7 cells inducibly expressing GFP-DLC3. E-cadherin-specific immunostainings. Images are maximum intensity projections of several confocal sections. Scale bars: 10 μm. (E and F) Analysis of images from (D). Graph shows the mean fluorescence intensity (MFI ±SEM) of the signal at cell junctions versus the cytoplasmic signal for GFP (E) or E-cadherin (F) (n = 3; N = 50, 43 cells; t test: p = 0.0123 (E), p = 0.5194, ns = not significant (F)). (G) Biochemical fractionation of MCF7 cells stably expressing GFP-DLC3 K725E or K725E ΔPBR into soluble supernatant and membrane-containing pellet fractions. Fractions were analyzed by immunoblotting with the indicated antibodies followed by HRP-coupled secondary antibody. (H) Shown is the distribution of GFP signal in the immunoblotted fractions analyzed by Fiji, normalized to GAPDH (supernatant fraction) or transferrin receptor (pellet fraction) (line shows mean of 4 independent experiments; two-way ANOVA with Sidak’s multiple comparison test: p = 0.0147).
Figure 2
Figure 2
DLC3 PBR phosphorylation impairs membrane interaction in vitro (A and B) Fragmentation mass spectra of the phosphopeptides NRpSFLK (A) and HLEpSLR (B) corresponding to amino acids 206–211 and 212–217 in DLC3, respectively, obtained from immunoprecipitated FLAG-tagged DLC3. (C) Superposition of the NMR spectra of 0.1 mM peptides encompassing DLC3 aa 199–221 wt (left) or phosphorylated on serines 208 and 215 (right) measured in the presence of unilamellar vesicles containing variable amounts of the negatively charged POPS. From top to bottom: 100% POPC, 5% POPS/95% POPC, 10% POPS/90% POPC, 15% POPS/85% POPC, total lipid concentration 2 mM. The intensity of the NMR signals progressively decrease due to the increasing interaction of the PBR peptide with the negatively charged vesicles. (D) The dependence of the total integral intensity (I) of the NH signals on the POPS percentage in the vesicles (%PS) presented as a ratio to the integral intensity at 0% POPS (I0) that quantifies the signal reduction. The signal intensities of the doubly phosphorylated peptide decrease less than the unmodified peptide, indicating reduced interaction with the membrane upon phosphorylation.
Figure 3
Figure 3
Phospomimetic DLC3 PBR mutants show impaired membrane association in cellulo (A) Localization of GFP-DLC3 K725E or phosphodeficient S208/215A or phosphomimetic S208/215D muteins in transiently transfected MCF7 cells. GFP- and E-cadherin-specific immunostainings plus nuclear counterstain (DAPI). Images are maximum intensity projections of several confocal sections. Scale bars: 20 μm. (B) Graph shows the mean fluorescence intensity (MFI ±SEM) of the GFP signal at cell junctions versus the cytoplasmic GFP signal (n = 3, N = 39, 33, 30); one-way ANOVA with Dunnett’s post-test: WT vs. AA p = 0.8765; WT vs. DD p = 0.0037). (C and D) Fluorescence recovery [%] after photobleaching cell-cell contact regions of transiently transfected MCF7 cells expressing GFP-DLC3 K725E with wild-type PBR (WT) or phosphomimetic S208/215D mutations (DD). Images show an exemplary site immediately before (−2 s), immediately after (bleach) and 60 s after photobleaching. Red outline indicates photobleached region. Graph shows mean ± SD, N = 9, 11 from two independent experiments. Intensity curves were analyzed by one-phase association nonlinear regression to obtain half-time of fluorescence recovery (thalf) and mobile fraction (plateau) (t test thalf: p = 0.0445; t test plateau: p = 0.1485; shown is mean ± SEM).
Figure 4
Figure 4
A PBR-dependent role for DLC3 in the regulation of cell division (A) Expression of GFP-DLC3 in stable MCF7 cells was induced for 24 h with doxycycline and cells were analyzed by live-cell imaging. Time stamp: h:mm, scale bars: 10 μm. (B) Expression of indicated GFP-tagged DLC3 constructs (green) in stable MCF7 cells was induced for 24 h with doxycycline and cells were analyzed by live-cell imaging. Midbodies, indicated by arrows, were identified using SPY555-tubulin staining (red). Nuclei were counterstained with SPY650-DNA. Line plots show mean fluorescence signal along the perimeter of cells marked with asterisks. Scale bars: 10 μm. (C) MCF7 cells stably expressing the Rho-GTP biosensor GFP-AHPH (green) were transfected with the indicated siRNAs. After 72 h, cells were stained with SPY650-FastAct (magenta) and analyzed by live-cell imaging. Representative maximum intensity projections of selected time frames from live-cell imaging movies are shown. Scale bars: 10 μm. (D) The area of GFP-AHPH sensor signal in cells from (C) at the midbody area was quantified with Fiji (n = 2; N = 57, 32, 14) and normalized to control siRNA. Graph shows individual sample points and means in a boxplot with Tukey whiskers. (E) Expression of indicated GFP-tagged DLC3 constructs in stable MCF7 cells was induced for 72 h with doxycycline. Cells were fixed, nuclei were counterstained with DAPI and samples analyzed by fluorescence microscopy. Multinucleated cells are marked with an arrow. Scale bars: 20 μm. (F) The percentage of multinucleated cells was determined manually. Graph shows the means (±SEM) of three independent experiments (n = 3; N = 318, 324, 189, 173, 183). KE: GAP-inactive K725E mutation, WT: wild-type, DD: phosphomimetic S208/215D mutations, AA: phosphodeficient S208/215A mutations. One-way ANOVA with Tukey’s post-test: GFP vs. KE p = 0.99994; KE vs. WT p = 0.00009; KE vs. DD p = 0.34386; KE vs. AA p = 0.00058; WT vs. DD p = 0.00100; WT vs. AA p = 0.55891; DD vs. AA p = 0.00875.

Similar articles

References

    1. Olayioye M.A., Noll B., Hausser A. Spatiotemporal Control of Intracellular Membrane Trafficking by Rho GTPases. Cells. 2019;8:1478. doi: 10.3390/cells8121478. - DOI - PMC - PubMed
    1. Phuyal S., Farhan H. Multifaceted Rho GTPase Signaling at the Endomembranes. Front. Cell Dev. Biol. 2019;7:127. doi: 10.3389/fcell.2019.00127. - DOI - PMC - PubMed
    1. Bos J.L., Rehmann H., Wittinghofer A. GEFs and GAPs: critical elements in the control of small G proteins. Cell. 2007;129:865–877. doi: 10.1016/j.cell.2007.05.018. - DOI - PubMed
    1. Durkin M.E., Yuan B.-Z., Zhou X., Zimonjic D.B., Lowy D.R., Thorgeirsson S.S., Popescu N.C. DLC-1:a Rho GTPase-activating protein and tumour suppressor. J. Cell Mol. Med. 2007;11:1185–1207. doi: 10.1111/j.1582-4934.2007.00098.x. - DOI - PMC - PubMed
    1. Braun A.C., Olayioye M.A. Rho regulation: DLC proteins in space and time. Cell. Signal. 2015;27:1643–1651. doi: 10.1016/j.cellsig.2015.04.003. - DOI - PubMed

LinkOut - more resources