. 2024 Jun 18;10(12):e33051.
doi: 10.1016/j.heliyon.2024.e33051. eCollection 2024 Jun 30.

iTRAQ-based quantitative proteomics revealing the therapeutic mechanism of a medicinal and edible formula YH0618 in reducing doxorubicin-induced alopecia by targeting keratins and TGF-β/Smad3 pathway

Affiliations

iTRAQ-based quantitative proteomics revealing the therapeutic mechanism of a medicinal and edible formula YH0618 in reducing doxorubicin-induced alopecia by targeting keratins and TGF-β/Smad3 pathway

Renkai Li et al. Heliyon. .

Abstract

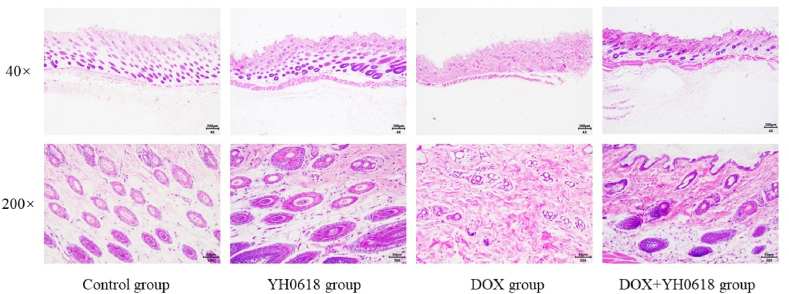
YH0618, a medicinal and edible formulation, has demonstrated the potential to alleviate doxorubicin-induced alopecia in animal studies and clinical trials. However, the mechanisms underlying its therapeutic effects remain unexplored. The objective of this study was to ascertain possible therapeutic targets of YH0618 in the treatment of doxorubicin-induced alopecia. The assessment of hair loss was conducted through the measurement of the proportion of the affected area and the examination of skin histology. Isobaric tags for relative and absolute quantification (iTRAQ) in quantitative proteomics was employed to discern proteins that exhibited variable expressions. The major proteins associated with doxorubicin-induced alopecia were identified using gene ontology (GO) and Kyoto Encyclopedia of Genes and Genomes (KEGG) pathway analysis. The interaction network of the differentially expressed proteins was constructed using the STRING database and the Python software. The study analyzed a total of 3894 proteins extracted from the skin tissue of mice. Doxorubicin treatment resulted in the upregulation of 18 distinct proteins, whereas one differential protein was found to be downregulated. The above effects were reinstated after the administration of the YH0618 therapy. The bioinformatic study revealed that the identified proteins exhibited enrichment in many biological processes, including staphylococcus aureus infection, estrogen signaling route, pyruvate metabolism, chemical carcinogenesis, and PPAR signaling pathway. The results of Western blot revealed that the levels of keratin 81 (Krt81), keratin 34 (Krt34), keratin 33a (Krt33a), and Sma and MAD-related protein 3 (Smad3) were upregulated in response to doxorubicin treatment, and were attenuated by the administration of YH0618. These four proteins are likely to correlate with DOX-induced alopecia and serve as promising therapeutic targets for YH0618. This work presents significant insights and empirical evidence for comprehending the process underlying chemotherapy-induced alopecia, paving the way for exploring innovative therapeutic or preventive strategies employing herbal items.

Keywords: Alopecia; Doxorubicin; Herbal formula; Network pharmacology; Proteomics.


Conflict of interest statement

The authors declare that they have no known competing financial interests or personal relationships that could have appeared to influence the work reported in this paper.

Figures

Image 1
Graphical abstract
Fig. 1
Fig. 1
Skin color changes and hair growth of mice at different time points of treatment. The hair shafts in an area of 1.5 cm × 2 cm were shaved. The dorsal skin of mice was treated with depilatory cream. The homogeneous pink color of the skin revealed the telogen phase of the hairs. Depilation at this hair stage induced the development of a synchronous anagen stage. The mice were randomly divided into the control group, YH0618 group, DOX group, and DOX + YH0618 group. After 3-week treatment, the mice were sacrificed under anesthesia. The skin samples were collected for further analysis. (For interpretation of the references to color in this figure legend, the reader is referred to the Web version of this article.)
Fig. 2
Fig. 2
Representative HE-stained sections of skin. The skin tissues were fixed with 4 % paraformaldehyde, embedded in paraffin, and sectioned. The tissue sections were stained with hematoxylin-eosin trichrome for histological evaluation under microscopy (40 × , 200 × ).
Fig. 3
Fig. 3
iTRAQ quantitative proteomic analysis of DEPs after YH0618 treatment. Volcano plot was performed using the data of the proteins between the control group and DOX group (A), DOX group and DOX + YH0618 group (B) (Logarithmic transformation based on 10, Student's t-test). The significantly downregulated proteins were annotated in blue (FC < 0.83 and P < 0.05), the significantly upregulated proteins were annotated in red (FC > 1.2 and P < 0.05), and the proteins without differences were indicated in grey. Hierarchical clustering results between the control group and DOX group (C), DOX group and DOX + YH0618 group (D) were presented as a tree-type heatmap with the abscissa showing the samples and the ordinate showing the significant DEPs. The expression levels of the significantly differential proteins in different samples were exhibited in the heatmap by different colors after normalization using the log2 method, in which red dots represent the significantly upregulated proteins, blue dots represent the significantly downregulated proteins, and grey dots represent proteins with no quantitative information. (For interpretation of the references to color in this figure legend, the reader is referred to the Web version of this article.)
Fig. 4
Fig. 4
A Venn diagram analysis of DEPs. (A) The green circle represents 386 up-regulated proteins in the DOX group compared with the control group; the blue circle represents 54 down-regulated proteins in the DOX + YH0618 group compared with the DOX group; the overlapping area presents 18 reversed differential proteins after YH0618 treatment. (B) The green circle represents 59 down-regulated proteins in the DOX group compared with the control group; the blue circle represents 48 up-regulated proteins in the DOX + YH0618 group compared with the DOX group; overlapping area presents 1 reversed differential protein after YH0618 administration. (For interpretation of the references to color in this figure legend, the reader is referred to the Web version of this article.)
Fig. 5
Fig. 5
GO analysis of the reversed DEPs in mice skin tissue after YH0618 administration. The abscissa represents the GO entry name, and the ordinate represents the number and percentage of proteins corresponding to the entry.
Fig. 6
Fig. 6
KEGG pathway analysis of the reversed DEPs in mice skin tissue after YH0618 treatment. The abscissa represents the enrichment score, and the ordinate represents the pathway information with the top 20 enrichment score. The color changing from red and green to blue and violet represents the p-value. The bubble size represents the number of significant modular proteins, with a larger area indicating a greater number of proteins. (For interpretation of the references to color in this figure legend, the reader is referred to the Web version of this article.)
Fig. 7
Fig. 7
PPI analysis of DEPs affected by YH0618 treatment. Circles represent differential proteins/genes. The size of circles represents the degree of connectivity, with larger circles indicating higher connectivity.
Fig. 8
Fig. 8
Western blot analysis of Krt81, Krt34, Krt33a, Krt33b, and Smad3. Skin tissues of the mice were collected for Western blotting analysis. (A) The expressions of Krt81, Krt34, Krt33a, Krt33b, and Smad3 were analyzed by Western blotting. (B) Quantitative analysis of related protein bands and the intensities of them were normalized to that of GAPDH bands. The original blots were included in Supplementary Material (Fig. S1). #represents a significant difference compared to the control group (#P < 0.05; ##P < 0.01); *represents significant difference compared to the DOX group (*P < 0.05; **P < 0.01).

References

    1. West H. Chemotherapy-induced hair loss (alopecia) JAMA Oncol. 2017;3(8):1147. doi: 10.1001/jamaoncol.2017.1026. - DOI - PubMed
    1. Paus R., Haslam I., Sharov A.A., Botchkarev V.A. Pathobiology of chemotherapy-induced hair loss. Lancet Oncol. 2013;14(2):E50–E59. doi: 10.1016/S1470-2045(12)70553-3. - DOI - PubMed
    1. Boland V., Brady A.M., Drury A. More than the loss of hair: the experience of chemotherapy-induced alopecia for women: an integrative review. Ann. Oncol. 2021;32:S1279–S1280. doi: 10.1016/j.annonc.2021.08.697. - DOI
    1. Rubio-Gonzalez B., Juhasz M., Fortman J., Mesinkovska N.A. Pathogenesis and treatment options for chemotherapy-induced alopecia: a systematic review. Int. J. Dermatol. 2018;57(12):1417–1424. doi: 10.1111/ijd.13906. - DOI - PubMed
    1. Sikora M., Rudnicka L. Chemotherapy-induced alopecia - the urgent need for treatment options. J. Eur. Acad. Dermatol. 2019;33(2):E69–E70. doi: 10.1111/jdv.15207. - DOI - PubMed

LinkOut - more resources