

Transcriptome analysis combined with Mendelian randomization screening for biomarkers causally associated with diabetic retinopathy
- PMID: 39022342
- PMCID: PMC11251905
- DOI: 10.3389/fendo.2024.1410066
Transcriptome analysis combined with Mendelian randomization screening for biomarkers causally associated with diabetic retinopathy
Abstract
Background: Diabetic retinopathy (DR) is considered one of the most severe complications of diabetes mellitus, but its pathogenesis is still unclear. We hypothesize that certain genes exert a pivotal influence on the progression of DR. This study explored biomarkers for the diagnosis and treatment of DR through bioinformatics analysis.
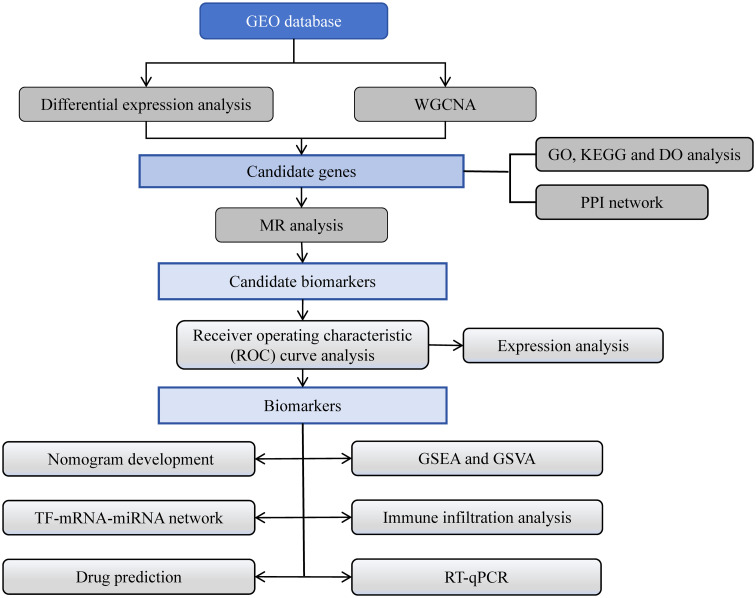
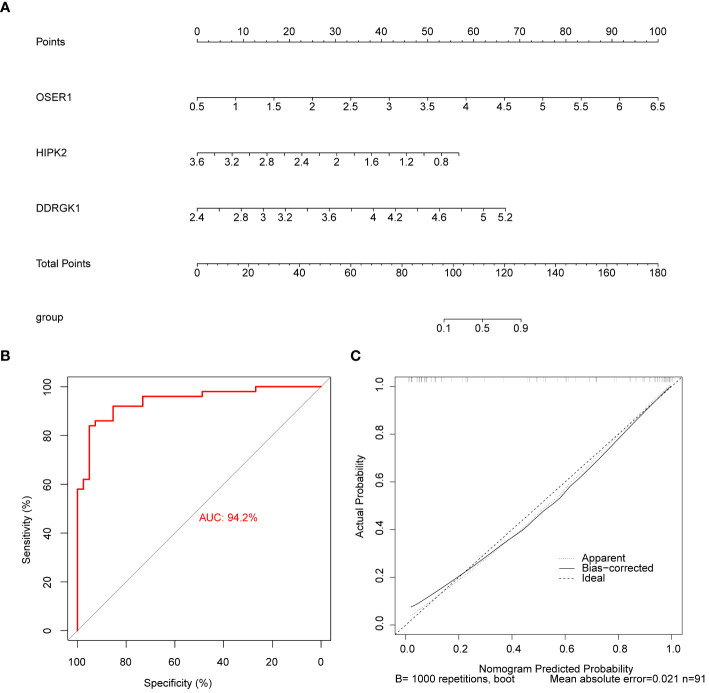
Methods: Within the GSE221521 and GSE189005 datasets, candidate genes were acquired from intersections of genes obtained using WGCNA and DESeq2 packages. Mendelian randomization (MR) analysis selected candidate biomarkers exhibiting causal relationships with DR. Receiver Operating Characteristic (ROC) analysis determined the diagnostic efficacy of biomarkers, the expression levels of biomarkers were verified in the GSE221521 and GSE189005 datasets, and a nomogram for diagnosing DR was constructed. Enrichment analysis delineated the roles and pathways associated with the biomarkers. Immune infiltration analysis analyzed the differences in immune cells between DR and control groups. The miRNet and networkanalyst databases were then used to predict the transcription factors (TFs) and miRNAs, respectively, of biomarkers. Finally, RT-qPCR was used to verify the expression of the biomarkers in vitro.
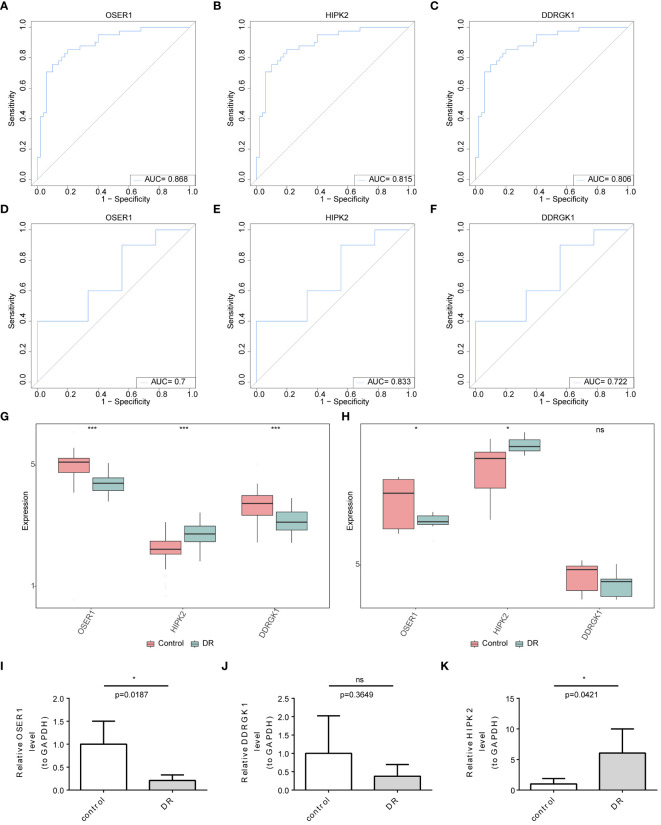
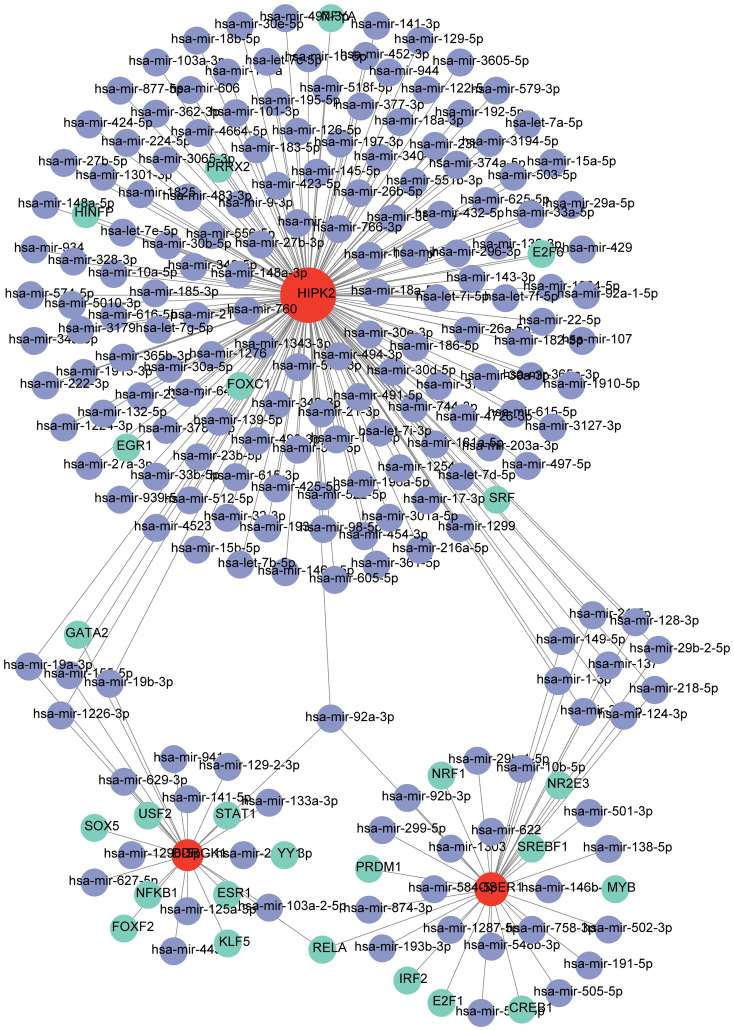
Results: MR analysis identified 13 candidate biomarkers that had causal relationships with DR. The ROC curve demonstrated favorable diagnostic performance of three biomarkers (OSER1, HIPK2, and DDRGK1) for DR, and their expression trends were consistent across GSE221521 and GSE189005 datasets. The calibration curves and ROC curves indicated good predictive performance of the nomogram. The biomarkers were enriched in pathways of immune, cancer, amino acid metabolism, and oxidative phosphorylation. Ten immune cell lines showed notable disparities between the DR and control groups. Among them, effector memory CD8+ T cells, plasmacytoid dendritic cells, and activated CD4+ T cells exhibited good correlation with biomarker expression. The TF-mRNA-miRNA network suggested that hsa-mir-92a-3p, GATA2, and RELA play important roles in biomarker targeting for DR. RT-qPCR results also demonstrated a notably high expression of HIPK2 in patients with DR, whereas notably low expression of OSER1.
Conclusion: OSER1, HIPK2, and DDRGK1 were identified as biomarkers for DR. The study findings provide novel insights into the pathogenesis of DR.
Keywords: Mendelian randomization; diabetic retinopathy; enrichment analysis; immune infiltration; regulatory network.
Copyright © 2024 Liu, Li, Tang, Zhou, Zhao, Zhang and Zhang.
Conflict of interest statement
The authors declare that the research was conducted in the absence of any commercial or financial relationships that could be construed as a potential conflict of interest.
Figures


Similar articles
-
Transcriptome sequencing and Mendelian randomization analysis identified biomarkers related to neutrophil extracellular traps in diabetic retinopathy.Front Immunol. 2024 Oct 17;15:1408974. doi: 10.3389/fimmu.2024.1408974. eCollection 2024. Front Immunol. 2024. PMID: 39483475 Free PMC article.
-
Identification of macrophage polarisation and mitochondria-related biomarkers in diabetic retinopathy.J Transl Med. 2025 Jan 6;23(1):23. doi: 10.1186/s12967-024-06038-1. J Transl Med. 2025. PMID: 39762849 Free PMC article.
-
Transcriptome combined with Mendelian randomization to screen key genes associated with mitochondrial and programmed cell death causally associated with diabetic retinopathy.Front Endocrinol (Lausanne). 2024 Nov 20;15:1422787. doi: 10.3389/fendo.2024.1422787. eCollection 2024. Front Endocrinol (Lausanne). 2024. PMID: 39634176 Free PMC article.
-
hsa-mir-(4328, 4422, 548z and -628-5p) in diabetic retinopathy: diagnosis, prediction and linking a new therapeutic target.Acta Diabetol. 2023 Jul;60(7):929-942. doi: 10.1007/s00592-023-02077-0. Epub 2023 Mar 31. Acta Diabetol. 2023. PMID: 37002321 Review.
-
Circulating MicroRNAs as Potential Diagnostic Biomarkers for Diabetic Retinopathy: A Meta-Analysis.Front Endocrinol (Lausanne). 2022 Jul 8;13:929924. doi: 10.3389/fendo.2022.929924. eCollection 2022. Front Endocrinol (Lausanne). 2022. PMID: 35898469 Free PMC article. Review.
Cited by
-
Unveiling prognostic value of JAK/STAT signaling pathway related genes in colorectal cancer: a study of Mendelian randomization analysis.Infect Agent Cancer. 2025 Feb 7;20(1):9. doi: 10.1186/s13027-025-00640-8. Infect Agent Cancer. 2025. PMID: 39920741 Free PMC article.
-
Non-ocular biomarkers for early diagnosis of diabetic retinopathy by non-invasive methods.Front Endocrinol (Lausanne). 2025 Mar 12;16:1496851. doi: 10.3389/fendo.2025.1496851. eCollection 2025. Front Endocrinol (Lausanne). 2025. PMID: 40144294 Free PMC article. Review.
-
Retinal Biomarkers in Diabetic Retinopathy: From Early Detection to Personalized Treatment.J Clin Med. 2025 Feb 18;14(4):1343. doi: 10.3390/jcm14041343. J Clin Med. 2025. PMID: 40004872 Free PMC article. Review.
-
Identification of biomarkers for endometriosis based on summary-data-based Mendelian randomization and machine learning.Medicine (Baltimore). 2025 Apr 4;104(14):e41804. doi: 10.1097/MD.0000000000041804. Medicine (Baltimore). 2025. PMID: 40193647 Free PMC article.
-
Advancements in diabetic retinopathy: Insights and future directions.World J Methodol. 2025 Jun 20;15(2):99454. doi: 10.5662/wjm.v15.i2.99454. eCollection 2025 Jun 20. World J Methodol. 2025. PMID: 40548223 Free PMC article.
References
MeSH terms
Substances
LinkOut - more resources
Full Text Sources
Medical
Research Materials
Miscellaneous