

Spatiotemporal dynamics of epidemiology diseases: mobility based risk and short-term prediction modeling of COVID-19
- PMID: 39022425
- PMCID: PMC11251998
- DOI: 10.3389/fpubh.2024.1359167
Spatiotemporal dynamics of epidemiology diseases: mobility based risk and short-term prediction modeling of COVID-19
Abstract
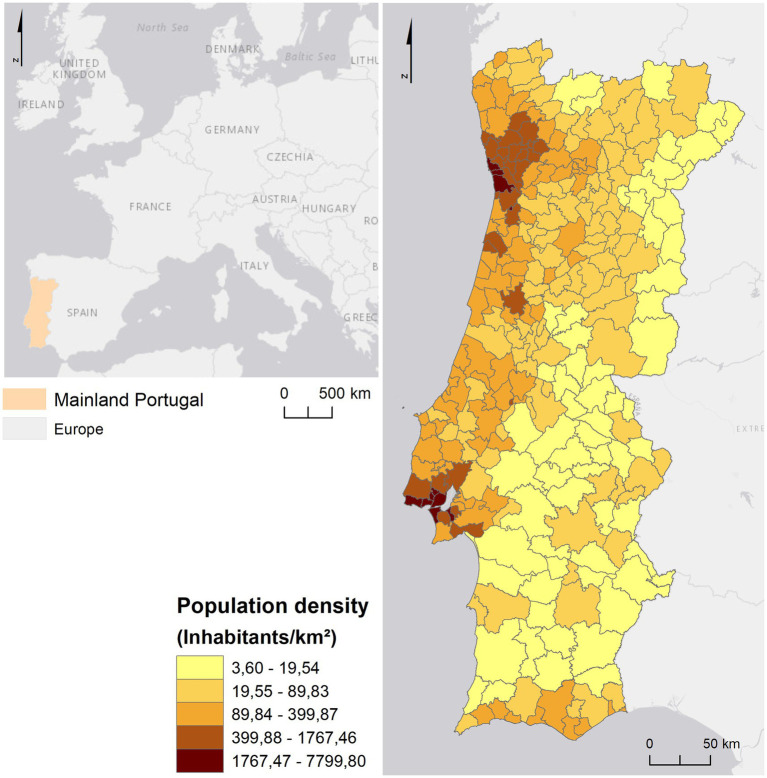
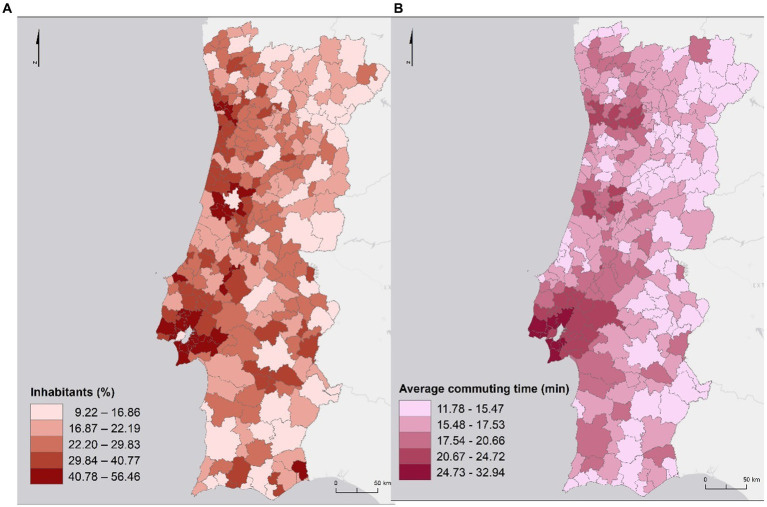
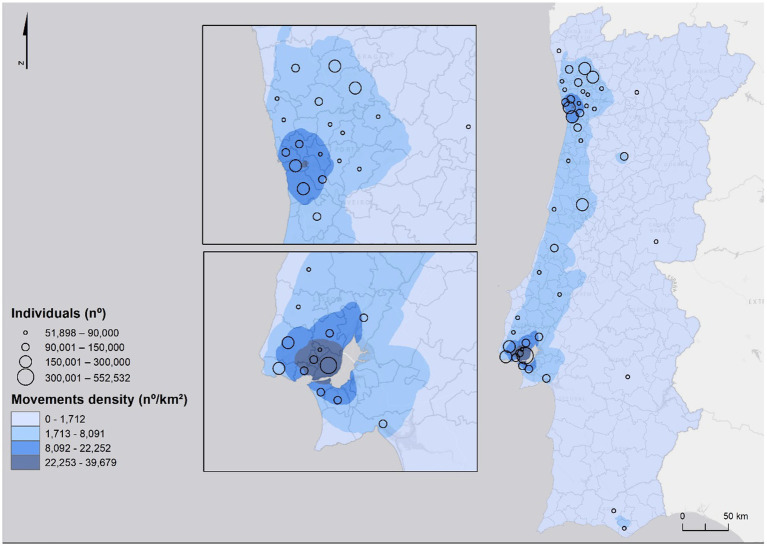
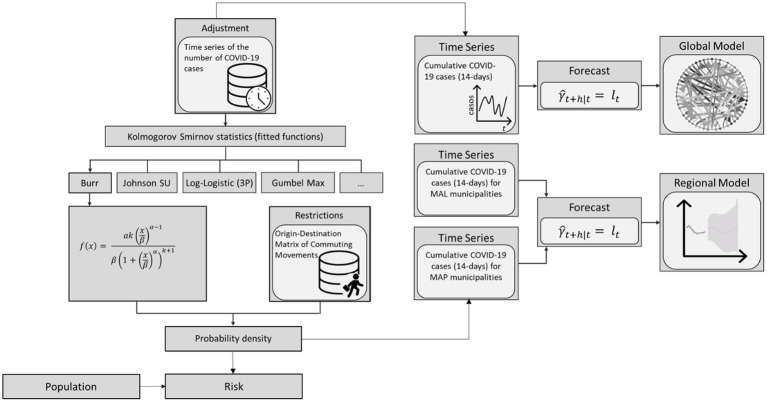
Nowadays, epidemiological modeling is applied to a wide range of diseases, communicable and non-communicable, namely AIDS, Ebola, influenza, Dengue, Malaria, Zika. More recently, in the context of the last pandemic declared by the World Health Organization (WHO), several studies applied these models to SARS-CoV-2. Despite the increasing number of researches using spatial analysis, some constraints persist that prevent more complex modeling such as capturing local epidemiological dynamics or capturing the real patterns and dynamics. For example, the unavailability of: (i) epidemiological information such as the frequency with which it is made available; (ii) sociodemographic and environmental factors (e.g., population density and population mobility) at a finer scale which influence the evolution patterns of infectious diseases; or (iii) the number of cases information that is also very dependent on the degree of testing performed, often with severe territorial disparities and influenced by context factors. Moreover, the delay in case reporting and the lack of quality control in epidemiological information is responsible for biases in the data that lead to many results obtained being subject to the ecological fallacy, making it difficult to identify causal relationships. Other important methodological limitations are the control of spatiotemporal dependence, management of non-linearity, ergodicy, among others, which can impute inconsistencies to the results. In addition to these issues, social contact, is still difficult to quantify in order to be incorporated into modeling processes. This study aims to explore a modeling framework that can overcome some of these modeling methodological limitations to allow more accurate modeling of epidemiological diseases. Based on Geographic Information Systems (GIS) and spatial analysis, our model is developed to identify group of municipalities where population density (vulnerability) has a stronger relationship with incidence (hazard) and commuting movements (exposure). Specifically, our framework shows how to operate a model over data with no clear trend or seasonal pattern which is suitable for a short-term predicting (i.e., forecasting) of cases based on few determinants. Our tested models provide a good alternative for when explanatory data is few and the time component is not available, once they have shown a good fit and good short-term forecast ability.
Keywords: ergodic; forecasting; mobility; non-linearity; risk; simple exponential smoothing.
Copyright © 2024 Silva, Viana, Betco, Nogueira, Roquette and Rocha.
Conflict of interest statement
The authors declare that the research was conducted in the absence of any commercial or financial relationships that could be construed as a potential conflict of interest.
Figures
Similar articles
-
Modeling epidemic dynamics using Graph Attention based Spatial Temporal networks.PLoS One. 2024 Jul 15;19(7):e0307159. doi: 10.1371/journal.pone.0307159. eCollection 2024. PLoS One. 2024. PMID: 39008489 Free PMC article.
-
Effectiveness and cost-effectiveness of four different strategies for SARS-CoV-2 surveillance in the general population (CoV-Surv Study): a structured summary of a study protocol for a cluster-randomised, two-factorial controlled trial.Trials. 2021 Jan 8;22(1):39. doi: 10.1186/s13063-020-04982-z. Trials. 2021. PMID: 33419461 Free PMC article.
-
Spatial dynamics of COVID-19 in São Paulo: A cellular automata and GIS approach.Spat Spatiotemporal Epidemiol. 2024 Aug;50:100674. doi: 10.1016/j.sste.2024.100674. Epub 2024 Jul 8. Spat Spatiotemporal Epidemiol. 2024. PMID: 39181609
-
Weathering the pandemic: How the Caribbean Basin can use viral and environmental patterns to predict, prepare, and respond to COVID-19.J Med Virol. 2020 Sep;92(9):1460-1468. doi: 10.1002/jmv.25864. Epub 2020 Jun 2. J Med Virol. 2020. PMID: 32275090 Free PMC article. Review.
-
Statistical Modeling for the Prediction of Infectious Disease Dissemination With Special Reference to COVID-19 Spread.Front Public Health. 2021 Jun 16;9:645405. doi: 10.3389/fpubh.2021.645405. eCollection 2021. Front Public Health. 2021. PMID: 34222166 Free PMC article. Review.
References
-
- Santana P. Introdução à GEOGRAFIA DA SAÚDE Território, Saúde e Bem-Estar. Coimbra: Imprensa da Universidade de Coimbra; (2014).
-
- Earickson R. Medical geography In: Kitchin R, Thrift NBT-IE of HG , editors. International encyclopedia of human geography. Oxford: Elsevier; (2009). 9–20.
-
- Pfeiffer DU, Robinson TP, Stevenson M, Stevens KB, Rogers DJ, Clements ACA. Spatial analysis in epidemiology. Oxford, UK: Oxford University Press; (2008). 142 p.
MeSH terms
LinkOut - more resources
Full Text Sources
Medical
Miscellaneous