. 2024 Jul 17:7:0409.
doi: 10.34133/research.0409. eCollection 2024.

Helicobacter pylori-Induced Angiopoietin-Like 4 Promotes Gastric Bacterial Colonization and Gastritis

Affiliations

Helicobacter pylori-Induced Angiopoietin-Like 4 Promotes Gastric Bacterial Colonization and Gastritis

Rui Xie et al. Research (Wash D C). .

Abstract

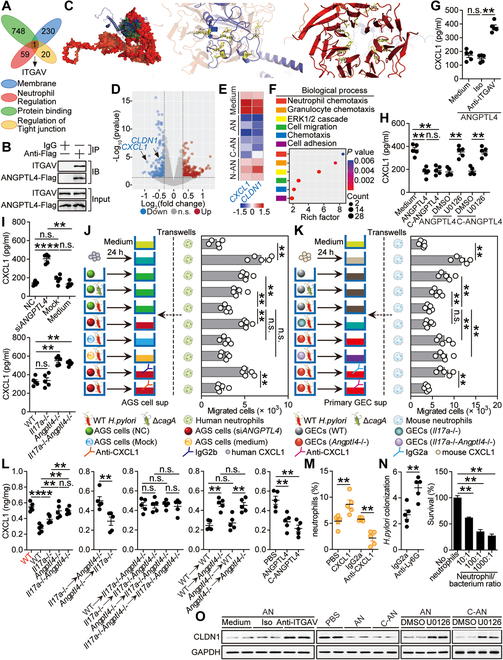
Helicobacter pylori infection is characterized as progressive processes of bacterial persistence and chronic gastritis with features of infiltration of mononuclear cells more than granulocytes in gastric mucosa. Angiopoietin-like 4 (ANGPTL4) is considered a double-edged sword in inflammation-associated diseases, but its function and clinical relevance in H. pylori-associated pathology are unknown. Here, we demonstrate both pro-colonization and pro-inflammation roles of ANGPTL4 in H. pylori infection. Increased ANGPTL4 in the infected gastric mucosa was produced from gastric epithelial cells (GECs) synergistically induced by H. pylori and IL-17A in a cagA-dependent manner. Human gastric ANGPTL4 correlated with H. pylori colonization and the severity of gastritis, and mouse ANGPTL4 from non-bone marrow-derived cells promoted bacteria colonization and inflammation. Importantly, H. pylori colonization and inflammation were attenuated in Il17a -/-, Angptl4 -/-, and Il17a -/- Angptl4 -/- mice. Mechanistically, ANGPTL4 bound to integrin αV (ITGAV) on GECs to suppress CXCL1 production by inhibiting ERK, leading to decreased gastric influx of neutrophils, thereby promoting H. pylori colonization; ANGPTL4 also bound to ITGAV on monocytes to promote CCL5 production by activating PI3K-AKT-NF-κB, resulting in increased gastric influx of regulatory CD4+ T cells (Tregs) via CCL5-CCR4-dependent migration. In turn, ANGPTL4 induced Treg proliferation by binding to ITGAV to activate PI3K-AKT-NF-κB, promoting H. pylori-associated gastritis. Overall, we propose a model in which ANGPTL4 collectively ensures H. pylori persistence and promotes gastritis. Efforts to inhibit ANGPTL4-associated pathway may prove valuable strategies in treating H. pylori infection.


Conflict of interest statement

Competing interests: The authors declare that they have no competing interests.

Figures

Fig. 1.
Fig. 1.
ANGPTL4 is increased in gastric mucosa of H. pylori-infected patients and mice. (A) Analyses of the whole-transcriptome sequencing datasets and the 3 cohorts (GSE60427_Bhutan, GSE60427_DR, and GSE60662) from 2 GEO datasets. Hierarchical clustering heatmaps of significant DEGs are shown in DEG analysis. Overlapping 3 cohorts screened and identified 226 significantly up-regulated DEGs. PPI network analysis of these 226 DEGs was performed, and the DEGs with the significance levels (P < 0.01 and correlation > 0.8) are shown in PPI network, and the top 10 DEGs as candidate genes are shown in the side table. (B) ANGPTL4 protein amounts in gastric mucosa of H. pylori-infected patients (n = 131) and uninfected donors (n = 50) were compared. (C) The correlation between ANGPTL4 protein amount and H. pylori colonization in gastric mucosa of H. pylori-infected patients was analyzed. (D) ANGPTL4 protein amounts in gastric mucosa of H. pylori-infected patients with mild (n = 34), moderate (n = 45), and severe inflammation (n = 24) and with normal gastric histopathology (n = 28) were compared. (E) ANGPTL4 protein amounts in gastric mucosa of cagA+ H. pylori-infected (n = 74), cagA H. pylori-infected (n = 57), and uninfected donors (n = 50) were compared. (F) Dynamic changes of Angptl4 gene expression in gastric mucosa of WT H. pylori-infected, ΔcagA-infected, and uninfected mice (n = 5 per group per time point). (G and H) ANGPTL4 protein expression in gastric mucosa of cagA+ H. pylori-infected, cagA H. pylori-infected, and uninfected donors or in gastric mucosa of WT H. pylori-infected, ΔcagA-infected, and uninfected mice at 12 weeks p.i. was revealed by immunohistochemical staining (G) and Western blot (H), respectively. Scale bars, 100 μm. (I and J) ANGPTL4/Angptl4 gene and ANGPTL4 protein expressions in/from human/mouse primary gastric mucosa of uninfected donors or mice infected with WT H. pylori or ΔcagA were analyzed ex vivo by real-time PCR, ELISA, and Western blot (n = 5). Data are representative of 2 independent experiments. Data are shown as mean ± SEM and analyzed by Student’s t test, Mann–Whitney U test, and one-way ANOVA. Western blot results are run in parallel and contemporaneously. *P < 0.05, **P < 0.01 for groups connected by horizontal lines or compared with uninfected mice.
Fig. 2.
Fig. 2.
H. pylori stimulates GECs to produce ANGPTL4. (A) Representative immunofluorescence staining images showing ANGPTL4-expressing (red) pepsinogen II/PGC+ GECs (green) in gastric mucosa of H. pylori-infected patients or H. pylori-infected mice. Scale bars, 100 μm. (B) ANGPTL family mRNA expressions in WT H. pylori-infected and uninfected AGS cells (MOI = 100, 6 h) were compared by microarray (n = 3). (C to E) ANGPTL4/Angptl4 gene and ANGPTL4 protein expressions in WT H. pylori-infected, ΔcagA-infected, and uninfected AGS cells (C), human primary GECs (D), or mouse primary GECs (E) (MOI = 100, 24 h), and ANGPTL4/Angptl4 gene and ANGPTL4 protein expressions in WT H. pylori-infected and uninfected AGS cells (C), human primary GECs (D), or mouse primary GECs (E) at different time points (MOI = 100) or infected with different MOIs (24 h) were analyzed by real-time PCR, ELISA, and Western blot (n = 5). (F and G) Angptl4/ANGPTL4 gene and ANGPTL4 protein expressions in WT H. pylori-infected, ΔcagA-infected, and uninfected mouse (F) and human (G) gastric organoids (MOI = 100, 24 h) were analyzed by real-time PCR, ELISA, Western blot, and immunofluorescence (n = 5). Scale bars, 50 μm. (H and I) AGS cells were pretreated with or without PP2 (H) and BAY 11-7082 (I) and then infected with WT H. pylori or ΔcagA (MOI = 100) for 24 h. ANGPTL4 gene expression and ANGPTL4, p65, and p-p65 proteins were analyzed by real-time PCR, ELISA, and Western blot (n = 5). (J and K) AGS cells were transfected with luciferase reporter constructs containing the ANGPTL4-luc promoter for 4 h. Luciferase activity was measured to assess ANGPTL4 promoter activity after WT H. pylori or ΔcagA infection (MOI = 100) for 24 h (n = 5). (L) The transcription factor binding sites were predicted by the PROMO website using a 3,000-bp conserved segment of ANGPTL4/Angptl4 promoter. A conserved sequence of NF-κB binding site with higher JASPAR scores in humans and mice. (M) ChIP assay in AGS cells infected with WT H. pylori (pretreated with or without BAY 11-7082) or ΔcagA, followed by PCR with primers designed for NF-κB binding site of ANGPTL4 promoter region (n = 5). Data are representative of 2 independent experiments. Data are shown as mean ± SEM and analyzed by Student’s t test, Mann–Whitney U test and one-way ANOVA. Western blot results are run in parallel and contemporaneously. *P < 0.05, **P < 0.01, n.s. P > 0.05 for groups connected by horizontal lines.
Fig. 3.
Fig. 3.
H. pylori and IL-17A synergistically induce ANGPTL4. (A to D) ANGPTL4/Angptl4 gene and ANGPTL4 protein expressions in AGS cells (A), human primary GECs (C), or mouse primary GECs (D) infected with WT H. pylori (MOI = 100) in the presence or absence of IL-17A (100 ng/ml) (24 h), or in AGS cells infected with WT H. pylori (MOI = 100) in the presence of IL-17A (50, 100, and 200 ng/ml) (24 h) (B) were analyzed by real-time PCR, ELISA, and Western blot (n = 5). (E) IL-17A protein expression in gastric mucosa of H. pylori-infected (n = 131) and uninfected donors (n = 50) or in gastric mucosa of cagA+ H. pylori-infected (n = 74), cagA H. pylori-infected (n = 57), and uninfected donors (n = 50) was compared. (F) IL-17A protein expression in gastric mucosa of H. pylori-infected patients with mild (n = 34), moderate (n = 45), and severe inflammation (n = 24) and with normal gastric histopathology (n = 28) was compared. (G) The correlation between ANGPTL4 protein and IL-17A protein in gastric mucosa of H. pylori-infected patients was analyzed. (H) Angptl4 gene and ANGPTL4 protein expressions in gastric mucosa of WT H. pylori-infected WT and Il17a−/− mice at 12 weeks p.i. were compared (n = 5). (I) ANGPTL4/Angptl4 gene and ANGPTL4 protein expressions in mouse and human gastric organoids infected with WT H. pylori (MOI = 100) in the presence or absence of IL-17A (100 ng/ml) (24 h) were analyzed by real-time PCR, ELISA, and Western blot (n = 5). (J) AGS cells were pretreated with signal pathway inhibitors and then infected with WT H. pylori (MOI = 100) in the presence of IL-17A (100 ng/ml) (24 h). ANGPTL4 protein in AGS cells was compared (n = 5). (K and L) AGS cells were pretreated with or without BAY 11-7082 and then infected with WT H. pylori (MOI = 100) in the presence or absence of IL-17A (100 ng/ml) (24 h). ANGPTL4 gene expression and ANGPTL4, p65, and p-p65 proteins were analyzed by real-time PCR, ELISA, and Western blot (n = 5). (M) AGS cells were pretreated with anti-IL-17A and/or aiti-IL-17RA Abs and then infected with WT H. pylori (MOI = 100) in the presence of IL-17A (100 ng/ml) (24 h). ANGPTL4 gene expression and ANGPTL4, p65, and p-p65 proteins were analyzed by real-time PCR, ELISA, and Western blot (n = 5). Data are representative of 2 independent experiments. Data are shown as mean ± SEM and analyzed by Student’s t test, Mann–Whitney U test, and one-way ANOVA. Western blot results are run in parallel and contemporaneously. *P < 0.05, **P < 0.01, n.s. P > 0.05 for groups connected by horizontal lines.
Fig. 4.
Fig. 4.
ANGPTL4 increases bacterial burden, inflammation, and Treg accumulation but decreases neutrophil accumulation and CLDN1 expression in gastric mucosa during H. pylori infection. (A and B) The bacteria colonization (A) and histological scores of inflammation (B) in gastric mucosa of WT H. pylori-infected WT, Il17a−/−, Angptl4−/−, and Il17a−/−Angptl4−/− mice or in gastric mucosa of WT H. pylori-infected BM chimera mice at 12 weeks p.i. were compared (n = 5). (C and E) The levels of neutrophils (C) and Tregs (E) in gastric mucosa of uninfected WT mice (red) and WT H. pylori-infected WT, Il17a−/−, Angptl4−/−, and Il17a−/−Angptl4−/− mice or in gastric mucosa of WT H. pylori-infected BM chimera mice at 12 weeks p.i. were compared (n = 5). Results are expressed as the percentage of neutrophils in CD45+ cells and the percentage of Tregs among CD4+ T cells. (D and F) Representative dot plots of neutrophils (D) or Tregs (F) (defined as described in Fig. S4A) in gastric mucosa of uninfected WT mice (red) and WT H. pylori-infected WT, Il17a−/−, Angptl4−/−, and Il17a−/−Angptl4−/− mice at 12 weeks p.i. (G) CLDN1 proteins in gastric mucosa of uninfected WT mice (red) and WT H. pylori-infected WT, Il17a−/−, Angptl4−/−, and Il17a−/−Angptl4−/− mice or in gastric mucosa of WT H. pylori-infected BM chimera mice at 12 weeks p.i. were analyzed. (H) The bacteria colonization, histological scores of inflammation, and the levels of neutrophils and Tregs in gastric mucosa of WT mice injected with ANGPTL4, cANGPTL4, or PBS control at 12 weeks p.i. were compared (n = 5). (I) CLDN1 proteins in gastric mucosa of WT mice injected with ANGPTL4, cANGPTL4, or PBS control at 12 weeks p.i. were analyzed. (J) The correlation between ANGPTL4 expression and CLDN1 expression in gastric mucosa of H. pylori-infected patients was analyzed. Results are expressed as log10(fold change). Data are representative of 2 independent experiments. Data are shown as mean ± SEM and analyzed by Student’s t test, Mann–Whitney U test, and one-way ANOVA. Western blot results are run in parallel and contemporaneously. *P < 0.05, **P < 0.01, n.s. P > 0.05 for groups connected by horizontal lines.
Fig. 5.
Fig. 5.
ANGPTL4 suppresses CLDN1 and CXCL1 in GECs by binding to ITGAV to inhibit ERK, leading to decreased neutrophil accumulation and increased bacterial burden during H. pylori infection. (A) The members of the 4 GO terms in “Cellular Component,” “Biological Process,” “Molecular Function,” and “KEGG” (described in Fig. S13B) have overlaps by MS analysis of AGS cells expressing the Flag-tagged ANGPTL4 (ANGPTL4-Flag) immunoprecipitated (IP) with anti-Flag Abs. ITGAV is the core member of each GO terms. (B) AGS cells expressing ANGPTL4-Flag were lysed and IP with IgG or anti-Flag Abs. The IP samples were subjected to Western blot analysis with the indicated Abs to detect the interaction with ITGAV. (C) The optimally predicted protein–protein complex obtained from HADDOCK’s easy interface: left, an overarching schematic of ANGPTL4 (represented as a blue cartoon model) binding with ITGAV (indicated as a red surface model); middle, the key active residues involved in the binding of ANGPTL4 to ITGAV, denoted as yellow sticks within the blue structural domain of ANGPTL4; right, the key active residues crucial for ITGAV binding with ANGPTL4, denoted as yellow sticks within the red structural domain of ITGAV. (D) VolcanoPlot reveals gene changes in AGS cells stimulated with ANGPTL4 (1 μg/ml) for 24 h. (E) Heatmap reveals CXCL1 and CLDN1 changes in AGS cells stimulated with ANGPTL4, cANGPTL4, or nANGPTL4 (1 μg/ml) for 24 h. (F) Compared to unstimulated AGS cells, significantly changed genes in ANGPTL4-stimulated AGS cells were clustered with GO analysis, and the top 6 GO terms of “Biological Process” are shown. (G) AGS cells were pretreated with anti-ITGAV Abs and then stimulated with ANGPTL4 (1 μg/ml) for 24 h. CXCL1 production was measured in cell culture supernatants by ELISA (n = 5). (H) AGS cells were pretreated with U0126 and then stimulated with ANGPTL4 or cANGPTL4 (1 μg/ml) for 24 h. CXCL1 production was measured in cell culture supernatants by ELISA (n = 5). (I) ANGPTL4 siRNA, nonspecific control siRNA (NC), or Lipofectamine 2000 only (mock) pretreated AGS cells and primary GECs from uninfected WT, Il17a−/−, Angptl4−/−, and Il17a−/−Angptl4−/− mice were infected with WT H. pylori (MOI = 100) for 24 h. CXCL1 production was measured in cell culture supernatants by ELISA (n = 5). (J and K) Neutrophil migrations were assessed by transwell assays as described in Methods and statistically analyzed (n = 5). (L) CXCL1 proteins in gastric mucosa of uninfected WT mice (red) and WT H. pylori-infected WT, Il17a−/−, Angptl4−/−, and Il17a−/−Angptl4−/− mice, in gastric mucosa of WT H. pylori-infected BM chimera mice, or in gastric mucosa of WT mice injected with ANGPTL4, cANGPTL4, or PBS control at 12 weeks p.i. were compared (n = 5). (M) The neutrophil percentages in gastric mucosa of WT H. pylori-infected mice injected with CXCL1 or PBS control, or anti-CXCL1 Abs or control IgG at 12 weeks p.i. were compared (n = 5). Results are expressed as the percentage of neutrophils in CD45+ cells. (N) Left: Bacteria colonization in gastric mucosa of WT H. pylori-infected mice injected with anti-Ly6G Abs or control IgG at 12 weeks p.i. was compared (n = 5). Right: Killing of H. pylori in vitro by human neutrophils at the indicated neutrophil/bacterium ratios. Bacterial survival was measured as described in Methods and statistically analyzed (n = 3). (O) CLDN1 proteins in AGS cells stimulated with ANGPTL4 or cANGPTL4 (1 μg/ml) (pretreated with or without U0126 or anti-ITGAV Abs) for 24 h were analyzed. Data are representative of 2 independent experiments. Data are shown as mean ± SEM and analyzed by Student’s t test, Mann–Whitney U test, and one-way ANOVA. Western blot results are run in parallel and contemporaneously. *P < 0.05, **P < 0.01, n.s. P > 0.05 for groups connected by horizontal lines. sup, supernatant.
Fig. 6.
Fig. 6.
ANGPTL4 promotes CCL5 production in monocytes by binding to ITGAV to activate NF-κB, leading to increased Treg accumulation during H. pylori infection. (A) The expressions of chemokine family members in gastric mucosa of WT H. pylori-infected WT and Angptl4−/− mice at 12 weeks p.i. were analyzed by real-time PCR (n = 5). (B) CCL5 proteins in gastric mucosa of uninfected WT mice (red) and WT H. pylori-infected WT, Il17a−/−, Angptl4−/− and Il17a−/−Angptl4−/− mice, in gastric mucosa of WT H. pylori-infected BM chimera mice, or in gastric mucosa of WT mice injected with ANGPTL4, cANGPTL4, or PBS control at 12 weeks p.i. were compared (n = 5). (C) The correlations between ANGPTL4 expression and CCL5 expression, and between CCL5 expression and Foxp3 expression in gastric mucosa of H. pylori-infected patients were analyzed. Results are expressed as log10(fold change). (D) Representative immunofluorescence staining images showing CCL5-expressing (green) CD14+ monocytes (red) in gastric mucosa from H. pylori-infected patients. (E) Human (left panel) or mouse (right panel) monocytes were pretreated with wortmannin or BAY 11-7082 and then stimulated with ANGPTL4 or cANGPTL4 (1 μg/ml) for 24 h. CCL5 production was measured in cell culture supernatants by ELISA (n = 5). (F) Representative dot plots of Tregs and CCR4 expression on Tregs in blood from H. pylori-infected patients or WT H. pylori-infected mice at 12 weeks p.i. (G) The Treg levels in gastric mucosa of WT H. pylori-infected mice injected with CCL5 or PBS control, and/or anti-CCR4 Abs or control IgG at 12 weeks p.i. were compared (n = 5). Results are expressed as the percentage of Tregs among CD4+ T cells. (H) Monocytes were pretreated with anti-ITGAV Abs and then stimulated with ANGPTL4 (1 μg/ml) for 6 or 24 h. CCL5 production, AKT and p-AKT, and p65 and p-p65 proteins were analyzed by ELISA (at 24 h) and Western blot (at 6 h) (n = 5). (I and J) Treg migrations were assessed by transwell assays as described in Methods and statistically analyzed (n = 5). Data are representative of 2 independent experiments. Data are shown as mean ± SEM and analyzed by Student’s t test, Mann–Whitney U test, and one-way ANOVA. Western blot results are run in parallel and contemporaneously. *P < 0.05, **P < 0.01, n.s. P > 0.05 for groups connected by horizontal lines.
Fig. 7.
Fig. 7.
ANGPTL4 promotes Treg proliferation by binding to ITGAV to activate NF-κB, aggravating inflammation during H. pylori infection. (A) The correlations between ANGPTL4 expression and CD25 expression, and between ANGPTL4 expression and Foxp3 expression in gastric mucosa of H. pylori-infected patients were analyzed. Results are expressed as log10(fold change). (B) Tregs were pretreated with anti-ITGAV Abs and then stimulated with ANGPTL4 or cANGPTL4 (1 μg/ml) for 6 h. AKT and p-AKT and p65 and p-p65 proteins were analyzed by Western blot. (C) Tregs were pretreated with anti-ITGAV Abs and then stimulated with ANGPTL4 (1 μg/ml) for 6 h. AKT and p-AKT and p65 and p-p65 proteins were analyzed by Western blot. (D to F) CFSE-labeled Tregs from H. pylori-infected patients were pretreated with anti-ITGAV Abs and cultured with ANGPTL4 (1 μg/ml) for 5 d (D), or were cultured with ANGPTL4 or cANGPTL4 (1 μg/ml) for 5 d (E), or were pretreated with wortmannin or BAY 11-7082 and cultured with ANGPTL4 (1 μg/ml) for 5 d (F). Representative data and statistical analysis of Treg proliferation were shown (n = 5). (G to I) CFSE-labeled Tregs from WT H. pylori-infected mice (12 weeks p.i.) were pretreated with anti-ITGAV Abs and cultured with ANGPTL4 (1 μg/ml) for 5 d (G), or were cultured with ANGPTL4 or cANGPTL4 (1 μg/ml) for 5 d (H), or were pretreated with wortmannin or BAY 11-7082 and cultured with ANGPTL4 (1 μg/ml) for 5 d (I). Representative data and statistical analysis of Treg proliferation were shown (n = 5). (J) Foxp3 expression in gastric mucosa of H. pylori-infected patients with mild (n = 34), moderate (n = 45), and severe inflammation (n = 24) and with normal gastric histopathology (n = 28) was compared. ANGPTL4 expression in gastric mucosa of patients with gastritis (n = 103) or with gastric ulcer (n = 32) was compared. ANGPTL4 proteins in gastric mucosa of H. pylori-infected patients with mild, moderate, and severe inflammation and with normal gastric histopathology or in gastric mucosa of patients with gastritis or with gastric ulcer were analyzed by Western blot. (K) The histological scores of inflammation in gastric mucosa of WT mice injected with anti-CD25 Abs or control IgG at 12 weeks p.i. were compared (n = 5). (L) Proposed model of cross-talk among H. pylori, GECs, monocytes, and Tregs, facilitated by IL-17A, ANGPTL4, and ITGAV, leading to ANGPTL4-mediated pro-colonization and pro-inflammation in gastric mucosa during H. pylori infection. Data are representative of 2 independent experiments. Data are shown as mean ± SEM and analyzed by Student’s t test, Mann–Whitney U test, and one-way ANOVA. Western blot results are run in parallel and contemporaneously. *P < 0.05, **P < 0.01, n.s. P > 0.05 for groups connected by horizontal lines.

References

    1. Hooi JKY, Lai WY, Ng WK, Suen MMY, Underwood FE, Tanyingoh D, Malfertheiner P, Graham DY, Wong VWS, Wu JCY, et al. . Global prevalence of Helicobacter pylori infection: Systematic review and meta-analysis. Gastroenterology. 2017;153(2):420–429. - PubMed
    1. Polk DB, Peek RM Jr. Helicobacter pylori: Gastric cancer and beyond. Nat Rev Cancer. 2010;10(6):403–414. - PMC - PubMed
    1. McColl KE. Clinical practice. Helicobacter pylori infection. N Engl J Med. 2010;362(17):1597–1604. - PubMed
    1. Barcellos-Hoff MH, Lyden D, Wang TC. The evolution of the cancer niche during multistage carcinogenesis. Nat Rev Cancer. 2013;13(7):511–518. - PubMed
    1. Bergman MP, Engering A, Smits HH, Vliet SJ, Bodegraven AA, Wirth HP, Kapsenberg ML, Vandenbroucke-Grauls CM, Kooyk Y, Appelmelk BJ. Helicobacter pylori modulates the T helper cell 1/T helper cell 2 balance through phase-variable interaction between lipopolysaccharide and DC-SIGN. J Exp Med. 2004;200(8):979–990. - PMC - PubMed