. 2024 Aug 6;13(15):e034203.
doi: 10.1161/JAHA.124.034203. Epub 2024 Jul 18.

Inositol 1,4,5-Trisphosphate Receptors Regulate Vascular Smooth Muscle Cell Proliferation and Neointima Formation in Mice

Affiliations

Inositol 1,4,5-Trisphosphate Receptors Regulate Vascular Smooth Muscle Cell Proliferation and Neointima Formation in Mice

Fang Huang et al. J Am Heart Assoc. .

Abstract

Background: Vascular smooth muscle cell (VSMC) proliferation is involved in many types of arterial diseases, including neointima hyperplasia, in which Ca2+ has been recognized as a key player. However, the physiological role of Ca2+ release via inositol 1,4,5-trisphosphate receptors (IP3Rs) from endoplasmic reticulum in regulating VSMC proliferation has not been well determined.

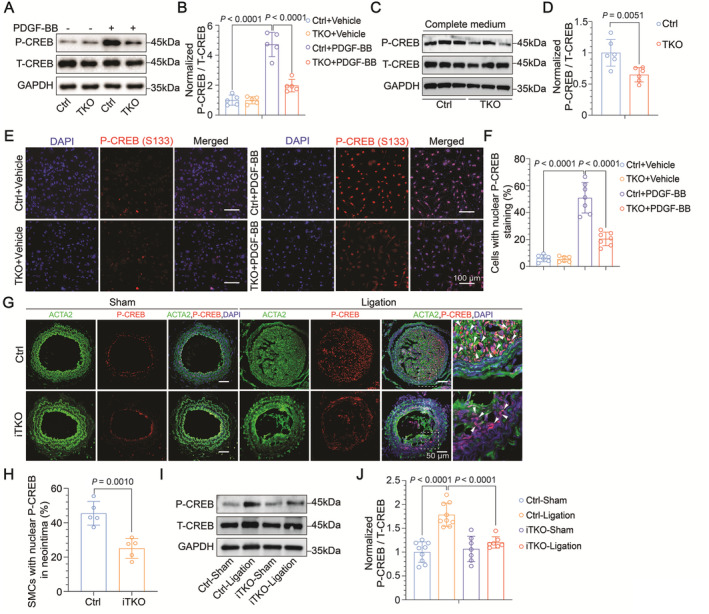
Methods and results: Both in vitro cell culture models and in vivo mouse models were generated to investigate the role of IP3Rs in regulating VSMC proliferation. Expression of all 3 IP3R subtypes was increased in cultured VSMCs upon platelet-derived growth factor-BB and FBS stimulation as well as in the left carotid artery undergoing intimal thickening after vascular occlusion. Genetic ablation of all 3 IP3R subtypes abolished endoplasmic reticulum Ca2+ release in cultured VSMCs, significantly reduced cell proliferation induced by platelet-derived growth factor-BB and FBS stimulation, and also decreased cell migration of VSMCs. Furthermore, smooth muscle-specific deletion of all IP3R subtypes in adult mice dramatically attenuated neointima formation induced by left carotid artery ligation, accompanied by significant decreases in cell proliferation and matrix metalloproteinase-9 expression in injured vessels. Mechanistically, IP3R-mediated Ca2+ release may activate cAMP response element-binding protein, a key player in controlling VSMC proliferation, via Ca2+/calmodulin-dependent protein kinase II and Akt. Loss of IP3Rs suppressed cAMP response element-binding protein phosphorylation at Ser133 in both cultured VSMCs and injured vessels, whereas application of Ca2+ permeable ionophore, ionomycin, can reverse cAMP response element-binding protein phosphorylation in IP3R triple knockout VSMCs.

Conclusions: Our results demonstrated an essential role of IP3R-mediated Ca2+ release from endoplasmic reticulum in regulating cAMP response element-binding protein activation, VSMC proliferation, and neointima formation in mouse arteries.

Keywords: Ca2+ signaling; IP3 receptor; cell proliferation; neointima formation; vascular remodeling; vascular smooth muscle cell.


Figures

Figure 1
Figure 1. All IP3R subtypes are upregulated in injured vessels undergoing neointima formation.
(A) Schematic diagram depicting the ligation of mouse LCA to induce neointima formation. (B) Representative hematoxylin and eosin–stained sections of RCA (sham) and LCA (ligation) 4 wk after the surgery. Note that the LCA section is 400 μm from the ligation knot. Scale bars, 50 μm. (C) mRNA levels of Ccnd1, Mmp2, Vcam1, Col1a1, and Col1a3 in sham and ligation arteries were measured by quantitative RT‐PCR 2 wk after the surgery. n=5–6 per group. (D) Western blots and (E) quantitative analysis of smooth muscle proliferative marker proteins (PCNA and cyclin D1) and contractile proteins (TAGLN, CNN1, ACTA2) in vessels 2 wk after the ligation. GAPDH was used as the loading control. n=5 to 7 per group. (F) mRNA levels of Itpr1, Itpr2, and Itpr3 were significantly increased in injured vessels 2 wk after the ligation. n=6 per group. (G) Western blots and (H) quantitative analysis revealed the upregulation of all 3 IP3Rs in injured vessels 2 wk after the surgery. n=6 per group. All data represent mean±SD. Significance was determined by unpaired 2‐tailed t test or unpaired 2‐tailed t test with Welch's correction (for the cases where the variances were unequal) vs sham. ACTA2 indicates actin α2; CNN1, calponin 1; IP3R, inositol 1,4,5‐trisphosphate receptor; LCA, left carotid artery; PCNA, proliferating cell nuclear antigen; RCA, right carotid artery; RT‐PCR, real‐time polymerase chain reaction; and TAGLN, transgelin.
Figure 2
Figure 2. Deletion of all IP3Rs alters Ca2+ mobilization in cultured VSMCs.
(A) Schematic diagram depicting the strategy to generate the IP3R TKO VSMCs. VSMCs were isolated from Itpr1 F/F Itpr2 F/F Itpr3 F/FsmMHC‐CreER aortas, cultured, and then treated with DMSO (vehicle) and 4‐OHT to generate control (Ctrl) and TKO VSMCs, respectively. (B) mRNA levels of Itpr1, Itpr2, and Itpr3 in control and TKO VSMCs 72 h after the administration of 4‐OHT. n=6 per group. (C) Western blots and (D) quantitative analysis of each IP3R subtypes in control and TKO VSMCs 72 h after the administration of 4‐OHT. GAPDH was used as the loading control. n=6 per group. (E) Sequential confocal images of VSMCs at the time point of t0 and t1 as indicated by the arrows in (F). VSMCs were loaded with caged IP3 and Ca2+ indicator Fluo‐4 and imaged using confocal microscopy. A short exposure (20 ms) of 405 nm UV was applied to release IP3 and induce ER Ca2+ release in the cells in region of interest (white rectangle). Scale bars, 50 μm. (F) Representative traces of Ca2+ signals in control (blue) and TKO (orange) VSMCs. (G) Statistical analysis of the amplitudes of Ca2+ signals induced by IP3 photorelease in control and TKO VSMCs. At least 20 cells per dish were measured for both control and TKO VSMCs. (H) Sequential confocal images of VSMCs at the time point of t0 and t1 as indicated by the arrows in (I). Intracellular Ca2+ mobilization was induced by the addition of PDGF‐BB. Scale bars, 50 μm. (I) Representative traces of Ca2+ signals in control (blue) and TKO (yellow) VSMCs. The traces were present as the ratio of the fluorescence at a given time (F) to the basal fluorescence (F0). (J) Statistical analysis of the amplitudes of Ca2+ signals induced by PDGF‐BB in control and TKO VSMCs. At least 20 cells per dish were measured for both control and TKO VSMCs. (K) Representative traces of spontaneous Ca2+ signals in control and TKO VSMCs. The cells were maintained in the complete medium and imaged for at least 10 min using confocal microscopy at 37 °C. Only the signal with a F/F0 25% (yellow dashed line) above the basal level (black dashed line) was counted as a detectable one. (L) Percentages of active cells that were observed with at least one spontaneous Ca2+ signal in each control and TKO dishes. n=10 dishes for control group, n=8 dishes for TKO group. (M) Distribution of numbers of Ca2+ signals in each control and TKO VSMCs. (N) Quantitative analysis of amplitudes of each Ca2+ signal in control and TKO cells. At least 20 cells per dish were imaged. All data represent mean±SD. Significance was determined by unpaired 2‐tailed t test or unpaired 2‐tailed t test with Welch's correction (for the cases where the variances were unequal) or nonparametric Mann–Whitney test (when normal distribution was not satisfied) vs control. 4‐OHT indicates 4‐hydroxytamoxifen; ER, endoplasmic reticulum; IP3, inositol 1,4,5‐trisphosphate; IP3R, inositol 1,4,5‐trisphosphate receptor; PDGF‐BB, platelet‐derived growth factor‐BB; TKO, triple knockout; and VSMC, vascular smooth muscle cell.
Figure 3
Figure 3. IP3Rs regulate cell proliferation of VSMCs in vitro.
(A) Representative images of EdU labeling of control and TKO VSMCs treated with PBS (vehicle) and PDGF‐BB, respectively. The cells were cultured in the basal medium for 24 h, treated with vehicle or PDGF‐BB (20 ng/mL) for another 48 h, and then harvested for analysis. EdU (20 μmol) was added into the medium 6 h before cell harvest. Scale bar, 50 μm. (B) Quantitative analysis of EdU‐positive control and TKO VSMCs treated with vehicle or PDGF‐BB for 48 h. n=6 per group. (C) The WST‐1 assay and quantitative analysis of OD450 for control and TKO cells. WST‐1 (10 μL) was added into the medium 24 h before cell harvest. n=5–6 per group. (D) mRNA levels of Pcna, Ccnd1, Ccnd2, Cdkn1a, and Cdkn2a were measured by quantitative RT‐PCR. n=3 per group. (E) Western blots and (F) quantitative analysis of cyclin D1 and PCNA. GAPDH was used as the loading control. n=6 per group. (G) Growth curves of control and TKO VSMCs in the complete medium. Both control and TKO VSMCs were plated with the same cell density. Afterward, cell numbers were counted every 24 h. Note that some cells were collected 72 h after plating for morphological and biochemical analysis. n=6 per group. (H) Representative images of control and TKO VSMCs 72 h after plating. Scale bar, 50 μm. (I) The WST‐1 assay and quantitative analysis of OD450 for control (n=7) and TKO (n=8) cells 72 h post plating. WST‐1 was added into the medium 48 h after plating. (J) Representative images of EdU labeling of control and TKO VSMCs 72 h after plating. EdU was added into the medium 6 h before cell harvest. Scale bar, 50 μm. (K) Quantitative analysis of EdU‐positive control (n=5) and TKO (n=7) VSMCs. (L) Western blots and (M) quantitative analysis of cyclin D1 and PCNA in control and TKO VSMCs 72 h after plating in the complete medium. GAPDH was used as the loading control. n=6 per group. All data represent mean±SD. Significance was determined by unpaired 2‐tailed t test or 2‐way ANOVA followed by a Tukey post hoc analysis vs control or vehicle. EdU indicates 5‐ethynyl‐2′‐deoxyuridine; IP3R, inositol 1,4,5‐trisphosphate receptor; PCNA, proliferating cell nuclear antigen; PDGF‐BB, platelet‐derived growth factor‐BB; RT‐PCR, real‐time polymerase chain reaction; TKO, triple knockout; and VSMC, vascular smooth muscle cell.
Figure 4
Figure 4. Smooth muscle cell–specific deletion of all 3 IP3R subtypes attenuates neointima formation induced by LCA ligation.
(A) Schematic diagram depicting how smooth muscle cell–specific iTKO mice were generated and the animals were grouped for sham and LCA ligation. Male mice with the genotype of Itpr1 F/F Itpr2 F/F Itpr3 F/F smMHC‐Cre ER+ were intraperitoneally injected with tamoxifen (Tam) and sesame oil (Oil) at the age of 8 wk to generate iTKO and control (Ctrl) mice, respectively. The ligation of LCA was performed 6 wk after the last injection. The right carotid artery was exposed but not ligated and served as sham. Both arteries were harvested 2 or 4 wk after surgery for further analysis. (B) Western blot and (C) quantitative analysis of IP3R1, IP3R2, and IP3R3 proteins in control and iTKO arteries 6 wk after the tamoxifen injection. (D) Representative hematoxylin and eosin–stained sections of sham and ligated carotid arteries collected from control and iTKO mice 4 wk after the surgery. Note that serial sections 200 to 800 μm from the ligation knot were examined for both control and iTKO injured vessels. Scale bar, 50 μm. (E) Quantitative analysis of the neointima area and the (F) ratio of neointima to medial layer in control and iTKO injured LCAs. n=8 per group. (G) Representative images of EdU labeling of smooth muscle cells in sham and ligation arteries collected from control and iTKO mice 2 wk after the surgery. The selected sections were 600 μm from the ligation knot. ACTA2 was costained to label smooth muscle cells. Scale bar, 50 μm. (H) Quantitative analysis of EdU positive smooth muscle cells in neointima of control and ligation injuried arteries. n=7 per group. (I) Western blots and (J‐K) quantitative analysis of cyclin D1 and PCNA proteins in sham and ligation arteries collected from control and iTKO mice, respectively, 2 wk after the surgery. GAPDH was used as the loading control. n=5 per group. All data represent mean±SD. Significance was determined by unpaired 2‐tailed t test or unpaired 2‐tailed t test with Welch's correction or 2‐way ANOVA followed by a Tukey post hoc analysis vs sham or control. ACTA2 indicates actin α2; IP3R, inositol 1,4,5‐trisphosphate receptor; iTKO, inositol 1,4,5‐trisphosphate receptor triple knockout; LCA, left carotid artery; and PCNA, proliferating cell nuclear antigen.
Figure 5
Figure 5. Loss of IP3Rs reduces CREB phosphorylation in VSMCs.
(A) Western blots and (B) quantification analysis of total CREB (T‐CREB) and phospho‐CREB at Ser133 (P‐CREB) in cultured VSMCs treated with PDGF‐BB. Control and TKO VSMCs were treated with PBS (vehicle) and PDGF‐BB (20 ng/mL) for 30 min, respectively, and then used for protein analysis. GAPDH was used as the loading control. The ratio of P‐CREB to T‐CREB was calculated for each group. n=5 per group. (C) Western blots and (D) quantitative analysis of T‐CREB and P‐CREB in control and TKO VSMCs cultured in the complete medium. n=6 per group. (E) Representative images of P‐CREB immunofluorescence staining in cultured control and TKO VSMCs treated with vehicle or PDGF‐BB. The nuclei were counterstained with DAPI. Scale bar, 50 μm. (F) Quantification of control and TKO VSMCs with nuclear P‐CREB staining. n=6 to 7 per group. (G) Representative images of P‐CREB immunofluorescence staining in sham and ligation arteries 4 wk after the surgery. Smooth muscle cells were stained with ACTA2. Selected sections were 200 μm from the ligation knot. Scale bar, 50 μm. (H) Quantification of smooth muscle cells with nuclear P‐CREB staining in control and iTKO‐injured vessels. n=5 per group. (I) Western blots and (J) quantitative analysis of T‐CREB and P‐CREB in sham and ligation vessels collected from control or iTKO mice 2 wk post the surgery. GAPDH was used as the loading control. n=7 to 9 per group. All data represent mean±SD. Significance was determined by unpaired 2‐tailed t test or 2‐way ANOVA followed by a Tukey post hoc analysis vs sham, vehicle or control. ACTA2 indicates actin α2; CREB, cAMP response element–binding protein; IP3R, inositol 1,4,5‐trisphosphate receptor; iTKO, inositol 1,4,5‐trisphosphate receptor triple knockout; PDGF‐BB, platelet‐derived growth factor‐BB; and VSMC, vascular smooth muscle cell.
Figure 6
Figure 6. IP3Rs regulate CREB activation via CaMKII and Akt.
(A) Protein analysis was performed to assess the effects of various inhibitors on PDGF‐BB–induced activation of CREB and Akt in cultured control VSMCs. MK2206 (5 μmol/L), KN‐93 (10 μmol/L), and H‐89 (20 μmol/L) are the inhibitors for Akt, CaMKII, and PKA, respectively. Note that KG501 is an inhibitor disrupting the interaction between CREB and CREB‐binding but not suppressing CREB phosphorylation by PDGF‐BB. (B) Quantitative analysis of the ratios of P‐CREB to T‐CREB and P‐Akt to T‐Akt. n=6 per group. (C) EdU labeling was performed to assess the effects of various inhibitors on PDGF‐BB–induced cell proliferation in cultured control VSMCs. Scale bar, 50 μm. (D) Quantitative analysis of EdU positive cells in each group. n=6 to 7 per group. (E) Western blotting and (F) quantitative analysis of cyclin D1 and PCNA protein in cultured control VSMCs treated with PDGF‐BB alone or together with various inhibitors. n=6 per group. (G) Western blots and (H) quantitative analysis of the activity of ERK1/2 and AKT in control and TKO VSMCs cultured in the complete medium. n=8 to 14 per group. (I) Western blots and (J) quantitative analysis showing that ionomycin, a Ca2+ permeable ionophore, could relieve the suppression of IP3R deletion on activation of CREB and Akt in cultured VSMCs. PKA agonist Forskolin was used as a positive control to activate CREB phosphorylation. n=6 per group. (K) Schematic diagram depicting how IP₃R‐mediated Ca2+ release in VSMCs regulates cell proliferation and neointima formation via the transcriptional factor CREB during vascular injury. All data represent mean±SD. Significance was determined by unpaired 2‐tailed t test or 2‐way ANOVA followed by a Tukey post hoc analysis. CaMKII indicates Ca2+/calmodulin‐dependent protein kinase II CREB, cAMP response element–binding protein; ERK, extracellular signal‐regulated kinase; IP3R, inositol 1,4,5‐trisphosphate receptor; PCNA, proliferating cell nuclear antigen; PDGF‐BB, platelet‐derived growth factor‐BB; PKA, protein kinase A; and VSMC, vascular smooth muscle cell.

Similar articles

Cited by

References

    1. Dzau VJ, Braun‐Dullaeus RC, Sedding DG. Vascular proliferation and atherosclerosis: new perspectives and therapeutic strategies. Nat Med. 2002;8:1249–1256. doi: 10.1038/nm1102-1249 - DOI - PubMed
    1. Owens GK, Kumar MS, Wamhoff BR. Molecular regulation of vascular smooth muscle cell differentiation in development and disease. Physiol Rev. 2004;84:767–801. doi: 10.1152/physrev.00041.2003 - DOI - PubMed
    1. Frismantiene A, Philippova M, Erne P, Resink TJ. Smooth muscle cell‐driven vascular diseases and molecular mechanisms of VSMC plasticity. Cell Signal. 2018;52:48–64. doi: 10.1016/j.cellsig.2018.08.019 - DOI - PubMed
    1. Marx SO, Totary‐Jain H, Marks AR. Vascular smooth muscle cell proliferation in restenosis. Circ Cardiovasc Interv. 2011;4:104–111. doi: 10.1161/CIRCINTERVENTIONS.110.957332 - DOI - PMC - PubMed
    1. Ghosh D, Syed AU, Prada MP, Nystoriak MA, Santana LF, Nieves‐Cintron M, Navedo MF. Calcium channels in vascular smooth muscle. Adv Pharmacol. 2017;78:49–87. doi: 10.1016/bs.apha.2016.08.002 - DOI - PMC - PubMed

MeSH terms

Substances

LinkOut - more resources