. 2024 Oct;72(10):1893-1914.
doi: 10.1002/glia.24589. Epub 2024 Jul 18.

Myelin basic protein mRNA levels affect myelin sheath dimensions, architecture, plasticity, and density of resident glial cells

Affiliations

Myelin basic protein mRNA levels affect myelin sheath dimensions, architecture, plasticity, and density of resident glial cells

Hooman Bagheri et al. Glia. 2024 Oct.

Abstract

Myelin Basic Protein (MBP) is essential for both elaboration and maintenance of CNS myelin, and its reduced accumulation results in hypomyelination. How different Mbp mRNA levels affect myelin dimensions across the lifespan and how resident glial cells may respond to such changes are unknown. Here, to investigate these questions, we used enhancer-edited mouse lines that accumulate Mbp mRNA levels ranging from 8% to 160% of wild type. In young mice, reduced Mbp mRNA levels resulted in corresponding decreases in Mbp protein accumulation and myelin sheath thickness, confirming the previously demonstrated rate-limiting role of Mbp transcription in the control of initial myelin synthesis. However, despite maintaining lower line specific Mbp mRNA levels into old age, both MBP protein levels and myelin thickness improved or fully normalized at rates defined by the relative Mbp mRNA level. Sheath length, in contrast, was affected only when mRNA levels were very low, demonstrating that sheath thickness and length are not equally coupled to Mbp mRNA level. Striking abnormalities in sheath structure also emerged with reduced mRNA levels. Unexpectedly, an increase in the density of all glial cell types arose in response to reduced Mbp mRNA levels. This investigation extends understanding of the role MBP plays in myelin sheath elaboration, architecture, and plasticity across the mouse lifespan and illuminates a novel axis of glial cell crosstalk.

Keywords: Mbp transcription; astrocyte; hypermyelination; hypomyelination; microglia; myelin basic protein; myelin elaboration and plasticity; myelin sheath thickness and length; oligodendrocyte and oligodendrocyte progenitor cell.


Conflict of interest statement

The authors declare no conflicts of interest.

Figures
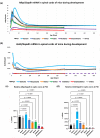
FIGURE 1
FIGURE 1
Myelin basic protein (Mbp) and Golli mRNA accumulation in enhancer‐edited mice. (a) Relative Mbp/Gapdh in spinal cord (n = 4–11). (b) Relative Golli/Gapdh in spinal cord (n = 4–11). Differences in line‐specific Golli/Mbp mRNA levels are largely maintained throughout life. (c) Relative Mbp/Gapdh in optic nerve at P30 (n = 5–6). (d) Relative Golli/Gapdh in optic nerve at P30 (n = 5–6). Relative Golli/Mbp mRNA levels are similar in both optic nerve and spinal cord. p‐values are calculated using one‐way ANOVA in (a–c) and Brown‐Forsythe and Welch ANOVA in (d) followed by Dunnett's T3 multiple comparisons tests. All data are presented as mean, and error bars indicate SEM.
FIGURE 2
FIGURE 2
Relative Myelin basic protein (MBP) levels in spinal cord of enhancer‐edited mice as determined by Western blot (WB) and imaging mass spectrometry (IMS). (a), Western blots of MBP and CNPase in spinal cord at P14 and P90. Relative mRNA values at P14 and P90 are indicated as a percentage of WT. (b), MBP/GAPDH in spinal cord at P14 and P90 measured by WB with all values normalized to WT of the same age (n = 3 for each genotype and age). (c), MBP distribution within the cervical spinal cord measured by IMS at P90. (d), Relative MBP in spinal cord WM at P30 (n = 3) and P90 (n = 5) measured by IMS with all values normalized to WT at P30. MBP protein accumulation increases with age. p‐values are calculated using one‐way ANOVA and Dunnett's multiple comparisons test. All data are presented as mean, and error bars indicate SEM.
FIGURE 3
FIGURE 3
Multiple effects of reduced Myelin basic protein (Mbp) mRNA. (a) Cholesterol distribution and signal intensity in P90 cervical spinal cord measured by imaging mass spectrometry (IMS). (b) Relative cholesterol levels in cervical spinal cord white mater at P90, IMS (n = 5). (c) Relative cholesterol in whole cervical spinal cord at P90, liquid chromatography‐mass spectrometry (LC–MS) (n = 6–8). Cholesterol levels correlate with MBP protein levels at P90. (d) Relative cross‐sectional areas of cervical spinal cord (C5–C6) at P30 (n = 3–4). (e) myelin water fraction (MWF) and mGRE signals at P30 measured by MRI. (f) Relative MWF from combined GM and WM cervical spinal cord (C2–C7) at P30 (n = 3). White matter volume correlates with Mbp mRNA levels at P30. Relative mRNA values at P30 and P90 are indicated as a percentage of WT. All data are presented as mean, and error bars indicate SEM. p‐values are calculated using one‐way ANOVA and Dunnett's multiple comparisons test in (b,c,f), and multiple unpaired t‐tests in (d).
FIGURE 4
FIGURE 4
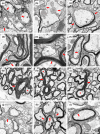
EM images from the cervical spinal cords and corpus callosum of enhancer‐edited mice. Gracile and cuneate tracts from: (a) P30 WT. (b) P90 WT. (c) P450 WT. (d) P30 M3KOKI. (e) P90 M3KOKI. (f) P450 M3KOKI. (g) P30 M3(225)KO. (h) P90 M3(225)KO. (i) P30 Shiverer. (j) P30 M5KO. (k) P90 M5KO. (l) P30 Shiverer. (m) P30 M3KO. (n) P90 M3KO. (o) P90 Shiverer. (p) P30 M3M5KO. (q) P90 M3M5KO. (r) P450 M3M5KO. (s) P30 M1EM3M5KO. (t) P90 M1EM3M5KO. (u) Corticospinal tract from P90 M1EM3M5KO. Myelin thickness correlates with Myelin Basic Protein (MBP) levels at both P30 and P90. Panels (b,q) show the segmentation of fibers meeting the selection criteria for inclusion in g‐ratio analysis (myelin in red and axons in blue). Scale bar (a–t) = 1 μm. Scale bar (u) = 0.5 μm. Cross sections from the body of the CC near midline at P30. (v) WT. (w) M5KO. (x) M3KO. (y) M3M5KO. (z) M1EM3M5KO. (aa) Shiverer. A step wise reduction in sheath thickness similar to that observed in spinal cord was apparent in the CC. Further, the myelin associated tubules prominent in spinal cord fibers from M1EM3M5KO and M3M5KO mice also were observed in the CC samples from mice of these same genotypes. Additionally, many small caliber axons remained unmyelinated in M1EM3M5KO mice at this age.
FIGURE 5
FIGURE 5
Spinal cord g‐ratio in sensory, motor and mixed tracts from enhancer‐edited mice at different ages. (a) Gracile and cuneate tracts at P30, P90, and P450. (b) Ventromedial (VM) tract at P30, P90, and P450. (c) Corticospinal tract at P30, P90, and P450. Each point represents mean g‐ratio per bin, and error bars indicate SEM (n = 1–2) (bin size = 2–495 fibers). Selected examples of age‐related changes in: (d) Gracile and cuneate tracts in WT and M3KOKI, (e) Corticospinal tract in WT and M5KO, (f) VM tract in WT and M3M5KO (n = 1–2). Myelin thickness in hypomyelinated lines improves or normalizes with age at a rate dependent on Myelin basic protein (Mbp) mRNA levels. At P450, M3KOKI line shows hypermyelination in all tracts.
FIGURE 6
FIGURE 6
Effect of reduced Myelin basic protein (Mbp) mRNA on length and number of myelin sheaths elaborated by oligodendrocytes. (a), Teased spinal cord fibers. Arrows indicate ends of myelin sheaths as identified by Caspr (green). Scale bar = 100 μm. Average sheath length: (b) axons <2 μm, c, axons 2–4 μm, d axons >4 μm, e axons of all diameters. There is a significant decrease in mean myelin sheath length for M3M5KO mice (n = 4). There was no difference in mean sheath lengths in M3KO (n = 4), M5KO (n = 5) or M3KOKI bp (n = 5) mice compared to WT (n = 5). (f) Schematic of the cortical region analyzed and confocal micrographs of single oligodendrocytes. Scale bar = 25 μm. (g), Average sheath length in cortex at P30, and (h), at P85. Mean myelin sheath lengths per mouse shows reduced lengths only in M3M5KO mice at both P30 and P85. (i) Myelin sheath number per oligodendrocyte at P30, and (j) at P85. The number of myelin sheaths per individual oligodendrocyte is not affected in M3M5KO mice. Relative mRNA values at P30 and P90 are indicated as a percentage of WT. p‐values are calculated from one‐way ANOVA and Dunnett's multiple comparisons test. All data are presented as mean per mouse, and error bars indicate SEM (n = 3–6).
FIGURE 7
FIGURE 7
Abnormal spinal cord fiber profiles. (a) Clusters of oligodendrocyte processes in gracile and cuneate (GC) tract of P30 Shiverer. (b) Partially ensheathed axon with membrane tubules in ventromedial tract of P90 Shiverer. (c) Partially ensheathed axon with membrane tubules in corticospinal tracts (CST) tract of P450 M3M5KO. (d) Microtubule containing myelinic channels in GC tract of P450 M3M5KO. (e) Radial components crossing myelin sheath between inner and outer tongue in GC tract of P30 M5KO. (f) Oligodendrocyte process invading the axon in GC tract of P90 M1EM3M5KO. (g) Myelin outfolding in GC tract of P450 WT. (h) Myelin outfolding in GC tract of P30 M5KO. (i) Myelin outfolding in CST tract of P450 M3M5KO. (j) Clusters of membrane tubules in GC tract of P90 M1EM3M5KO. (k) Membrane tubules in GC tract of P90 M1EM3M5KO. (l) Membrane tubules in GC tract of P90 M1EM3M5KO. Red arrows are pointing to the features. Axons with outfoldings are designated with red asterisks. Scale bar = (a,f,g,j,k,l): 1 μm, (c,h,i): 0.5 μm, (b,d): 0.2 μm, (e): 50 nm.
FIGURE 8
FIGURE 8
Density of glial cells in dorsal column at P80. (a) Immunohistochemical staining of oligodendrocytes (green) and OPCs (purple), microglia (green) and astrocytes (red) in dorsal cervical spinal cord. Scale bar = 50 μm. (b) OPC density. (c) oligodendrocyte density. (d) Astrocyte density. (e) Microglia density. Density of OPCs, oligodendrocytes and astrocytes correlates negatively with Myelin basic protein (Mbp) mRNA levels. Increased density and morphological changes of microglia occur only in M1EM3M5KO and shiverer mice. Relative mRNA values are indicated as a percentage of WT at P90. p‐values are calculated using one‐way ANOVA and Dunnett's multiple comparisons test. All data are presented as mean, and error bars indicate SEM (n = 3).

References

    1. Almeida, R. G. , Czopka, T. , ffrench‐Constant, C. , & Lyons, D. A. (2011). Individual axons regulate the myelinating potential of single oligodendrocytes in vivo. Development, 138, 4443–4450. 10.1242/dev.071001 - DOI - PMC - PubMed
    1. Bacmeister, C. M. , Barr, H. J. , McClain, C. R. , Thornton, M. A. , Nettles, D. , Welle, C. G. , & Hughes, E. G. (2020). Motor learning promotes remyelination via new and surviving oligodendrocytes. Nature Neuroscience, 23, 819–831. 10.1038/s41593-020-0637-3 - DOI - PMC - PubMed
    1. Bagheri, H. , Friedman, H. , Siminovitch, K. A. , & Peterson, A. C. (2020). Transcriptional regulators of the golli/myelin basic protein locus integrate additive and stealth activities. PLoS Genetics, 16, e1008752. 10.1371/journal.pgen.1008752 - DOI - PMC - PubMed
    1. Barbarese, E. , Koppel, D. E. , Deutscher, M. P. , Smith, C. L. , Ainger, K. , Morgan, F. , & Carson, J. H. (1995). Protein translation components are colocalized in granules in oligodendrocytes. Journal of Cell Science, 108(Pt 8), 2781–2790. 10.1242/jcs.108.8.2781 - DOI - PubMed
    1. Bechler, M. E. , Byrne, L. , & Ffrench‐Constant, C. (2015). CNS myelin sheath lengths are an intrinsic property of oligodendrocytes. Current Biology, 25, 2411–2416. 10.1016/j.cub.2015.07.056 - DOI - PMC - PubMed

LinkOut - more resources