. 2024 Sep;11(35):e2403592.
doi: 10.1002/advs.202403592. Epub 2024 Jul 18.

Inactivated cGAS-STING Signaling Facilitates Endocrine Resistance by Forming a Positive Feedback Loop with AKT Kinase in ER+HER2- Breast Cancer

Affiliations

Inactivated cGAS-STING Signaling Facilitates Endocrine Resistance by Forming a Positive Feedback Loop with AKT Kinase in ER+HER2- Breast Cancer

Kai-Ming Zhang et al. Adv Sci (Weinh). 2024 Sep.

Abstract

Endocrine-resistant ER+HER2- breast cancer (BC) is particularly aggressive and leads to poor clinical outcomes. Effective therapeutic strategies against endocrine-resistant BC remain elusive. Here, analysis of the RNA-sequencing data from ER+HER2- BC patients receiving neoadjuvant endocrine therapy and spatial transcriptomics analysis both show the downregulation of innate immune signaling sensing cytosolic DNA, which primarily occurs in endocrine-resistant BC cells, not immune cells. Indeed, compared with endocrine-sensitive BC cells, the activity of sensing cytosolic DNA through the cGAS-STING pathway is attenuated in endocrine-resistant BC cells. Screening of kinase inhibitor library show that this effect is mainly mediated by hyperactivation of AKT1 kinase, which binds to kinase domain of TBK1, preventing the formation of a trimeric complex TBK1/STING/IRF3. Notably, inactivation of cGAS-STING signaling forms a positive feedback loop with hyperactivated AKT1 to promote endocrine resistance, which is physiologically important and clinically relevant in patients with ER+HER2- BC. Blocking the positive feedback loop using the combination of an AKT1 inhibitor with a STING agonist results in the engagement of innate and adaptive immune signaling and impairs the growth of endocrine-resistant tumors in humanized mice models, providing a potential strategy for treating patients with endocrine-resistant BC.

Keywords: AKT kinase; cGAS‐STING pathway; endocrine‐resistant breast cancer; positive feedback loop.


Conflict of interest statement

The authors declare no conflict of interest.

Figures
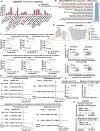
Figure 1
Figure 1
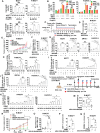
Innate immune signaling sensing cytosolic DNA were downregulated in endocrine‐resistant breast cancer cell. A) Tumor‐infiltrating immune cells based on CIBERSORT analysis of tumor‐infiltrating immune cells between responder and nonresponder for neoadjuvant endocrine therapy in GSE20181 data set. B) GSEA analysis of different REACTOME pathways between responder and nonresponder in GSE20181 data set. C) Kaplan–Meier analyses of overall survival (OS), disease free survival (DFS), and progression free survival (PFS) based on enrichment score of the innate immune signaling sensing cytoplasmic DNA for patients with Luminal‐A breast cancer. The data were retrieved from TCGA database. D) Univariate Cox regression analysis and multivariate Cox regression analysis regarding OS for patients with Luminal‐A breast cancer using the TCGA database. E) Visualization of the spatial distribution of cell types by spatial transcriptomics analysis. F) Pearson correlation analysis for the correlation between the abundance of tumor cell and the enrichment score of innate immune signal sensing cytosolic DNA. G) ssGSEA analysis of innate immune signal sensing cytosolic DNA in the tumor cells of endocrine‐resistant and endocrine‐sensitive breast cancer. H) Enrichment plot of cytosolic sensors of pathogen associated DNA pathway and regulation of innate immune responses to cytosolic DNA pathway based on GSEA analysis between endocrine‐sensitive and endocrine‐resistant cell lines in GSE75971 data set.
Figure 2
Figure 2
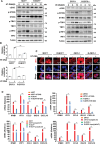
cGAS‐STING pathway is inactive in endocrine‐resistant breast cancer cells. A) MCF7/ZR75.1 cells and R‐MCF7/R‐ZR75.1 cells were treated with 2 µg mL−1 HT‐DNA for 6 or 12 h and harvested for western blot analysis of proteins in cGAS‐STING pathway. B) A luciferase‐reporter assay with an IRF3‐responsive ISRE promoter stimulated by cGAS‐STING pathway was used in MCF7/ZR75.1 cells and R‐MCF7/R‐ZR75.1 cells, after treated with 2 µg mL−1 HT‐DNA for 16 h, luciferase activity was detected (n = 3 biological independent samples). C) MCF7/ZR75.1 cells and R‐MCF7/R‐ZR75.1 cells were treated with 2 µg mL−1 HT‐DNA for 12 h and harvested for immunofluorescence detection of IRF3 (red). D) MCF7/ZR75.1 cells and R‐MCF7/R‐ZR75.1 cells were treated with 2 µg mL−1 HT‐DNA for 12 h or 200 ng mL−1 poly(dA:dT) for 24 h, then harvested for RT‐qPCR analysis of IFNB1 mRNA and ISGs mRNA (n = 3 biological independent samples). p‐values were calculated by unpaired two‐tailed Student's t‐test, **p <0.01. All data are representative of three independent experiments.
Figure 3
Figure 3
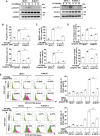
Inactivation of cGAS‐STING pathway in endocrine‐resistant breast cancer mediates immune escape. A) MCF7/ZR75.1 cells and R‐MCF7/R‐ZR75.1 cells were treated with 2 µg mL−1 HT‐DNA for 6 or 12 h and harvested for western blot analysis of phosphorylated STAT1. B) MCF7/ZR75.1 cells and R‐MCF7/R‐ZR75.1 cells were treated with 4 µg mL−1 HT‐DNA for 24 h and harvested for Annexin V‐FITC/PI staining assay (n = 3 biological independent samples). C) MCF7/ZR75.1 cells and R‐MCF7/R‐ZR75.1 cells were pretreated with 2 µg mL−1 HT‐DNA for 6 h, then cocultured with immature DC for 24 h and harvested for flow cytometry analysis of DC mature marker, MHC II (n = 3 biological independent samples). D) MCF7/ZR75.1 cells and R‐MCF7/R‐ZR75.1 cells were pretreated with 2 µg mL−1 HT‐DNA for 6 h, then dyed by CFSE and cocultured with immature DC for 16 h and harvested for flow cytometry analysis of DC that engulfing the cancer cells (n = 3 biological independent samples). E) MCF7/ZR75.1 cells and R‐MCF7/R‐ZR75.1 cells were pretreated with 2 µg mL−1 HT‐DNA for 6 h, then cocultured with PBMC (present with anti‐CD3, anti‐CD28, and IL‐2) for 72 h and harvested for flow cytometry analysis of cell death rate in cancer cells (n = 3 biological independent samples). p‐values were calculated by unpaired two‐tailed Student's t‐test, **p < 0.01. All data are representative of three independent experiments.
Figure 4
Figure 4
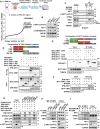
AKT1 interacts with TBK1 to inhibit the formation of STING/TBK1/IRF3 trimer in endocrine‐resistant breast cancer. A) Screening of the kinase inhibitor library revealed PI3K‐AKT signal to be a strong suppressor of STING signaling. B) MCF7/ZR75.1 cells and R‐MCF7/R‐ZR75.1 cells were harvested for western blot analysis of proteins in PI3K‐AKT pathway. C) R‐MCF7 cells were pretreated with 2 µm MK2206 for 2 h, then incubated with 2 µg mL−1 HT‐DNA for 6 h and harvested for coimmunoprecipitation assays. D) Domain mapping assays, performed by coimmunoprecipitation of SFB‐tagged full‐length (FL) AKT1 with serial truncations of TBK1 (upper), revealed that kinase domain of TBK1 was responsible and enough to bind AKT1 (bottom). E) Domain mapping assays, performed by coimmunoprecipitation of Myc‐tagged TBK1 kinase domain (1‐299) with serial truncations of AKT1 (upper), revealed that kinase domain of AKT1 was responsible and enough to bind TBK1 kinase domain (bottom). F) SFB‐tagged full‐length (FL) AKT1 and Myc‐tagged kinase domain of TBK1 were transfected into HEK‐293T cell for 48 h, then cells were treated with 2 µm MK2206 for 6 h and harvested for co‐immunoprecipitation assays, SFB‐AKT1 was immunoprecipitated with FLAG antibody. Cell lysates and IP were analyzed by western blot. G) HEK293T cells were transfected with AKT1‐MYR‐HA or AKT1‐DN‐HA and cotransfected with Myc‐TBK1, GFP‐IRF3, and FLAG‐STING for 48 h. Cells were lysed and Myc‐TBK1 was immunoprecipitated with Myc antibody. Cell lysates and IP were analyzed by western blot. H) siAKT1 was used to interfere the expression of AKT1 in R‐MCF7 cells for 48 h, then cells were treated with 2 µg mL−1 HT‐DNA for 12 h and harvested for coimmunoprecipitation assays. I) R‐MCF7 cells were pretreated with MK2206 for 2 h, then cells were treated with 2 µg mL−1 HT‐DNA for 12 h and harvested for coimmunoprecipitation assays. All data are representative of three independent experiments.
Figure 5
Figure 5
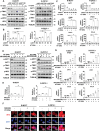
Targeting AKT1 reverses the activity of cGAS‐STING pathway in endocrine‐resistant breast cancer cells. A) Knockdown AKT1 in R‐MCF7/R‐ZR75.1 cells for 48 h, then cells were treated with 2 µg mL−1 HT‐DNA for 12 h and harvested for western blot analysis of proteins in cGAS‐STING pathway. B) A luciferase‐reporter assay with an IRF3‐responsive ISRE promoter stimulated by cGAS‐STING pathway was used in R‐MCF7/R‐ZR75.1 cells, after treated with 2 µg mL−1 HT‐DNA for 16 h, luciferase activity was detected (n = 3 biological independent samples). C) Knockdown AKT1 in R‐MCF7/R‐ZR75.1 cells for 48 h, then cells were treated with 2 µg mL−1 HT‐DNA for 12 h and harvested for RT‐qPCR analysis of AKT1 mRNA, IFNB1 mRNA, and CCL5 mRNA (n = 3 biological independent samples). D) R‐MCF7/R‐ZR75.1 cells were pretreated with MK2206 for 2 h, then cells were treated with 2 µg mL−1 HT‐DNA for 12 h and harvested for western blot analysis of proteins in cGAS‐STING pathway. E) A luciferase‐reporter assay with an IRF3‐responsive ISRE promoter stimulated by cGAS‐STING pathway was used in R‐MCF7/R‐ZR75.1 cells, after treated with 2 µg mL−1 HT‐DNA for 16 h, luciferase activity was detected (n = 3 biological independent samples). F) R‐MCF7/R‐ZR75.1 cells were pretreated with MK2206 for 2 h, then cells were treated with 2 µg mL−1 HT‐DNA for 12 h and harvested for immunofluorescence detection of IRF3 (red). G) R‐MCF7/R‐ZR75.1 cells were pretreated with MK2206 for 2 h, then cells were treated with 2 µg mL−1 HT‐DNA for 12 h and harvested for RT‐qPCR analysis of IFNB1 mRNA, IFIT1 mRNA, and CCL5 mRNA (n = 3 biological independent samples). p‐values were calculated by unpaired two‐tailed Student's t‐test, *p < 0.05; **p < 0.01; NS, not significant. All data are representative of three independent experiments.
Figure 6
Figure 6
The positive feedback loop of inactivated STING signaling and hyperactivated AKT1 in ER+HER2– breast cancer. A) Cell proliferation assay for the growth rate of MCF7/ZR75.1 cells with or without STING depletion in standard medium or estrogen‐deprived medium. B) Correlation analysis between the enrichment score of cytosolic sensors of pathogen associated DNA pathway and PI3K‐AKT pathway based on ssGSEA of GES20181. C) MCF7/ZR75.1 cells with or without STING depletion were harvested for western blot analysis of proteins in PI3K‐AKT pathway. D) Cell proliferation assay for the growth rate of MCF7/ZR75.1 cells with or without STING depletion under MK2206 treatment in estrogen‐deprived medium. E) Kaplan–Meier plots of the DFS of patients, stratified by protein expression of nuclear IRF3. The p value was assessed using the log‐rank test (two‐sided). F) Kaplan–Meier plots of the DFS of patients, stratified by protein expression of p‐AKT1. The p value was assessed using the log‐rank test (two‐sided). G) The representative images for p‐AKT1 staining in two patients with nuclear IRF3 expression (left). Case 1 showed low expression of p‐AKT1 with high expression of nuclear IRF3. Case 2 showed high expression of p‐AKT1 with low expression of nuclear IRF3. The correlation of p‐AKT1 and nuclear IRF3 expression status in ER+HER2– breast cancer tissues (right). The relationship was assessed using Pearson's chi‐square test. H) Kaplan–Meier plots of the DFS of patients, stratified by protein expression of both p‐AKT1 and nuclear IRF3. The p value was assessed using the log‐rank test and further corrected with the Benjamini–Hochberg method (two‐sided). I) Univariate Cox regression analysis and multivariate Cox regression analysis regarding DFS for ER+HER2– breast cancer patients. p‐values were calculated by unpaired two‐tailed Student's t‐test, *p < 0.05; **p < 0.01; NS, not significant. All data are representative of three independent experiments.
Figure 7
Figure 7
The combination of ADU‐S100 and MK2206 enhances immune surveillance to inhibit tumor growth of endocrine‐resistant breast cancer. A) Knockdown AKT1 in MCF7/ZR75.1 cells and R‐MCF7/R‐ZR75.1 cells for 48 h, then cells were treated with 4 µg mL−1 HT‐DNA for 24 h and harvested for Annexin V‐FITC/PI staining assay (n = 3 biological independent samples). B) Knockdown AKT1 in R‐MCF7/R‐ZR75.1 cells for 48 h, then cells were pretreated with 0.5 µm Ruxolitinib or 1 µm GSK8612 for 2 h. After that cells were treated with 4 µg mL−1 HT‐DNA for 24 h and harvested for Annexin V‐FITC/PI staining assay (n = 3 biological independent samples). C) Schematic overview of treatment dosage and schedule in nude mice. D) Graphical quantification of difference in weight of tumor at week 12 in each group. E) All nude mice were sacrificed at week 12 and graphical quantification represents the tumor growth rate in nude mice. F) Immunofluorescence detection of p‐TBK1 in tumor cells of tissues from different groups. G) MCF7/ZR75.1 cells and R‐MCF7/R‐ZR75.1 cells were pretreated with 2 µg mL−1 ADU‐S100 and 0.5 µm MK2206 for 24 h, then cancer cells were dyed by CFSE and cocultured with immature DC for 16 h and harvested for flow cytometry analysis of DC that engulfing the cancer cells (n = 3 biological independent samples). H) Knockdown AKT1 in R‐MCF7/R‐ZR75.1 cells for 48 h, then cells were pre‐treated with 2 µg mL−1 HT‐DNA for 6 h. After that cancer cells were dyed by CFSE and cocultured with immature DC for 16 h and harvested for flow cytometry analysis of DC that engulfing the cancer cells (n = 3 biological independent samples). I,J) MCF7/ZR75.1 cells and R‐MCF7/R‐ZR75.1 cells were pretreated with 2 µg mL−1 ADU‐S100 and 0.5 µm MK2206 for 24 h. After that, cancer cells were cocultured with PBMC (present with anti‐CD3, anti‐CD28, and IL‐2) for 72 h and harvested for flow cytometry analysis of cell death rate in cancer cells (n = 3 biological independent samples). K) siAKT1 was used to interfere the expression of AKT1 in R‐MCF7/R‐ZR75.1 cells for 8 h, then cells were pretreated with 2 µg mL−1 HT‐DNA for 6 h. After that, cancer cells were cocultured with PBMC (present with anti‐CD3, anti‐CD28, and IL‐2) for 72 h and harvested for flow cytometry analysis of cell death rate in cancer cells (n = 3 biological independent samples). L) Schematic overview of treatment dosage and schedule in NSG mice and humanized mice bearing R‐MCF7. M) Graphical quantification of difference in weight of tumor at day 17 in each group. N) Graphical quantification represents the tumor growth rate in NSG mice and humanized mice. O) Immunofluorescence detection of p‐TBK1 in tumor cells of tissues from different groups. P,Q) CD8+ T cell and GZMB+ cell infiltration of human endocrine‐resistant cancer R‐MCF7 in humanized mice treated with vehicle or MK2206 and ADU‐S100. p‐values were calculated by unpaired two‐tailed Student's t‐test, *p < 0.05; **p < 0.01; NS, not significant.

References

    1. Giaquinto A. N., Sung H., Miller K. D., Kramer J. L., Newman L. A., Minihan A., Jemal A., Siegel R. L., Ca‐Cancer J. Clin. 2022, 72, 524. - PubMed
    1. Pan H., Gray R., Braybrooke J., Davies C., Taylor C., McGale P., Peto R., Pritchard K. I., Bergh J., Dowsett M., Hayes D. F., N. Engl. J. Med. 2017, 377, 1836. - PubMed
    1. Hanker A. B., Sudhan D. R., Arteaga C. L., Cancer Cell 2020, 37, 496. - PMC - PubMed
    1. Zhu W., Xu B., Front. Med. 2021, 15, 208. - PubMed
    1. Rugo H. S., Delord J.‐P., Im S.‐A., Ott P. A., Piha‐Paul S. A., Bedard P. L., Sachdev J., Tourneau C. L., van Brummelen E. M. J., Varga A., Salgado R., Loi S., Saraf S., Pietrangelo D., Karantza V., Tan A. R., Clin. Cancer Res. 2018, 24, 2804. - PubMed

MeSH terms

LinkOut - more resources