. 2024 Aug 7;68(8):e0033624.
doi: 10.1128/aac.00336-24. Epub 2024 Jul 18.

Effect of L-arginine on cystic fibrosis Pseudomonas aeruginosa biofilms

Affiliations

Effect of L-arginine on cystic fibrosis Pseudomonas aeruginosa biofilms

Shafinaz Eisha et al. Antimicrob Agents Chemother. .

Abstract

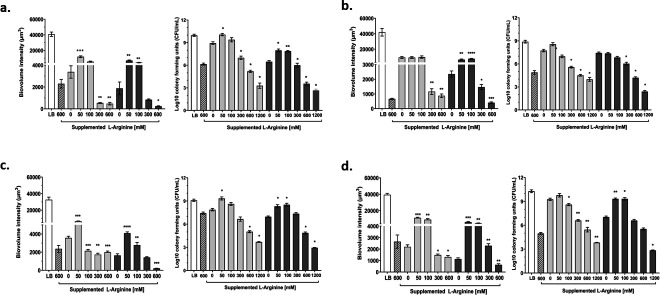
Cystic fibrosis (CF) airways are L-arginine deficient which may affect susceptibility to infection with certain pathogens. The potential impact of L-arginine supplementation on Pseudomonas aeruginosa, a common CF airway pathogen, is unclear. This study investigated the effects of L-arginine on P. aeruginosa biofilm cultures, using the laboratory strain PAO1 and multi-drug resistant CF clinical isolates. P. aeruginosa biofilms were grown in a chambered cover-glass slide model for 24 h, then exposed to either L-arginine alone or combined with tobramycin for an additional 24 h. Biofilms were visualized using confocal microscopy, and viable cells were measured via plating for colony-forming units. Increasing concentrations of L-arginine in bacterial culture medium reduced the biovolume of P. aeruginosa in a dose-dependent manner. Notably, L-arginine concentrations within the physiological range (50 mM and 100 mM) in combination with tobramycin promoted biofilm growth, while higher concentrations (600 mM and 1200 mM) inhibited growth. These findings demonstrate the potential of L-arginine as an adjuvant therapy to inhaled tobramycin in treating P. aeruginosa infections in people with CF.

Keywords: L-arginine; Pseudomonas aeruginosa; biofilm; cystic fibrosis; tobramycin.


Conflict of interest statement

The authors declare no conflict of interest.

Figures

Fig 1
Fig 1
L-arginine inhibits the growth of PAO1 planktonic cells. Colony forming units /mL (CFU/mL) of PAO1 planktonic cells showing dose-dependent response to L-arginine. Each data point represents the average from six independent experiments with standard error bars of the mean (SEM). Comparisons were performed using non-parametric one-way ANOVA (Kruskal–Wallis) with Dunn’s post-test for multiple comparisons.
Fig 2
Fig 2
L-arginine disrupts and reduces PAO1 biofilms. (a) Biovolume intensity (µm3) and (b) CFU/mL of PAO1 biofilm showing dose-dependent response to L-arginine. Each data point represents the average from six independent experiments with standard error bars of the mean (SEM). Comparisons were performed using non-parametric one-way ANOVA (Kruskal–Wallis) with Dunn’s post-test for multiple comparisons. (c) Representative 3D confocal images of PAO1 biofilms showing dose-dependent response to L-arginine. P. aeruginosa biofilm is shown using Syto-9 live-cell fluorescent stain with 25× objective lens.
Fig 3
Fig 3
L-arginine disrupts and reduces biofilm of P. aeruginosa clinical isolates. (a) Biovolume intensity (µm3) and (b) CFU/mL of four clinical isolates biofilm showing dose-dependent response to L-arginine. Each data point represents the average from six independent experiments with standard error bars of the mean (SEM). Comparisons were performed using non-parametric one-way ANOVA (Kruskal–Wallis) with Dunn’s post-test for multiple comparisons. Black = 005E3-2, Magenta = 007E3-2, Blue = 014B2-1, and Green = 035B7-1. (c) Representative 3D confocal images of four clinical isolates biofilms showing dose-dependent response to L-arginine. P. aeruginosa biofilm is shown using Syto-9 live-cell fluorescent stain with 25× objective lens.
Fig 4
Fig 4
Combined effects of tobramycin and L-arginine on PAO1 biofilm reduction. (a) Biovolume intensity (µm3) and (b) CFU/mL of PAO1 biofilm showing combined effects of L-arginine and tobramycin. Each data point represents the average from six independent experiments with standard error bars of the mean (SEM). Comparisons were performed using paired t-test, where the effects of using both L-arginine and tobramycin were compared against using tobramycin alone. White bar represents PAO1 grown only in LB, without L-arginine or tobramycin. White hatched bar represents PAO1 grown in 600 mM of L-arginine, but no tobramycin. Light grey bars represent 100 µg/mL and dark grey bars represent 1,000 µg/mL of tobramycin. * P < 0.05, **P < 0.01, ***P < 0.001.
Fig 5
Fig 5
Combined effects of tobramycin and L-arginine on PAO1 biofilm reduction. Representative 3D confocal images of PAO1 biofilm showing combined effects of L-Arginine and tobramycin. P. aeruginosa biofilms are shown using Syto-9 live-cell fluorescent stain with 25× objective lens.
Fig 6
Fig 6
Combined effects of tobramycin and L-arginine on P. aeruginosa clinical isolates. Biovolume intensity (µm3) and CFU/mL of four PA clinical isolates biofilm showing combined effects of L-arginine and tobramycin. Each data point represents the average from six independent experiments with standard error bars of the mean (SEM). Statistics were performed using paired t-test, where the effects of using both L-arginine and tobramycin were compared against using tobramycin alone. White bar represents PAO1 grown only in LB, without L-arginine or tobramycin. White hatched bar represents PAO1 grown in 600 mM of L-arginine, but no tobramycin. Light grey bars represent 100 µg/ml and dark grey bars represent 1,000 µg/mL of tobramycin. a = 005E3-2, b = 007E3-2, c = 014B2-1, d = 035B7-1. *P < 0.05, **P < 0.01, ***P < 0.001, ****P < 0.0001.
Fig 7
Fig 7
Combined effects of tobramycin and L-arginine on P. aeruginosa clinical isolates. Representative 3D confocal images of PA clinical isolate (005E3-2) biofilm showing combined effects of L-Arginine and tobramycin. P. aeruginosa biofilms are shown using Syto-9 live-cell fluorescent stain with 25× objective lens.

References

    1. Scott JA, Maarsingh H, Holguin F, Grasemann H. 2021. Arginine therapy for lung diseases. Front Pharmacol 12:627503. doi:10.3389/fphar.2021.627503 - DOI - PMC - PubMed
    1. Grasemann H, Schwiertz R, Matthiesen S, Racké K, Ratjen F. 2005. Increased arginase activity in cystic fibrosis airways. Am J Respir Crit Care Med 172:1523–1528. doi:10.1164/rccm.200502-253OC - DOI - PubMed
    1. Grasemann H, Schwiertz R, Grasemann C, Vester U, Racké K, Ratjen F. 2006. Decreased systemic bioavailability of L-arginine in patients with cystic fibrosis. Respir Res 7:87. doi:10.1186/1465-9921-7-87 - DOI - PMC - PubMed
    1. Durante W, Johnson FK, Johnson RA. 2007. Arginase: a critical regulator of nitric oxide synthesis and vascular function. Clin Exp Pharmacol Physiol 34:906–911. doi:10.1111/j.1440-1681.2007.04638.x - DOI - PMC - PubMed
    1. Jaecklin T, Duerr J, Huang H, Rafii M, Bear CE, Ratjen F, Pencharz P, Kavanagh BP, Mall MA, Grasemann H. 2014. Lung arginase expression and activity is increased in cystic fibrosis mouse models. J Appl Physiol (1985) 117:284–288. doi:10.1152/japplphysiol.00167.2014 - DOI - PubMed

Publication types

MeSH terms