

doi: 10.1037/xlm0001319.
Epub 2024 Jul 18.
The Penn Electrophysiology of Encoding and Retrieval Study
Affiliations
- PMID: 39023975
- PMCID: PMC12161444
- DOI: 10.1037/xlm0001319
Item in Clipboard
The Penn Electrophysiology of Encoding and Retrieval Study
J Exp Psychol Learn Mem Cogn.
2024 Sep.
Abstract
The Penn Electrophysiology of Encoding and Retrieval Study (PEERS) aimed to characterize the behavioral and electrophysiological (EEG) correlates of memory encoding and retrieval in highly practiced individuals. Across five PEERS experiments, 300+ subjects contributed more than 7,000 memory testing sessions with recorded EEG data. Here we tell the story of PEERS: its genesis, evolution, major findings, and the lessons it taught us about taking a big scientific approach in studying memory and the human brain. (PsycInfo Database Record (c) 2024 APA, all rights reserved).
Figures

Note. The same group of subjects took part in Experiments 1 to 3, across 20 experimental sessions. Experiments 4 and 5 involved separate subject groups, recruited in later years of the project. Each experiment involved some form of a free recall task, and Experiments 1 to 3 also included recognition and final-free recall tasks. Experiment 5 only included final-free recall. For Experiments 1 to 3, subjects either studied items without a specific encoding task, or judged items’ size or animacy. The color of the word bubbles in the first row of the schematic indicates the encoding task. Experiment 2 also included an encoding-task manipulation not shown in the schematic diagram. The Method section provides many details omitted here. PEERS = Penn Electrophysiology of Encoding and Retrieval Study; Exp. = experiment; Conf. = confidence; ISI = interstimulus interval. See the online article for the color version of this figure.

Note. (A) Illustration of IFR, DFR, and CDFR tasks. (B) Serial position analysis showing recency in IFR, attenuated recency in DFR, and long-term recency in CDFR. (C) Recall initiation, as measured by the probability of first recall, shows that initiating with recent items does not differ between DFR and CDFR. (D) Contiguity is generally preserved in all three conditions. (E) Subjects are more likely to recall items that are semantically related to the just-recalled item. PEERS = Penn Electrophysiology of Encoding and Retrieval Study; IFR = immediate free recall; DFR = delayed free recall; CDFR = continual-distractor free recall; FR = free recall.

Note. (A) The contiguity effect is smaller when subjects perform an encoding task (making a size or animacy judgment) during study than when freely encoding items. (B) Task experience amplifies the contiguity effect: a large contiguity effect appears on the first session and grows larger by the 23rd session. (C) The contiguity effect also increases with intellectual ability, as measured by WAIS IQ. (D) Contiguity is preserved across the lifespan, but is larger for younger adults than for older adults. WAIS IQ = Wechsler Adult Intelligence Scale Intelligence Quotient.

Note. (A) The correlation between temporal factor scores and overall recall probability. Temporal factor scores give the average percentile ranking of the temporal lag of each actual transition with respect to the lags of potential transitions. (B) Those subjects who exhibit greater temporal clustering during verbal free recall (high temporal factor score) also exhibit higher scores on the Wechsler Adult Intelligence Scale IV. IQ = intelligence quotient.

Note. Panels (A) to (C) illustrate serial position, probability of first recall and contiguity effects; Panel (D) illustrates recognition memory hits and false alarms; Panel (E) illustrates semantic organization; Panels (F) and (G) illustrate intrusion errors, and Panel (H) illustrates the correlation between intrusions and false alarms. Black lines/bars indicate data from older adults; gray lines indicate younger-adult data. Solid lines with filled symbols or filled bars show subject data and broken lines with open symbols or unfilled bars show context maintenance and retrieval model simulations. Cond. = Conditional; Resp. = response; Prob. = probability. Adapted from “A Four-Component Model of Age-Related Memory Change,” by M. K. Healey and M. J. Kahana, 2016, Psychological Review, 123(1), pp. 23–69 (https://doi.org/10.1037/rev0000015 ). Copyright 2019 by the American Psychological Association.

Note. (A) Subjects recalled higher proportions of both low-frequency and high-frequency words as compared with intermediate-frequency words, regardless of whether the item was presented without an encoding task (filled squares) or with an encoding task (filled circles). (B) Subjects were more likely to incorrectly accept lures with increasing word frequency (open symbols) and less likely to correctly recognize targets with increasing word frequency (filled symbols), regardless of whether the items were presented with an associated encoding task (circles) or no task (squares). Data from Peers Experiment 1 (984 words) were partitioned into deciles on the basis of their word frequency counts in the CELEX2 database. Error bars represent 95% confidence intervals.

Note. Within each session, recall decreased across successive lists, but increased following the two five-min breaks, consistent with a proactive interference account.

Note. (A) When a math distractor task follows a study list, there is a greater difference in recall probability between good and bad math performance for later serial positions. (B) When a math distractor task precedes a study list, this difference is greater for earlier serial positions.

Note. Distributions of correlations between multivariate model predictions and free-recall performance at the item-level (A) and at the list-level (B). Each panel shows the full SME (labeled “item” and “list,” respectively) as well as a corrected SME which accounts for a range of external factors that predict recall performance (“item | all” and “list | all,” respectively). SME = subsequent memory effects. Adapted from “Neural Measures of Subsequent Memory Reflect Endogenous Variability in Cognitive Function,” by C. T. Weidemann and M. J. Kahana, 2021, Journal of Experimental Psychology: Learning, Memory, and Cognition, 47(4), pp. 641–651 (https://doi.org/10.1037/xlm0000966 ). Copyright 2019 by the American Psychological Association. See the online article for the color version of this figure.
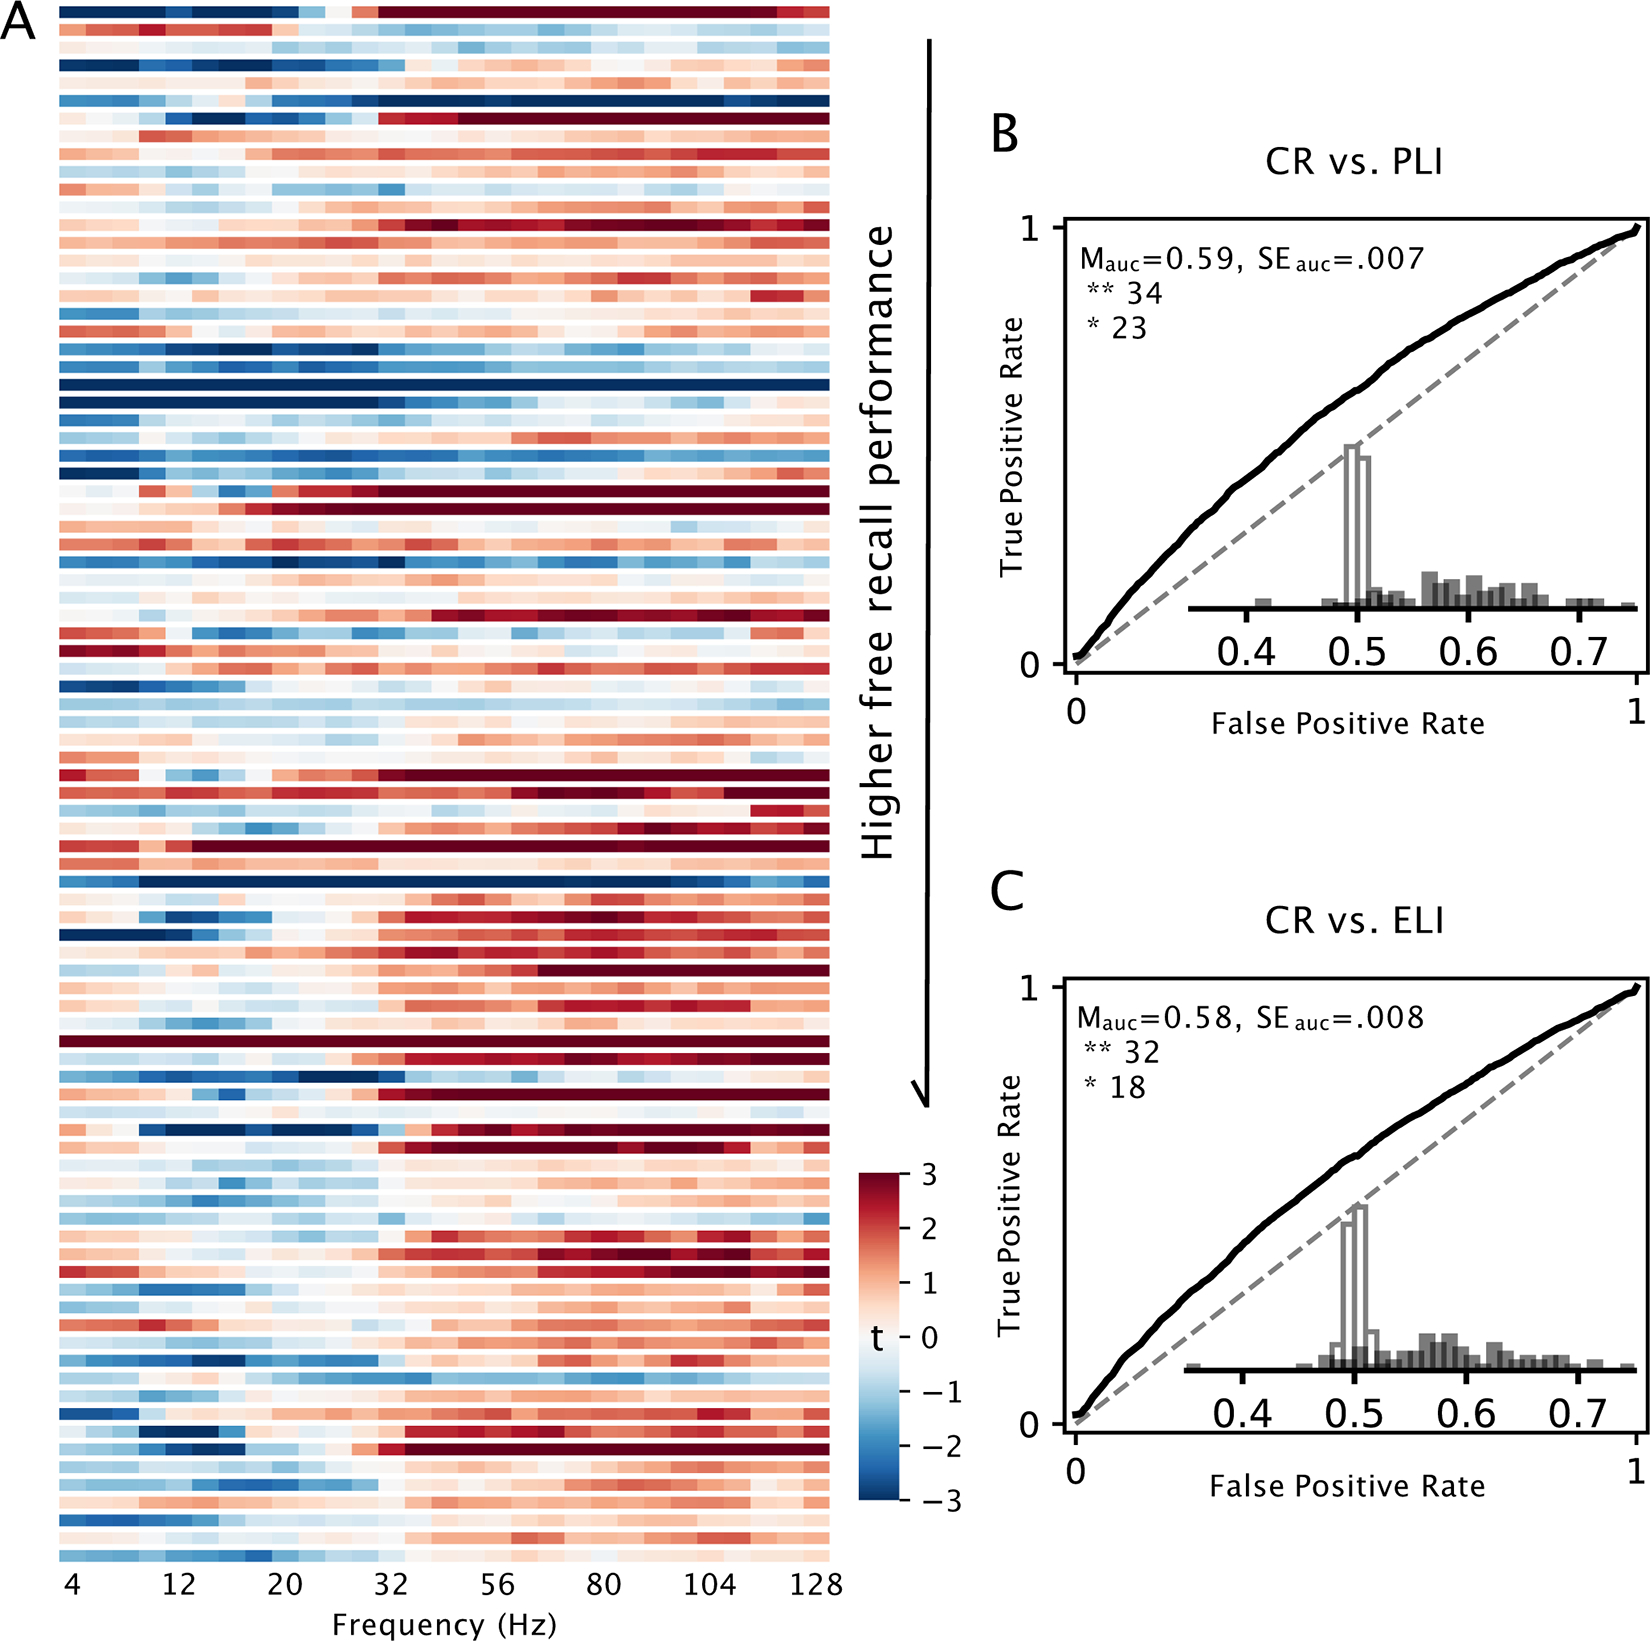
Note. (A) Subject-specific independent t statistics for comparing the 500-ms period immediately preceding correct recalls with the same period preceding intrusion errors (PLI and ELI) aggregated across all scalp electrodes. Each row shows the results from one subject, with rows sorted in order of ascending recall performance. Power increases and decreases are shown in red and blue, respectively. (B) ROC curves created by varying the threshold value of ΔEEG used to classify a retrieval as a CR or PLI. (C) ROC curve for classifying retrievals as a CR or ELI. PLI = prior-list intrusion; ELI = extra-list intrusion; ROC = receiver operating characteristic; EEG = electrophysiological; CR = correct recall. See the online article for the color version of this figure.

Note. Spectral power contrast for delayed recall versus immediate recall in PEERS Experiment 5. PEERS = Penn Electrophysiology of Encoding and Retrieval Study; L = left; R = right; A = anterior; P = posterior; I = inferior; S = superior; ROIs = regions of interest. See the online article for the color version of this figure.
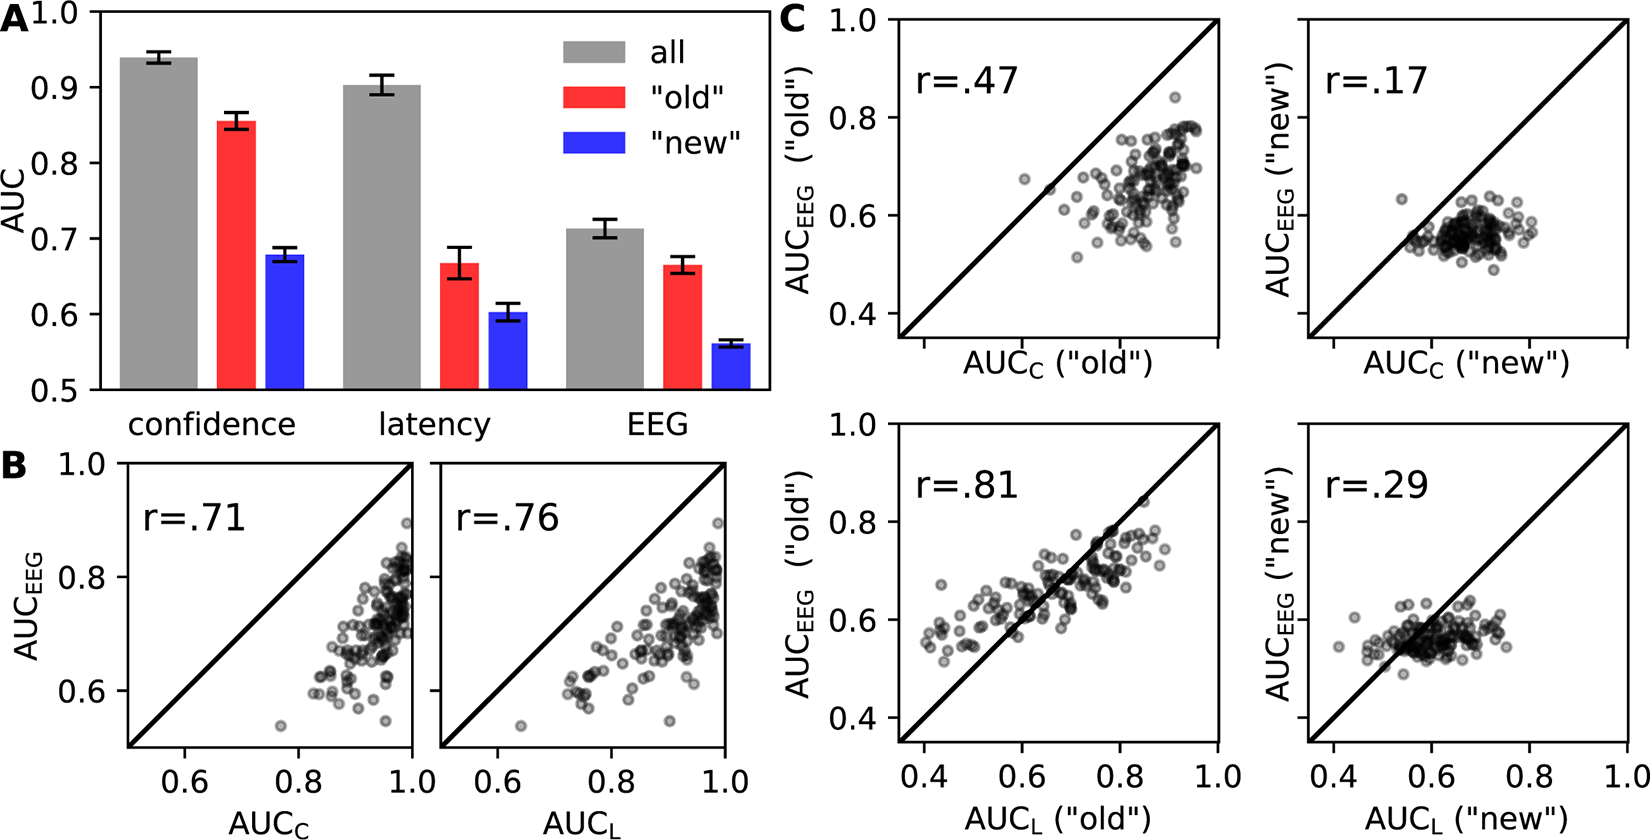
Note. (A) The area under the ROC curve (AUC) for functions constructed from confidence ratings, response latencies, and EEG. These AUCs indicate the extent to which the corresponding measure reflects a memory signal. As detailed by Weidemann and Kahana (2019), we can calculate AUCs across all responses or calculate AUCs separately within “old” and “new” responses. We see a qualitatively similar pattern across modalities with a stronger memory signal for “old” than for “new” responses. (B) Scatterplots relating AUCs from confidence (C) and latency (L) ROC functions to those from EEG activity. We see strong relationships between these AUCS. As detailed by Weidemann and Kahana (2019), this strong correspondence is difficult to interpret because every ROC function based on all responses is constrained to pass through the point corresponding to the overall hit and false alarm rate and thus the corresponding areas are not independent. (C) As in (B), but for ROC functions only based on “old” or “new” responses, as indicated. These ROC functions are not constrained to pass through the same point, but the corresponding ROCs are nevertheless highly correlated. EEG = electrophysiological; ROC = receiver operating characteristic; AUC = area under the curve. Figure adapted from “Dynamics of Brain Activity Reveal a Unitary Recognition Signal,” by C. T. Weidemann and M. J. Kahana, 2019, Journal of Experimental Psychology: Learning, Memory, and Cognition, 45(3), pp. 440–451 (https://doi.org/10.1037/xlm0000593 ). Copyright 2019 by the American Psychological Association. See the online article for the color version of this figure.

Note. (A) Consistent with RCT, the similarity between a recalled item’s neural context and its temporal neighbors from study decreases with absolute lag. Replotted from Lohnas et al. (2023). (B) The significance of the critical reinstatement effect decreases with subsets of subjects and/or trials. RCT = retrieved-context theory. Adapted from “Neural Temporal Context Reinstatement of Event Structure During Memory Recall” by L. J. Lohnas, M. K. Healey, and L. Davachi, 2023, Journal of Experimental Psychology: General, 152(7), pp. 1840–1872 (https://doi.org/10.1101/2021.07.30.454370 ). Copyright 2019 by the American Psychological Association.

Note. We surveyed articles published in the Journal of Experimental Psychology: Learning, Memory, and Cognition that included sufficient information to estimate the number of experimental hours contributed by research subjects. For each year we report the median and interquartile range, based on the sum of hours across all experiments in each publication. The number of evaluated articles appears below each year.
Similar articles
-
Neural correlates of memory in a naturalistic spatiotemporal context.J Exp Psychol Learn Mem Cogn. 2024 Sep;50(9):1404-1420. doi: 10.1037/xlm0001341. J Exp Psychol Learn Mem Cogn. 2024. PMID: 39418452
-
Decoding the tradeoff between encoding and retrieval to predict memory for overlapping events.Neuroimage. 2019 Nov 1;201:116001. doi: 10.1016/j.neuroimage.2019.07.014. Epub 2019 Jul 9. Neuroimage. 2019. PMID: 31299369 Free PMC article.
-
Retrieval practice enhances near but not far transfer of spatial memory.J Exp Psychol Learn Mem Cogn. 2020 Jan;46(1):24-45. doi: 10.1037/xlm0000710. Epub 2019 Apr 18. J Exp Psychol Learn Mem Cogn. 2020. PMID: 30998073
-
Electrophysiological measures of episodic memory control and memory retrieval.Clin EEG Neurosci. 2006 Oct;37(4):315-21. doi: 10.1177/155005940603700409. Clin EEG Neurosci. 2006. PMID: 17073170 Review.
-
Frontal midline theta oscillations during working memory maintenance and episodic encoding and retrieval.Neuroimage. 2014 Jan 15;85 Pt 2(0 2):721-9. doi: 10.1016/j.neuroimage.2013.08.003. Epub 2013 Aug 8. Neuroimage. 2014. PMID: 23933041 Free PMC article. Review.
Cited by
-
Neural temporal context reinstatement of event structure during memory recall.J Exp Psychol Gen. 2023 Jul;152(7):1840-1872. doi: 10.1037/xge0001354. Epub 2023 Apr 10. J Exp Psychol Gen. 2023. PMID: 37036669 Free PMC article.
-
A context-based model of collaborative inhibition during memory search.Sci Rep. 2024 Nov 12;14(1):27645. doi: 10.1038/s41598-024-78517-w. Sci Rep. 2024. PMID: 39532935 Free PMC article.
-
Neural biomarkers of age-related memory change.Psychol Aging. 2025 May;40(3):265-277. doi: 10.1037/pag0000876. Epub 2025 Feb 6. Psychol Aging. 2025. PMID: 39913469
-
Interresponse times in free recall.J Exp Psychol Learn Mem Cogn. 2025 Jul 3:10.1037/xlm0001498. doi: 10.1037/xlm0001498. Online ahead of print. J Exp Psychol Learn Mem Cogn. 2025. PMID: 40608468
References
-
- Appelhoff S, Sanderson M, Brooks TL, van Vliet M, Quentin R, Holdgraf C, Chaumon M, Mikulan E, Tavabi K, Höchenberger R, Welke D, Brunner C, Rockhill AP, Larson E, Gramfort A, & Jas M (2019). MNE-BIDS: Organizing electrophysiological data into the BIDS format and facilitating their analysis. Journal of Open Source Software, 4(44), Article 1896. 10.21105/joss.01896 - DOI - PMC - PubMed
-
- Balota DA, & Neely JH (1980). Test-expectancy and word-frequency effects in recall and recognition. Journal of Experimental Psychology: Human Learning & Memory, 6(5), 576–587. 10.1037/0278-7393.6.5.576 - DOI
-
- Berger H (1929). Über das elektrenkephalogramm des menschen [On the human electroencephalogram]. Archiv für Psychiatry und Nervenkrankheiten, 87(1), 527–570. 10.1007/BF01797193 - DOI
MeSH terms
Grants and funding
LinkOut - more resources
Full Text Sources
