. 2024 Sep 13;30(18):4201-4214.
doi: 10.1158/1078-0432.CCR-24-0352.

Reconstitution of the Multiple Myeloma Microenvironment Following Lymphodepletion with BCMA CAR-T Therapy

Affiliations

Reconstitution of the Multiple Myeloma Microenvironment Following Lymphodepletion with BCMA CAR-T Therapy

Yazi Yang et al. Clin Cancer Res. .

Abstract

Purpose: The purpose of this study was to investigate the remodeling of the multiple myeloma microenvironment after B-cell maturation antigen (BCMA)-targeted chimeric antigen receptor T (CAR-T) cell therapy.

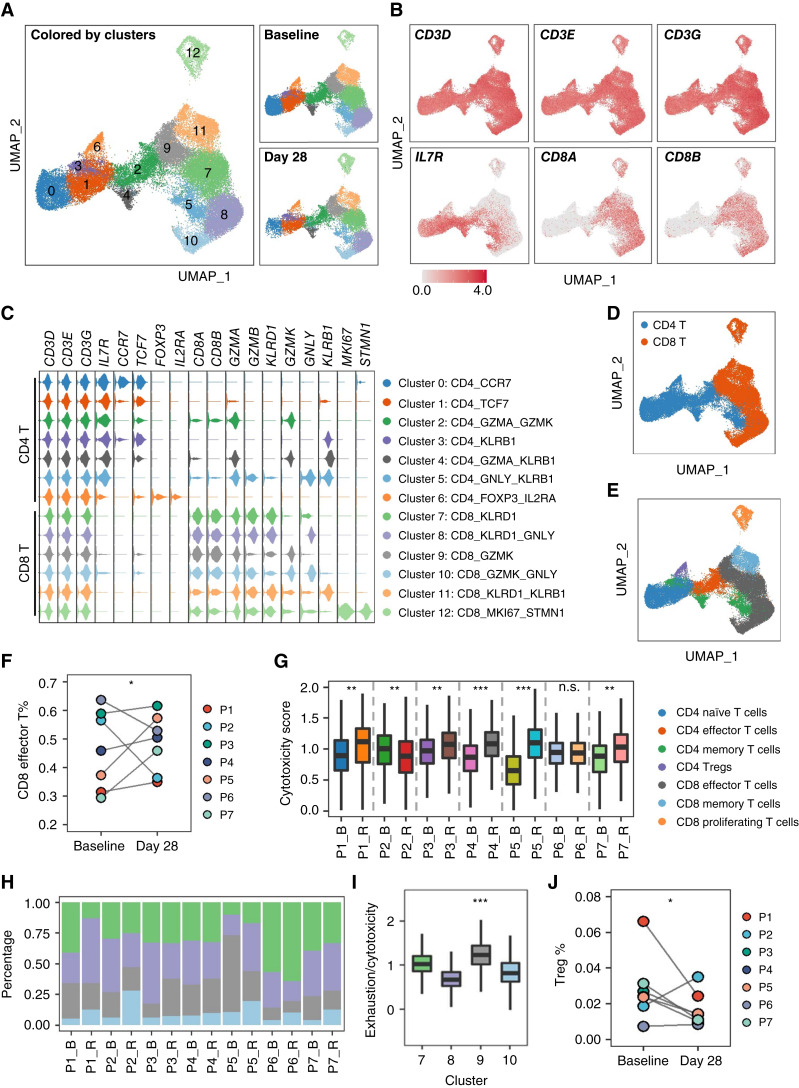
Experimental design: We performed single-cell RNA sequencing on paired bone marrow specimens (n = 14) from seven patients with multiple myeloma before (i.e., baseline, "day -4") and after (i.e., "day 28") lymphodepleted BCMA CAR-T cell therapy.

Results: Our analysis revealed heterogeneity in gene expression profiles among multiple myeloma cells, even those harboring the same cytogenetic abnormalities. The best overall responses of patients over the 15-month follow-up are positively correlated with the abundance and targeted cytotoxic activity of CD8+ effector CAR-T cells on day 28 after CAR-T cell infusion. Additionally, favorable responses are associated with attenuated immunosuppression mediated by regulatory T cells, enhanced CD8+ effector T-cell cytotoxic activity, and elevated type 1 conventional dendritic cell (DC) antigen presentation ability. DC re-clustering inferred intramedullary-originated type 3 conventional DCs with extramedullary migration. Cell-cell communication network analysis indicated that BCMA CAR-T therapy mitigates BAFF/GALECTIN/MK pathway-mediated immunosuppression and activates MIF pathway-mediated anti-multiple myeloma immunity.

Conclusions: Our study sheds light on multiple myeloma microenvironment dynamics after BCMA CAR-T therapy, offering clues for predicting treatment responsivity.


Conflict of interest statement

No disclosures were reported.

Figures

Figure 1.
Figure 1.
A landscape view of the cellular composition of patients with multiple myeloma before and after BCMA CAR-T therapy. A, Schematic of the experimental pipeline. Fourteen specimens were isolated from seven patients with multiple myeloma at baseline (P1_B, P2_B, P3_B, P4_B, P5_B, P6_B, and P7_B) and on day 28 (P1_R, P2_R, P3_R, P4_R, P5_R, P6_R, and P7_R), dissociated into single-cell suspensions, and analyzed using 10x Genomics Chromium droplet scRNA-seq. B–D, UMAP plots displaying 87,413 cells isolated from 14 specimens. UMAP plots of cells colored by patients (B), specimens (C), and sampling time points (D). E, UMAP plot showing 20 cell clusters within the multiple myeloma microenvironment with a clustering resolution of 0.4. F, Heatmap plotting the correlation coefficient among 20 cell clusters. The color keys from blue to red indicate the correlation coefficient from low to high. G, UMAP plot showing nine cell types within the multiple myeloma microenvironment. H, Heatmap of representative marker genes for each cell type. The color keys from blue to red indicate the gene expression levels from low to high. I, Line chart showing the proportion of multiple myeloma cells in seven patients with multiple myeloma at baseline and on day 28. The number of multiple myeloma cells was corrected in the analysis of immune cell–type proportions among the multiple myeloma microenvironment. BMMC, bone marrow mononuclear cells; GMP, granulocyte–macrophage progenitors; MK, megakaryocytes; pDC, plasmacytoid DCs.
Figure 2.
Figure 2.
Delineation of the heterogeneity in driver genes among multiple myeloma cells. A, Feature plots showing the expression levels of marker genes and immunoglobulins in multiple myeloma cells. B, UMAP plot of multiple myeloma cells colored by patients. C, Heatmap indicating the CNV patterns of inferred multiple myeloma cell clusters. Blue, white, and red, respectively, indicate deletion from a chromosome, normal chromosome, and amplification on a chromosome. D, UMAP plot showing the inferred multiple myeloma cell subclusters identified by CopyKAT with a subclustering resolution of 0.2. E, Dot plot of differentially expressed driver genes among patients with multiple myeloma. The color scale represents the average gene expression level; dot size represents the percentage of cells expressing a given gene. F, UMAP plot of the multiple myeloma cells colored by inferred cell cycles. G, Bar chart displaying the proportion of multiple myeloma cells at G1, S, and G2–M phases. H, Box plot depicting the cell-cycle score of multiple myeloma cells. t tests were performed. **, P < 0.01. I, Dot plot of proliferation-associated transcription factors for each patient with multiple myeloma. The color scale represents the average gene expression level; dot size represents the percentage of cells expressing a given gene.
Figure 3.
Figure 3.
The BORs of patients are positively correlated with the abundance and targeted cytotoxic activity of CD8+ effector CAR-T cells on day 28 postinfusion. A, UMAP plot showing eight subclusters of CAR-T cells from seven patients with multiple myeloma on day 28 with a clustering resolution of 2.5. B, Feature plots displaying the expression levels of CD3D, CD3G, CAR, IL7R, CD8A, and CD8B in CAR-T cells. C, Violin plot showing the expression levels of representative marker genes in each CAR-T cell subcluster. D, UMAP plot depicting the CAR-T cells colored by defined cell types based on the expression levels of IL7R, CD8A, and CD8B. E, UMAP plots of the CAR-T cells colored by defined cell types based on representative marker gene expression in CAR-T subclusters. F, Bar chart displaying the proportion of CD8+ effector CAR-T cells among CAR-T cells in each patient on day 28. t tests were performed. **, P < 0.01. G, Box plot showing the expression of CAR of CD8+ effector CAR-T cells in each patient on day 28. t tests were performed. ***, P < 0.001. H, Dot plot of cytotoxicity-associated genes for CD8+ effector CAR-T cells in each patient with multiple myeloma on day 28. The color scale represents the average gene expression level; dot size represents the percentage of cells expressing a given gene.
Figure 4.
Figure 4.
BCMA CAR-T therapy enhances the cytotoxic activity of CD8+ effector T cells and reduces the abundance of Tregs, positively correlating with therapeutic responsivity. A, UMAP plots showing 13 subclusters of endogenous T cells from seven patients with multiple myeloma at baseline and on day 28 with a clustering resolution of 0.6. B, Feature plots displaying the expression levels of CD3D, CD3E, CD3G, IL7R, CD8A, and CD8B in endogenous T cells. C, Violin plot showing the expression levels of representative marker genes in each endogenous T-cell subcluster. D, UMAP plot depicting the endogenous T cells colored by defined cell types based on the expression levels of IL7R, CD8A, and CD8B. E, UMAP plot of the endogenous T cells colored by defined cell types based on representative marker gene expression in endogenous T-cell subclusters. F, Comparison of the proportion of CD8+ effector T cells among T cells in each patient on day 28 vs. baseline. t tests were performed. *, P < 0.05. G, Box plot showing the cytotoxicity score of CD8+ effector T cells in each patient on day 28 vs. baseline. t tests were performed. **, P < 0.01; ***, P < 0.001; n.s., not significant. H, Bar chart displaying the proportion of CD8+ effector T-cell subclusters among CD8+ effector T cells in each patient at baseline and on day 28. I, Box plot depicting the exhausted/cytotoxicity score of each CD8+ effector T-cell subcluster at baseline. t tests were performed. ***, P < 0.001. J, Comparison of the proportion of Tregs among T cells in each patient on day 28 vs. baseline. t tests were performed. *, P < 0.05.
Figure 5.
Figure 5.
BCMA CAR-T therapy attenuates immunosuppression mediated by MDSCs. A, UMAP plots showing 11 subclusters of MNCs from seven patients with multiple myeloma at baseline and on day 28 with a clustering resolution of 0.5. B, Feature plots displaying the expression levels of LYZ, S100A9, CD14, CD16, MPO, and LTF in MNCs. C, Violin plot showing the expression levels of representative marker genes in each MNC subcluster. D, UMAP plot depicting the MNCs colored by defined cell types based on the expression levels of CD14, CD16, MPO, and LTF. E, UMAP plot of the MNCs colored by defined cell types based on representative marker gene expression in MNC subclusters. F, Dot plot depicting the expression levels of recognized MDSC marker genes and HLA-Ⅱ molecules in each MNC subcluster. The color scale represents the average gene expression level; dot size represents the percentage of cells expressing a given gene. G, Comparison of the proportion of MDSCs among MNCs in each patient on day 28 vs. baseline. t tests were performed. **, P < 0.01. H, Box plot showing the HLA-Ⅱ molecule expression scores of MDSCs in each patient on day 28 vs. baseline. t tests were performed. **, P < 0.01; ***, P < 0.001. GMP, granulocyte–macrophage progenitors; NE, neutrophils.
Figure 6.
Figure 6.
BCMA CAR-T therapy enhances the antigen presentation ability of cDC1s/cDC2s and enables the inference of cDC3 developmental processes. A, UMAP plots showing six subclusters of DCs from seven patients with multiple myeloma at baseline and on day 28 with a clustering resolution of 0.5. B, Feature plots displaying the expression levels of ID2, CD1C, CD36, and LILRA4 in DCs. C, Violin plot showing the expression levels of representative marker genes in each DC subcluster. D, UMAP plot depicting the DCs colored by defined cell types based on the expression levels of ID2, CD1C, CD36, and LILRA4. E, UMAP plot of the DCs colored by defined cell types based on representative marker gene expression in DC subclusters. F, Box plot depicting the HLA-I molecule expression scores of cDC1s in each patient on day 28 vs. baseline. t tests were performed. **, P < 0.01; ***, P < 0.001. G, Box plot depicting the HLA-Ⅱ molecule expression scores of cDC2s in each patient on day 28 vs. baseline. t tests were performed. ***, P < 0.001. H, Bar chart displaying the proportion of DC subclusters among DCs in each patient at baseline and on day 28. I and J, GO enrichment analysis of the upregulated genes in cDC1s/cDC2s (I) and cDC3s (J) indicating the top altered 10 terms in the biological process of GO. The x-axis specifies the number of genes enriched in the pathways. The color keys from shallow to deep indicate the P value from high to low. pDC, plasmacytoid DCs.

References

    1. Kumar SK, Rajkumar V, Kyle RA, van Duin M, Sonneveld P, Mateos MV, et al. . Multiple myeloma. Nat Rev Dis Primers 2017;3:17046. - PubMed
    1. van de Donk NWCJ, Pawlyn C, Yong KL. Multiple myeloma. Lancet 2021;397:410–27. - PubMed
    1. Mikkilineni L, Kochenderfer JN. CAR T cell therapies for patients with multiple myeloma. Nat Rev Clin Oncol 2021;18:71–84. - PubMed
    1. van de Donk NWCJ, Usmani SZ, Yong K. CAR T-cell therapy for multiple myeloma: state of the art and prospects. Lancet Haematol 2021;8:e446–61. - PubMed
    1. Berdeja JG, Madduri D, Usmani SZ, Jakubowiak A, Agha M, Cohen AD, et al. . Ciltacabtagene autoleucel, a B-cell maturation antigen-directed chimeric antigen receptor T-cell therapy in patients with relapsed or refractory multiple myeloma (CARTITUDE-1): a phase 1b/2 open-label study. Lancet 2021;398:314–24. - PubMed

Substances