. 2024 Aug 27;43(8):114483.
doi: 10.1016/j.celrep.2024.114483. Epub 2024 Jul 17.

Excessive firing of dyskinesia-associated striatal direct pathway neurons is gated by dopamine and excitatory synaptic input

Affiliations

Excessive firing of dyskinesia-associated striatal direct pathway neurons is gated by dopamine and excitatory synaptic input

Michael B Ryan et al. Cell Rep. .

Abstract

The striatum integrates dopaminergic and glutamatergic inputs to select preferred versus alternative actions. However, the precise mechanisms underlying this process remain unclear. One way to study action selection is to understand how it breaks down in pathological states. Here, we explored the cellular and synaptic mechanisms of levodopa-induced dyskinesia (LID), a complication of Parkinson's disease therapy characterized by involuntary movements. We used an activity-dependent tool (FosTRAP) in conjunction with a mouse model of LID to investigate functionally distinct subsets of striatal direct pathway medium spiny neurons (dMSNs). In vivo, levodopa differentially activates dyskinesia-associated (TRAPed) dMSNs compared to other dMSNs. We found this differential activation of TRAPed dMSNs is likely to be driven by higher dopamine receptor expression, dopamine-dependent excitability, and excitatory input from the motor cortex and thalamus. Together, these findings suggest how the intrinsic and synaptic properties of heterogeneous dMSN subpopulations integrate to support action selection.

Keywords: CP: Neuroscience; Parkinson's Disease; basal ganglia; dopamine; dyskinesia; electrophysiology; levodopa; optogenetics; striatum.


Conflict of interest statement

Declaration of interests The authors declare no competing interests.

Figures

Figure 1.
Figure 1.. Optogenetically identified TRAPed striatal neurons show differential firing responses to levodopa in vivo
TRAPed striatal single units were recorded in freely moving parkinsonian mice using an optogenetic labeling approach. (A) Experimental timeline. (B and C) Behavior in parkinsonian mice, aligned to levodopa injection at t = 0 (N = 20). (B) Rotation rate (contralesional-ipsilesional rotations per minute). (C) Dyskinesia (quantified by the Abnormal Involuntary Movement, AIM score). (D and E) DIO-ChR2-eYFP viral injection and optrode array in the dorsolateral striatum of a FosTRAP;Ai14 mouse. (D) Representative postmortem histology. Scale bar represents 1 mm. (E) Coronal schematic. (F) Representative optogenetically labeled TRAPed striatal unit. Left: peri-event raster (top) and histogram (bottom) showing spiking in response to laser (blue box). Right: average spontaneous (top) and laser-evoked (bottom) waveforms. (G) Proportion of all (left; n = 335, N = 20) and optically labeled TRAPed (right; n = 12, N = 9) striatal units, including putative interneurons (IN), direct pathway (dMSN), indirect pathway (iMSN), and no response (NR) striatal units. (H–J) Average firing rate of putative (H) iMSNs (n = 101, N = 20), (I) dMSNs (n = 170, N = 20), and (J) optically labeled TRAPed dMSNs (n = 9, N = 7), aligned to levodopa injection at t = 0. (K) Average firing rate of all putative dMSNs and optogenetically labeled TRAPed dMSNs in parkinsonian mice before (Park) and after levodopa administration (LID). Dotted line represents the firing rate of optogenetically labeled dMSNs from healthy controls (from Ryan et al.). (L–N) Data from a single recording session, including (L) dyskinesia score, (M) firing rate of a putative dMSN, and (N) firing rate of an optogenetically labeled TRAPed putative dMSN. Insets: firing rate vs. dyskinesia score. (O) Average correlation (R2) of firing rate to dyskinesia for all putative dMSNs vs. TRAPed dMSNs. n = single units, N = mice. All data are presented as mean ± SEM. *p < 0.05, Wilcoxon rank-sum test. See also Figure S1.
Figure 2.
Figure 2.. Monosynaptic rabies tracing of striatal inputs in healthy, parkinsonian, and levodopa-treated mice
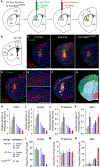
A dual viral, Cre-dependent strategy was used to label monosynaptic inputs onto direct pathway, indirect pathway, and TRAPed striatal neurons. (A) Schematic of the experimental approach in D1-Cre, A2a-Cre, and FosTRAPCreER mice. (B and C) Coronal schematic (B) and low-magnification histological sections (C) showing helper virus expressing “starter” neurons (sTpEpB, green) and rabies-labeled neurons (Rabies-mCherry, red) in D1-Cre (left), A2a-Cre (middle), and FosTRAPCreER (right) mice. NT = NeuroTrace stain for visualization. (D–G) Quantification of labeled presynaptic cell bodies. (D) Low-magnification image of coronal section showing helper (green) and rabies (red) viral injection sites. (E) High magnification of the box in (D), with overlaid points denoting rabies-positive presynaptic cell bodies (bottom). (F and G) Same section as in (D) with overlaid cell detection for (F) the histological section and (G) the projection into the Allen Brain Atlas. (H–K) Relative number of presynaptic neurons, calculated as the number of extra-striatal rabies-labeled neurons divided by the number of co-infected (rabies/helper virus labeled) striatal neurons for (H) all extra-striatal brain regions, (I) cortex, (J) thalamus, and (K) external globus pallidus. (L–N) Relative proportion of total inputs, calculated as the number of extra-striatal rabies-labeled neurons divided by the total number of extra-striatal labeled neurons brain-wide for (L) cortex, (M) thalamus, and (N) external globus pallidus. A2a: control, N = 6, Park, N = 4, LID, N = 3; D1: control, N = 9, Park, N = 10, LID, N = 6; TRAP: LID, N = 8. Data are presented as mean ± SEM. N = animals. Scale bars represent 1 mm. See also Figures S2, S3, S4, and S5A–S5D.
Figure 3.
Figure 3.. Increased presynaptic excitatory transmission onto TRAPed dMSNs
Excitatory inputs to striatal dMSNs were compared in ex vivo brain slices from the dorsolateral striatum of FosTRAP;Ai14;D2-GFP mice. (A–D) (A) Coronal schematic (left) and representative current traces (right) from unTRAPed iMSNs, unTRAPed dMSNs, and TRAPed dMSNs in the presence of picrotoxin and tetrodotoxin to isolate miniature excitatory postsynaptic currents (mEPSCs). (B) Cumulative probability distribution of mEPSC frequencies. Inset: average mEPSC frequencies (unTRAPed iMSNs: n = 21, N = 8; unTRAPed dMSNs: n = 20, N = 7; TRAPed dMSNs: n = 20, N = 8). (C) Coronal schematic (left) and representative traces (right) from unTRAPed iMSNs, unTRAPed dMSNs, and TRAPed dMSNs in response to local electrical stimulation (arrowheads) in the presence of picrotoxin to isolate evoked EPSCs. (D) Quantification of the paired pulse ratio in unTRAPed iMSNs (n = 17, N = 8), unTRAPed dMSNs (n = 18, N = 9), and TRAPed dMSNs (n = 22, N = 9). (E–P) The strength of major excitatory inputs was compared across unTRAPed and TRAPed dMSNs using an optogenetic approach, n = pairs, N = mice. (E) Schematic of recording configuration. (F) Low-magnification image of dorsolateral striatum, showing TRAPed neurons (red), D2R-expressing neurons (green), and a pair of biocytin-filled neurons (blue). Scale bar represents 100 μm. (G) High magnification of section in (F), showing a pair of neighboring, sequentially recorded TRAPed and unTRAPed dMSNs (arrows). Scale bar represents 25 μm. (H–P) Optical activation of inputs from primary motor cortex (H–J, M1, n = 19, N = 4), thalamus (K–M, Thal, n = 15, N = 5), and primary somatosensory cortex (N–P, S1, n = 13, N = 7). (H, K, and N) Coronal schematics (left) and postmortem histology (right) showing viral expression of ChR2-eYFP. Scale bar represents 1 mm. (I, L, and O) Representative examples of optically evoked EPSCs (oEPSCs) for an unTRAPed and TRAPed dMSN (bottom). (J, M, and P) Average oEPSC amplitude at 4 mW for unTRAPed and TRAPed dMSNs. *p < 0.05, Wilcoxon rank-sum test. n = cells, N = mice. Data are presented as mean ± SEM. See also Figures S4 and S5E–S5H.
Figure 4.
Figure 4.. Activation of dopamine D1 receptors enhances the excitability of TRAPed, but not unTRAPed, dMSNs
(A–H) Striatal neurons were targeted for ex vivo whole-cell recordings in coronal brain slices from parkinsonian and levodopa-treated FosTRAP;Ai14;D2-GFP mice. (A) Left: cartoon showing recordings of unTRAPed iMSNs (gray), unTRAPed dMSNs (blue), and TRAPed dMSNs (red) in the dorsolateral striatum. Right: histological image showing a biocytin-filled TRAPed dMSN targeted for recording (arrow). Tissue shows expression of FosTRAP;Ai14 (tdTomato, red), D2R (GFP, green), and biocytin (blue). Scale bar represents 20 μm. (B–D) Representative voltage responses to current injections before (left) and 10–15 min after bath application of the D1R-agonist, SKF-81297 (right) for an (B) unTRAPed iMSN, (C) unTRAPed dMSN, and (D) TRAPed dMSN. (E) Average current-response curves for unTRAPed iMSNs (gray, n = 17, N = 11), unTRAPed dMSNs (blue, n = 17, N = 13), and TRAPed dMSNs (red, n = 22, N = 14). N = cells, N = mice. *p < 0.05, rmANOVA. (F–H) Current-response curves before (control) and 10–15 min after SKF-81297 for (F) unTRAPed iMSNs (n = 9, N = 6), (G) unTRAPed dMSNs (n = 11, N = 9), and (H) TRAPed dMSNs (n = 14, N = 10). n = cells, N = mice (I–M) Fluorescent in situ hybridization to quantify D1 dopamine receptor (Drd1a), D2 dopamine receptor (Drd2a), and prodynorphin (pDyn) mRNA in levodopa-treated FosTRAP;Ai14 mice. (I) Low magnification of coronal section labeled for DAPI, D1R (Drd1), D2R (Drd2), and TRAP (tdTomato) mRNA. Scale bar represents 1 mm. (J) High magnification of inset shown in (I). Scale bar represents 50 μm. (K–M) Expression of molecular markers for TRAPed and unTRAPed dMSNs, normalized by the average expression of all dMSNs. (K) Quantification of relative expression of D1R mRNA in TRAPed and unTRAPed dMSNs (n = 39, N = 5). (L) Quantification of relative expression of D2R mRNA in TRAPed and unTRAPed dMSNs (n = 39; N = 5). (M) Quantification of relative expression of pDyn mRNA in TRAPed and unTRAPed dMSNs (n = 31; N = 4). n = slices, N = mice. Data are presented as mean ± SEM. See also Tables S2 and S3. See also Figure S6. *p < 0.05, Wilcoxon signed rank test.

References

    1. Gerfen CR, Engber TM, Mahan LC, Susel Z, Chase TN, Monsma FJ Jr., and Sibley DR (1990). D1 and D2 dopamine receptor-regulated gene expression of striatonigral and striatopallidal neurons. Science 250, 1429–1432. - PubMed
    1. Hernandez LF, Kubota Y, Hu D, Howe MW, Lemaire N, and Graybiel AM (2013). Selective effects of dopamine depletion and L-DOPA therapy on learning-related firing dynamics of striatal neurons. J. Neurosci. 33, 4782–4795. 10.1523/JNEUROSCI.3746-12.2013. - DOI - PMC - PubMed
    1. Hernandez-Lopez S, Tkatch T, Perez-Garci E, Galarraga E, Bargas J, Hamm H, and Surmeier DJ (2000). D2 dopamine receptors in striatal medium spiny neurons reduce L-type Ca2+ currents and excitability via a novel PLC[beta]1-IP3-calcineurin-signaling cascade. J. Neurosci. 20, 8987–8995. 10.1523/JNEUROSCI.20-24-08987.2000. - DOI - PMC - PubMed
    1. Barbera G, Liang B, Zhang L, Gerfen CR, Culurciello E, Chen R, Li Y, and Lin DT (2016). Spatially Compact Neural Clusters in the Dorsal Striatum Encode Locomotion Relevant Information. Neuron 92, 202–213. 10.1016/j.neuron.2016.08.037. - DOI - PMC - PubMed
    1. Cruz KG, Leow YN, Le NM, Adam E, Huda R, and Sur M (2023). Cortical-subcortical interactions in goal-directed behavior. Physiol. Rev. 103, 347–389. 10.1152/physrev.00048.2021. - DOI - PMC - PubMed

Publication types

LinkOut - more resources