. 2024 Aug 1;165(8):1793-1805.
doi: 10.1097/j.pain.0000000000003187. Epub 2024 Feb 13.

Development of PainFace software to simplify, standardize, and scale up mouse grimace analyses

Affiliations

Development of PainFace software to simplify, standardize, and scale up mouse grimace analyses

Eric S McCoy et al. Pain. .

Abstract

Facial grimacing is used to quantify spontaneous pain in mice and other mammals, but scoring relies on humans with different levels of proficiency. Here, we developed a cloud-based software platform called PainFace ( http://painface.net ) that uses machine learning to detect 4 facial action units of the mouse grimace scale (orbitals, nose, ears, whiskers) and score facial grimaces of black-coated C57BL/6 male and female mice on a 0 to 8 scale. Platform accuracy was validated in 2 different laboratories, with 3 conditions that evoke grimacing-laparotomy surgery, bilateral hindpaw injection of carrageenan, and intraplantar injection of formalin. PainFace can generate up to 1 grimace score per second from a standard 30 frames/s video, making it possible to quantify facial grimacing over time, and operates at a speed that scales with computing power. By analyzing the frequency distribution of grimace scores, we found that mice spent 7x more time in a "high grimace" state following laparotomy surgery relative to sham surgery controls. Our study shows that PainFace reproducibly quantifies facial grimaces indicative of nonevoked spontaneous pain and enables laboratories to standardize and scale-up facial grimace analyses.


Conflict of interest statement

Conflict of Interest

RPP is the owner of HypothesisToHardware, LLC. This information was disclosed to UNC Chapel Hill and no conflict of interest was determined.

Figures

Figure 1.
Figure 1.
Optimized imaging conditions for black coated mice. (A) Setup showing position of chamber, key light, back light, and camera. (B) Image of properly lit black mouse in imaging chamber. The front is open to the air. Imaging through glass or plastic should be avoided as this creates glare and reflections. Reflections of the mouse can confuse the MLA.
Figure 2.
Figure 2.
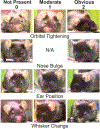
Black mouse grimace scale. The MGS score is calculated for each image by summing the scores assigned to each action unit (0–2 for orbital tightening, ear position, whisker change; 0/2 for nose bulge). Action unit scores can be assigned by humans or by the MLA. N/A, not applicable.
Figure 3.
Figure 3.
MLA architecture used for training and grimace evaluation. (A) Images are initially processed by RetinaNet with Resnet 50 backbone, which has 50 neuron layers, to detect and annotate the body, face, and each facial action unit (orbitals, nose, ears, and whiskers). (B) Grimace score custom convolution neural network is expanded from (A, indicated by dashed lines). After detection of the body, face, and facial action units, the resulting pixels are processed in a scoring network made up of 18 neuron layers, while each convolutional network has 3 parallel channels with 12 neuron layers. Each facial action unit is processed individually using the scoring network. This process occurs separately for each facial action unit.
Figure 4.
Figure 4.
PainFace software platform. (A) PainFace can be accessed from anywhere in the world by visiting http://painface.net with a modern web browser. Videos are uploaded to a secure server for storage. Upon initiating a grimace analysis, the MLA computes a grimace score for every nth (user defined) frame of the video on a GPU cluster. Results are returned to the end-user in a tab-delimited csv file. (B) PainFace screenshot. Bounding boxes and associated confidence values, and scores for each action unit (arrows) are clearly visible.
Figure 5.
Figure 5.
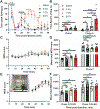
Laparotomy validation experiment. (A) Videos (30 min. duration, 30 fps) from the sham, LAP, and CARLAP experimental groups were manually scored by humans and by the PainFace MLA. (B) No significant differences between human and MLA-scored videos (within group comparisons; from the whole 30 min. video, ten random frames containing four action units were scored from 12 validation videos per group). (C) Mean PainFace grimace score from each 30 min. video (1 frame evaluated by PainFace from each second of video = 1,800 evaluations per video, only images with all four action units used). (D) Mean PainFace grimace score plotted in 5 minute bins (150 random frames sampled per bin containing all four action units) over the 30 min. video. (E) Mean number of frames (out of 600 frames analyzed, dashed line) where all four action units were detected and scored by PainFace during the first 10 min. (F) Analysis of grimace score inaccuracy relative to the number of frames analyzed during the first 10 min. Calculated by subtracting the mean grimace score of every frame with four action units scored by PainFace minus the indicated # of frames with four action units scored by PainFace (frames collected from the first 10 min. of each video). (G) Mean grimace score after evaluating the first 10 min of each video with PainFace at the indicated frame rates (4 FAU frames only). (H) Mean difference score from 30 min. videos (score for each animal was subtracted from the 30 min. baseline of each animal). (I) Mean difference score for first 10 min of each video (score for each animal was subtracted from the first 10 min. baseline of each animal). (J) Mean grimace score of males and females post LAP (n=8 males, n=8 females) from first 10 min. of video. (B-I) n = 12–17 male mice/group. Statistics: (C, F, G, H, I) Kruskal-Wallis, Dunn’s test for multiple comparisons, (J) Mann-Whitney test. *p < 0.05, **p < 0.01, ***p < 0.001, ****p < 0.0001.
Figure 6.
Figure 6.
Histogram analyses of laparotomy validation data. (A) Percentage of 4 FAU frames with the indicated grimace score across the first 10 min. of the videos (6,000 frames sampled/group). (B) Percentage of frames with a grimace score of 1 (across first 10 minutes of each video). (C) Percentage of frames with a grimace score of 6 (across first 10 minutes of each video; 6,000 frames with 4 FAU/group). (D) Percentage of frames with 0–2 (low), 3–4 (medium), or 5–8 (high) MGS scores (sampled from first 10 minutes of each video). n = 14–17 male mice/group. Statistics: Kruskal-Wallis, Dunn’s test for multiple comparisons. *p < 0.05, ***p < 0.001, ****p < 0.0001.
Figure 7.
Figure 7.
Formalin test validation experiments. (A) Time spent licking (in 5 min bins) after injecting saline or formalin (0.5%, 1.0%, or 5.0%) into one hindpaw. (B) Total time spent licking was measured during phase I (0–5 min) and phase II (15–60 min). (C) Mean MGS score calculated from 4 FAU frames (n=100 frames randomly sampled per 5 min bin) following formalin injection. (D) Total MGS score for phase I and phase II, computed from data shown in (C) for the 100 randomly sampled frames. (E, F) Formalin test experiment using a divided imaging chamber (E-inset, red arrows indicate the location of the plastic divider). (E) Mice were placed in the divided chamber 30 minutes after injecting saline, 0.5% formalin, 1.0% formalin, or 5.0% formalin into one hindpaw. Mean MGS score calculated from 4 FAU frames (n=100 frames randomly sampled per 5 min bin). (F) Total MGS score was calculated at the indicated times post saline/formalin injection, computed from data shown in (E). n = 12 male mice/group. Statistics: (A,C,E) Mann-Whitney test. (B,D,F) Kruskal-Wallis, Dunn’s test for multiple comparisons. Black asterisks is 0.5% formalin:saline, open triangle is 1.0% formalin:saline, red asterisks is 5.0% formalin:saline. *p < 0.05, **p < 0.01, ***p < 0.001, ****p < 0.0001.
Figure 8.
Figure 8.
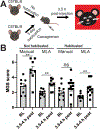
Mogil lab validation experiment. (A) Mice were habituated (1 h/day for 3 days) or not habituated to the setup and lighting, and then were injected with 1% carrageenan (bilateral, both hindpaws) in Dr. Jeff Mogil’s lab at McGill University, Canada. (B) Baseline (BL) and 3.5 h post-injection videos (30 min segment) were scored manually (10 frames/animal) by the Mogil lab and scored with PainFace (MLA). n=10 male C57BL/6 mice. Statistics: Mann-Whitney test. **p < 0.01.

References

    1. Andresen N, Wöllhaf M, Hohlbaum K, Lewejohann L, Hellwich O, Thöne-Reineke C, Belik V. Towards a fully automated surveillance of well-being status in laboratory mice using deep learning: Starting with facial expression analysis. PLoS One 2020;15(4):e0228059. - PMC - PubMed
    1. Aulehner K, Leenaars C, Buchecker V, Stirling H, Schönhoff K, King H, Häger C, Koska I, Jirkof P, Bleich A, Bankstahl M, Potschka H. Grimace scale, burrowing, and nest building for the assessment of post-surgical pain in mice and rats-A systematic review. Front Vet Sci 2022;9:930005. - PMC - PubMed
    1. Backonja MM, Stacey B. Neuropathic pain symptoms relative to overall pain rating. J Pain 2004;5(9):491–497. - PubMed
    1. Bohic M, Pattison LA, Jhumka ZA, Rossi H, Thackray JK, Ricci M, Foster W, Arnold J, Mossazghi N, Tischfield MA, Yttri EA, Smith ESJ, Abdus-Saboor I, Abraira VE. Mapping the signatures of inflammatory pain and its relief. bioRxiv 2021:2021.2006.2016.448689.
    1. Butler RK, Finn DP. Stress-induced analgesia. Prog Neurobiol 2009;88(3):184–202. - PubMed

Publication types

LinkOut - more resources