. 2024 Jul 18;20(7):e1011910.
doi: 10.1371/journal.ppat.1011910. eCollection 2024 Jul.

Single-cell analysis reveals lasting immunological consequences of influenza infection and respiratory immunization in the pig lung

Affiliations

Single-cell analysis reveals lasting immunological consequences of influenza infection and respiratory immunization in the pig lung

Andrew Muir et al. PLoS Pathog. .

Abstract

The pig is a natural host for influenza viruses and integrally involved in virus evolution through interspecies transmissions between humans and swine. Swine have many physiological, anatomical, and immunological similarities to humans, and are an excellent model for human influenza. Here, we employed single cell RNA-sequencing (scRNA-seq) and flow cytometry to characterize the major leukocyte subsets in bronchoalveolar lavage (BAL), twenty-one days after H1N1pdm09 infection or respiratory immunization with an adenoviral vector vaccine expressing hemagglutinin and nucleoprotein with or without IL-1β. Mapping scRNA-seq clusters from BAL onto those previously described in peripheral blood facilitated annotation and highlighted differences between tissue resident and circulating immune cells. ScRNA-seq data and functional assays revealed lasting impacts of immune challenge on BAL populations. First, mucosal administration of IL-1β reduced the number of functionally active Treg cells. Second, influenza infection upregulated IFI6 in BAL cells and decreased their susceptibility to virus replication in vitro. Our data provide a reference map of porcine BAL cells and reveal lasting immunological consequences of influenza infection and respiratory immunization in a highly relevant large animal model for respiratory virus infection.


Conflict of interest statement

The authors have declared that no competing interests exist.

Figures

Fig 1
Fig 1. Experimental design and UMAP clustering of BAL immune cells.
(A) Design of pig immunization/infection experiment. Total number of pigs per treatment is given. For scRNA-seq, 3 pigs were randomly selected for treatments 1, 2 and 3. (B) Graphical overview of applied sorting strategy. (C) Uniform manifold approximation and projection (UMAP) of all cells that passed quality control from pig BAL scRNA-seq analysis, colored by cell-type and labelled with cluster numbers.
Fig 2
Fig 2. Confirmation of scRNA-seq cluster annotation by flow cytometry.
Annotation of clusters in scRNA-seq was confirmed by flow cytometry using antibody panels addressing key marker combinations. Colors used in UMAP clustering (left) match with colored gates and histograms in flow cytometry to indicate the same cell type (right). (A) Different subsets of myeloid cells. (B) B cell and plasma cell subsets. (C) CD4 T cell subsets. (D) CD8 T cell subsets.
Fig 3
Fig 3. Comparison of pig BAL and PBMC scRNA-seq datasets.
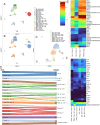
(A-C) UMAP of BAL and PBMC cells. (A) All cells from BAL and PBMC scRNA-seq datasets colored by cell type. (B) All cells from BAL and PBMC scRNA-seq datasets, colored by tissue. (C) T cells from BAL and PBMC scRNA-seq datasets, colored by cell type. (D) Mapping of BAL cells (left) to PBMC clusters (right) via scMAP, colored by cell type. Each node represents one cluster and is labelled with the cell type and cluster number. Unmapped PBMC nodes and links constituting less than 15% of the cells in a single BAL cluster were omitted for legibility. (E-F) Heatmaps of BAL and PBMC cluster gene expression. Each column represents one cluster, labelled with the tissue of origin, cell type and cluster number. Color scale is generated from mean logcounts. (E) Heatmap of B cell clusters and (F) Heatmap of T cell clusters from BAL and PBMC scRNA-seq datasets.
Fig 4
Fig 4. Abundance and test of suppressive function of Tregs.
(A) Tregs identified by scRNA-seq (cluster 10) as a proportion of all CD4 T cells for each treatment (data from 11 pigs: 5 males and 6 females). (B) Tregs identified by flow cytometry as percentage within CD3+CD4+ T cells for each treatment in cell preparations from BAL and tracheobronchial lymph nodes (TBLN) (** denotes p≤0.01). (C) Suppression of IFNγ and TNFα production in pH1N1 re-stimulated BAL CD4 (top panel) and CD8 T cells (bottom panel) from Ad-HA/NP+Ad-IL-1β immunized pigs, in the presence or absence of CD4+CD25neg or CD4+CD25high sorted BAL cells from Ad-HA/NP immunized pigs. Numbers in quadrants show percentages of cells with the respective phenotype.
Fig 5
Fig 5
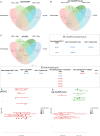
Differential gene expression with immune challenge (A-C) Venn diagrams presenting the number of overlapping and distinct differentially expressed genes for macrophages (clusters 1, 4 and 8), CD4+ T cells (clusters 7, 10, 18b and 20a), CD8+ T cells (clusters 6, 18a and 20b) and B cells (clusters 12 and 16) under each experimental condition. Numerals indicate the number of differentially expressed genes, and the number of arrows corresponds to the number of cell types in which the genes are differentially expressed. Red up arrows indicate gene upregulation, blue down arrows indicate gene downregulation. All genes shown have an adjusted p value (Benjamini-Hochberg) of less than 0.01 when comparing gene expression in each condition versus PBS. (D-E) Tables of all differentially expressed genes shared between cell types for each condition. A full table including both shared and unshared genes is available in S4 Table. (F-G) Bubbleplots presenting GO term enrichment for macrophages, B cells, CD4 T cells and CD8 T cells under each experimental condition, based on all genes with an adjusted p value of less than 0.01. GO terms annotated with fewer than five differentially expressed genes have been omitted. (A) Ad-HA/NP treated pigs versus PBS, (B, D, G) Ad-HA/NP+IL-1β treated pigs versus PBS and (C, E, F) pH1N1 infected pigs versus PBS.
Fig 6
Fig 6. IFI6 abundance, associated genes and functional consequences of IFI6 expression.
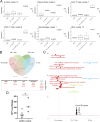
(A) IFI6 expression (normalized log counts per million) from scRNA-seq data across clusters in each experimental condition (data from 11 pigs: 5 males and 6 females). (B) Venn diagram of genes whose expression is associated with IFI6 expression in macrophages (clusters 1, 4 and 8), CD4 T cells (clusters 7, 10, 18b and 20a), CD8 T cells (clusters 6, 18a and 20b) and B cells (clusters 12 and 16). Numerals indicate the number of differentially expressed genes, and the number of arrows corresponds to the number of cell types in which the genes are differentially expressed. Red up arrows indicate gene upregulation, blue down arrows indicate gene downregulation. All genes shown have an adjusted p value (Benjamini-Hochberg) of less than 0.05 and a logFC that is either more than 0.3 or less than –0.3. Accompanying table displays the genes names for all significant genes shared between cell types. A full table including both shared and unshared genes is available in S4 Table. (C) Bubbleplot presenting GO term enrichment for genes differentially expressed as IFI6 is upregulated for macrophages, CD4 T cells and B cells. CD8 T cells have been omitted due to a lack of significant genes. Based on all genes with an adjusted p value of less than 0.05. GO terms annotated with fewer than five differentially expressed genes have been omitted. (D) GFP counts of BAL cells following infection with VSVΔG-GFP 7 hrs post-infection. Comparison of BAL cells from pH1N1 and control pigs. Asterisk indicates significant difference (p<0.05).

References

    1. Schulman JL, Kilbourne ED. Induction of Partial Specific Heterotypic Immunity in Mice by a Single Infection with Influenza a Virus. J Bacteriol. 1965;89:170–4. doi: 10.1128/jb.89.1.170-174.1965 - DOI - PMC - PubMed
    1. Thomas PG, Keating R, Hulse-Post DJ, Doherty PC. Cell-mediated protection in influenza infection. Emerg Infect Dis. 2006;12(1):48–54. doi: 10.3201/eid1201.051237 - DOI - PMC - PubMed
    1. Mueller SN, Gebhardt T, Carbone FR, Heath WR. Memory T cell subsets, migration patterns, and tissue residence. Annu Rev Immunol. 2013;31:137–61. doi: 10.1146/annurev-immunol-032712-095954 - DOI - PubMed
    1. Schenkel JM, Masopust D. Tissue-resident memory T cells. Immunity. 2014;41(6):886–97. doi: 10.1016/j.immuni.2014.12.007 - DOI - PMC - PubMed
    1. Wu T, Hu Y, Lee YT, Bouchard KR, Benechet A, Khanna K, et al.. Lung-resident memory CD8 T cells (TRM) are indispensable for optimal cross-protection against pulmonary virus infection. J Leukoc Biol. 2014;95(2):215–24. doi: 10.1189/jlb.0313180 - DOI - PMC - PubMed

MeSH terms

Substances