. 2024 Jul 19;385(6706):eadm9238.
doi: 10.1126/science.adm9238. Epub 2024 Jul 19.

The human mitochondrial mRNA structurome reveals mechanisms of gene expression

Affiliations

The human mitochondrial mRNA structurome reveals mechanisms of gene expression

J Conor Moran et al. Science. .

Abstract

The human mitochondrial genome encodes crucial oxidative phosphorylation system proteins, pivotal for aerobic energy transduction. They are translated from nine monocistronic and two bicistronic transcripts whose native structures remain unexplored, posing a gap in understanding mitochondrial gene expression. In this work, we devised the mitochondrial dimethyl sulfate mutational profiling with sequencing (mitoDMS-MaPseq) method and applied detection of RNA folding ensembles using expectation-maximization (DREEM) clustering to unravel the native mitochondrial messenger RNA (mt-mRNA) structurome in wild-type (WT) and leucine-rich pentatricopeptide repeat-containing protein (LRPPRC)-deficient cells. Our findings elucidate LRPPRC's role as a holdase contributing to maintaining mt-mRNA folding and efficient translation. mt-mRNA structural insights in WT mitochondria, coupled with metabolic labeling, unveil potential mRNA-programmed translational pausing and a distinct programmed ribosomal frameshifting mechanism. Our data define a critical layer of mitochondrial gene expression regulation. These mt-mRNA folding maps provide a reference for studying mt-mRNA structures in diverse physiological and pathological contexts.


Conflict of interest statement

Competing interests:

The authors declare no competing interests.

Figures

Fig. 1.
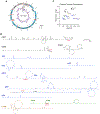
Fig. 1.. The mitoDMS-MaPseq approach allows for the chemical probing of the mitochondrial mRNA structurome.
See also supplementary fig. S1. (A) Schematic of the mitoDMS-MaPseq workflow. The protocol starts with the DMS modification of RNAs in isolated mitochondria (in organello), followed by thermostable group II intron reverse transcriptase (TGIRT) -mediated mutagenesis and library preparation, deep sequencing, and conceptual analysis (see explanation in the text). Created with BioRender.com. (B) Circular representation of the mitochondrial genome displaying the number of unfiltered bitvectors across the H-strand and L-strand transcriptomes at each position. (C) Circular representation of the mitochondrial genome displaying DMS signal/noise ratio (inner tracks) across the heavy (H) and light (L) strands of the mitochondrial transcriptome. The purple and light blue lines (for the H strand) and orange and green lines (L strand) represent signal vs. noise plots of mutation frequencies (i.e., among all reads aligning to each strand coordinate, the fraction of reads with a mutation at that coordinate) on adenines (As) and cytosines (Cs) vs. guanines (Gs) and uracils (Us) as a function of strand coordinate for untreated and DMS-treated RNA. A mutation frequency of 0.01 at a given position represents 1% of reads having a mismatch or deletion at that position. (D) Interexperimental correlation of DMS reactivity for the indicated mitochondrial transcripts at 1% v/v DMS demonstrating high reproducibility. The coefficient of determination R2 value is indicated. (E) Receiver operator characteristic (ROC) curve comparing the published 12S rRNA cryo-EM structure (35) with DMS reactivities from our datasets. The Area under the curve (AUROC) for DMS reactivity-based prediction is 0.84. (F) Pseudo-energy-guided secondary structure model using DMS data on a fragment (H44) of the 12S rRNA and the tRNALys. Nucleotides are colored by normalized DMS reactivities.
Fig. 2.
Fig. 2.. Genome-wide features of the mitochondrial mRNA structurome.
See also supplementary fig. S2 and S3. (A) Circular representations of the mitochondrial genome H and L strands displaying the Gini index of DMS reactivity by taking the mean over a sliding window of 80 nt. (B) Predicted secondary structure of the 9 monocistronic and 2 bicistronic transcripts that conform the mt-mRNA transcriptome. The 3’ UTR in COX1, COX2, and ND5 transcripts are indicated, as well as the overlapping open reading frame regions in the bicistronic transcripts ND4L/4 and ATP8/6. Transcripts are displayed with color-coding corresponding to the OXPHOS complex associated with the encoded protein. (C) Predicted transcript structuredness estimated by calculating the number of predicted paired bases normalized by transcript nucleotide length. CD, coding region without the 3’ UTR.
Fig. 3.
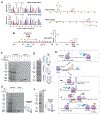
Fig. 3.. Programmed ribosome frameshifting and termination-reinitiation govern the translation of the two ORFs encompassed in the ATP8/ATP6 bicistronic transcript.
See also supplementary fig. S4. (A) DREEM-driven clustering analysis of the Mito-DMSMaPseq data on the ATP8/6 bicistronic transcript. For each cluster, the DMS-reactivity plot is shown on the left panel, and the predicted secondary structure is shown on the right panel. (B) Predicted secondary structure of the ATP8/6 mRNA overlapping region containing the hairpin that occludes the start codon of ATP6 (highlighted in green). The red coloring indicates overlapped published ribosome profiling data (9). The location of the potential slippery and spacer sequences is marked. (C) Metabolic labeling of mitochondrial translation products with [S35]-methionine in mitochondria isolated from WT cells (in organello) followed by immunoprecipitation with antibodies against either the N- or the C-terminus of ATP8, or IgG as a control. In the indicated lines, a chase period was included. (D) Metabolic labeling of mitochondrial translation products with [S35]-methionine in WT and IF3-KO cells (in cellula) in the presence of emetine to inhibit cytosolic protein synthesis. The graphs show the quantification of COX3, ATP6, and ATP8 in 3 independent assays. T-test, **p<0.001. (E) In organello protein synthesis and immunoprecipitation assay in WT and IF3-KO cells, performed as in panel (C). The graph shows ATP8/ATP8Tr ratio quantification in 3 independent assays. T-test, **p<0.001. (F) In cellula mitochondrial protein synthesis in WT and LRPPRC-KO cells. The graph shows the ATP8/ATP6 ratio quantification in three assays. T-test, **p<0.001. (G) Model depicting the translation mechanism of ATP8 and ATP6 from the bicistronic transcript.
Fig. 4.
Fig. 4.. Secondary structures in the COX1 transcript flank regions coding for transmembrane domains.
See also supplementary fig. S5. (A) Predicted secondary structure of the COX1 mRNA. Nucleotides are colored by normalized average population DMS reactivity. The regions coding for transmembrane (TM) domains in the COX1 protein (60) are indicated with blue lines. (B) Analysis of the COX1 mRNA structure vs. translation by plotting the Gini correlation index (structure) and mitoribosome density profiles (retrieved from published ribosome profiling data (9) across the COX1 mRNA sequence. Regions where mito-disomes have been reported (39) are marked with grey lines. The sequences coding for COX1 TMs are indicated as blue blocks. (C) Schematic showing co-translational insertion of COX1 TM domains and how secondary structure in the COX1 mRNA allows for co-translational pausing to allow for TM domain insertion. Previously reported binding of COX1 chaperones COX14 and COA3 to newly synthesized COX1(61) is depicted.
Fig. 5.
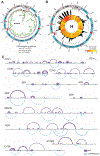
Fig. 5.. A remodeled mitochondrial mRNA structurome arises in the absence of LRPPRC.
See also supplemental fig. S6 and S7 and Data S1, panels 1–11. (A) Circular representation of the mitochondrial genome H- strand displaying the indicated DMS-reactivity correlations between the WT and LRPPRC-KO structuromes. (B) Circular representation of the mitochondrial genome H-strand displaying published LRPPRC binding sites as determined by PAR-CLIP (24) (black histograms) and changes in DMS reactivity in the LRPPRC-KO cell lines as compared to WT (red-yellow shades reflecting R2 values). (C) Linear arc plots indicating predicted areas of secondary structure changes within each mitochondrial transcript between WT and LRPPRC-KO mitochondria.
Fig. 6.
Fig. 6.. An ensemble of secondary structures populates the mitochondrial transcriptome
(A and C) Circular representation of the mitochondrial genome displaying the DREEM clustering analysis of DMS-reactivities across the WT (A) and LRPPRC-KO (B) transcriptomes. The regions with enough reads for clustering analysis, and the correlation between the two clusters determined in each informative 100 nt window are presented. (B and D) Linear representation of each transcript showing the agreement between DMS reactivities and predicted secondary structures (AUROC, blue) for the mt-mRNA transcriptome-wide models in WT and LRPPRC-KO mitochondria. AUROC was calculated over sliding windows of 100 nt in 1-nt increments; x values represent the centers of the windows. The area between the local value and the transcript median is shaded. Regions with AUROC below 0.8, indicating suboptimal modeling, are indicated with pink lines. The two lower panels represent clustering parameters, the percentage of the major and minor clusters (bottom graph), and the Gini index of DMS reactivity (middle graph) for each cluster across 100 nt non-overlapping sliding windows.

Update of

References

    1. Rackham O, Filipovska A, Organization and expression of the mammalian mitochondrial genome. Nat. Rev. Genet 23, 606–623 (2022). - PubMed
    1. Al-Faresi RAZ, Lightowlers RN, Chrzanowska-Lightowlers ZMA, Mammalian mitochondrial translation - revealing consequences of divergent evolution. Biochem. Soc. Trans 47, 1429–1436 (2019). - PubMed
    1. Ferrari A, Del’Olio S, Barrientos A, The diseased mitoribosome. FEBS Lett 595, 1025–1061 (2021). - PMC - PubMed
    1. Gustafsson CM, Falkenberg M, Larsson NG, Maintenance and Expression of Mammalian Mitochondrial DNA. Annu. Rev. Biochem 85, 133–160 (2016). - PubMed
    1. Jedynak-Slyvka M, Jabczynska A, Szczesny RJ, Human Mitochondrial RNA Processing and Modifications: Overview. Int. J. Mol. Sci 22, (2021). - PMC - PubMed