. 2024 Oct 1;84(19):3250-3266.
doi: 10.1158/0008-5472.CAN-24-0970.

Targeting Cholesterol Biosynthesis with Statins Synergizes with AKT Inhibitors in Triple-Negative Breast Cancer

Affiliations

Targeting Cholesterol Biosynthesis with Statins Synergizes with AKT Inhibitors in Triple-Negative Breast Cancer

Alissandra L Hillis et al. Cancer Res. .

Abstract

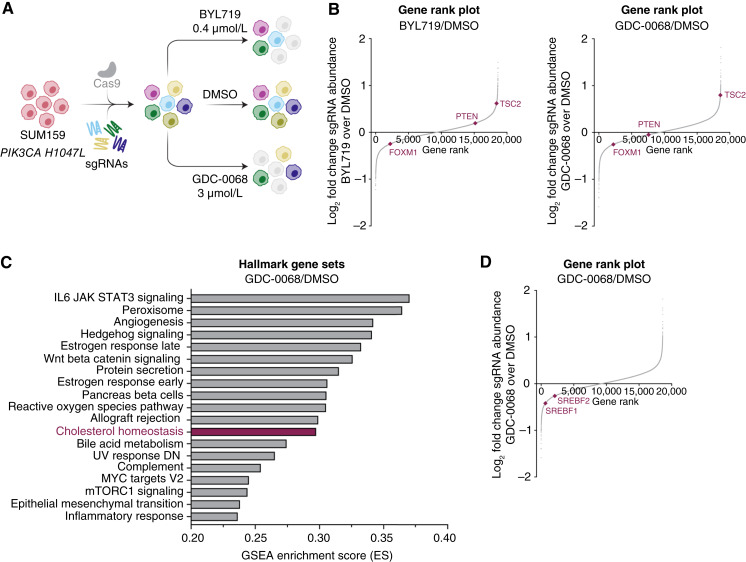
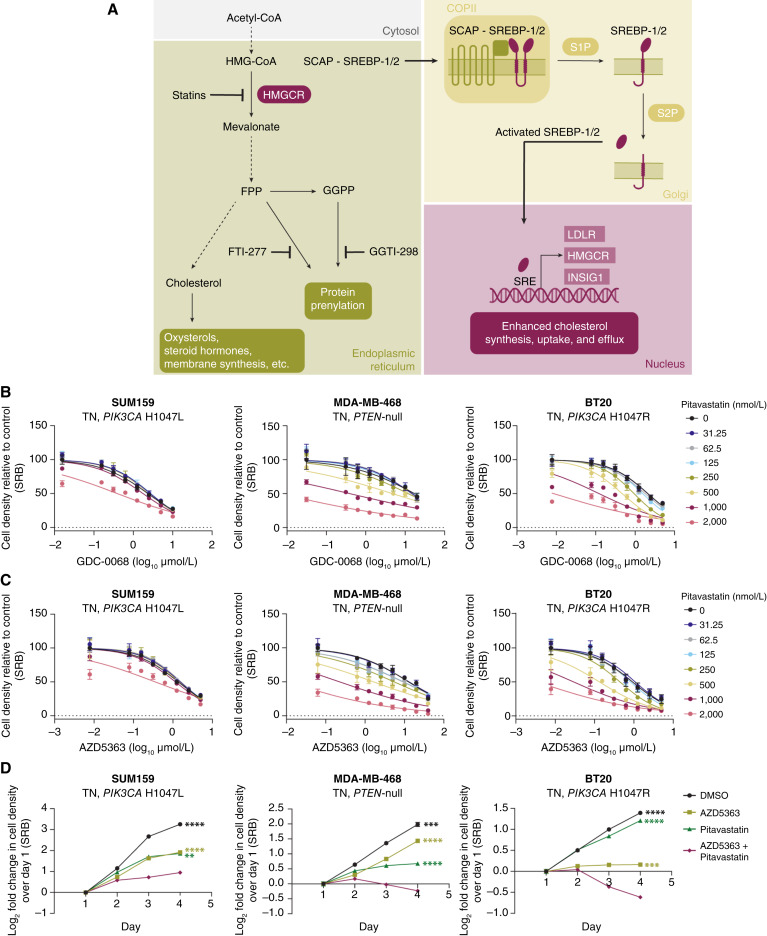
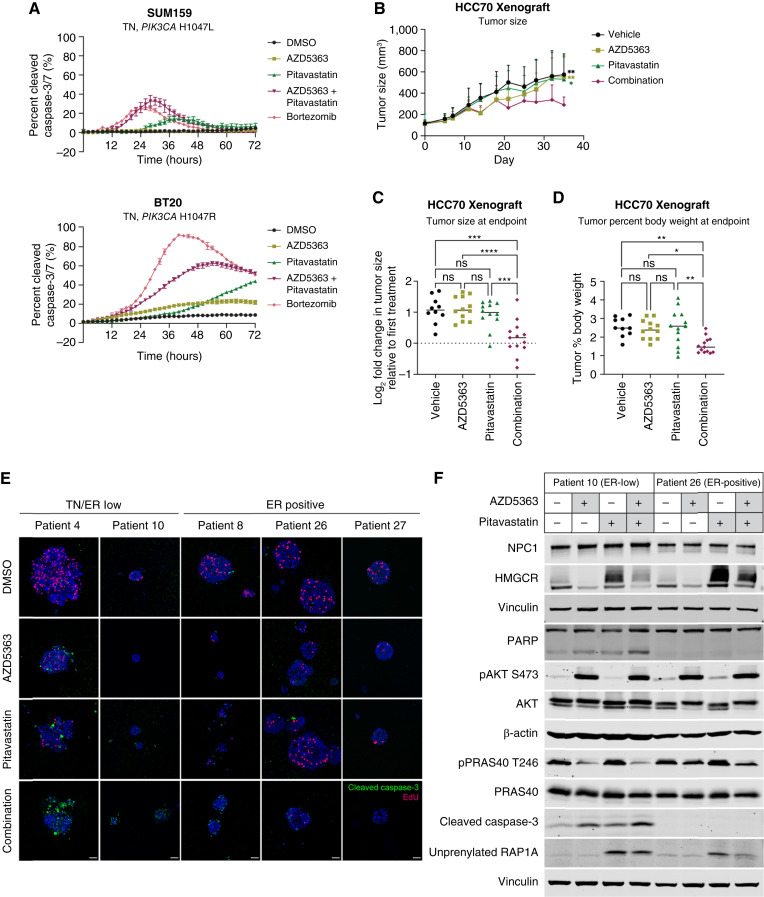
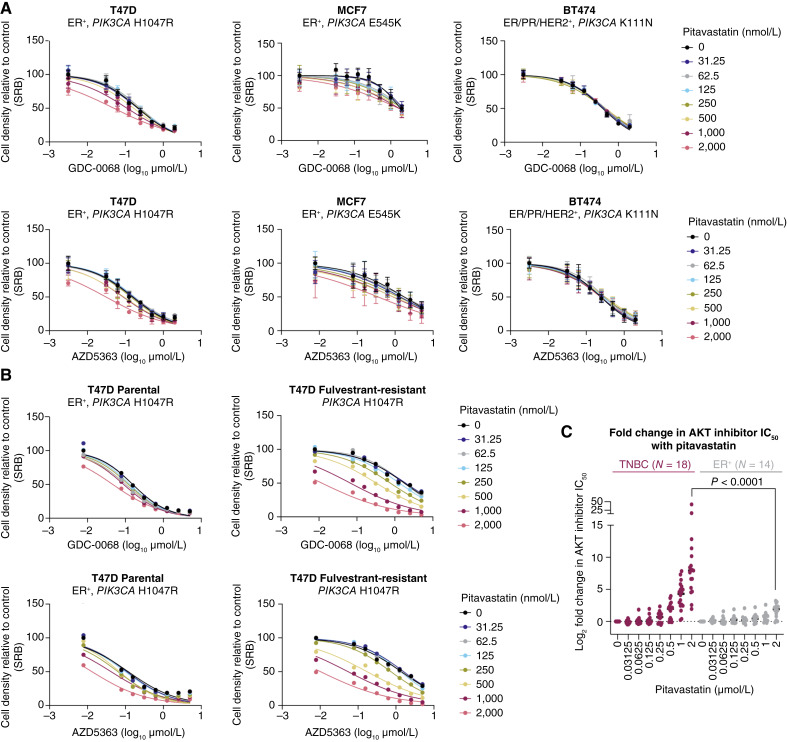
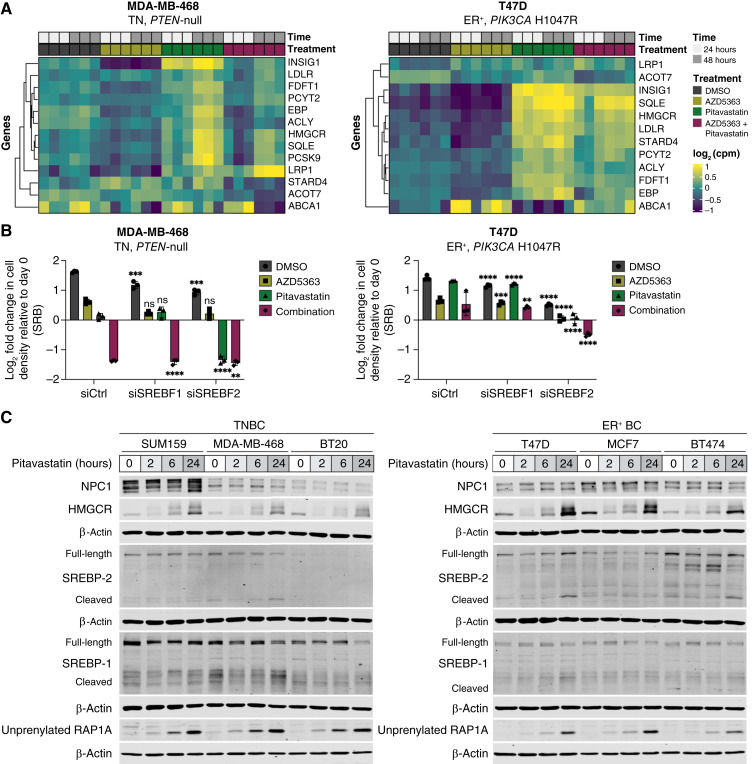
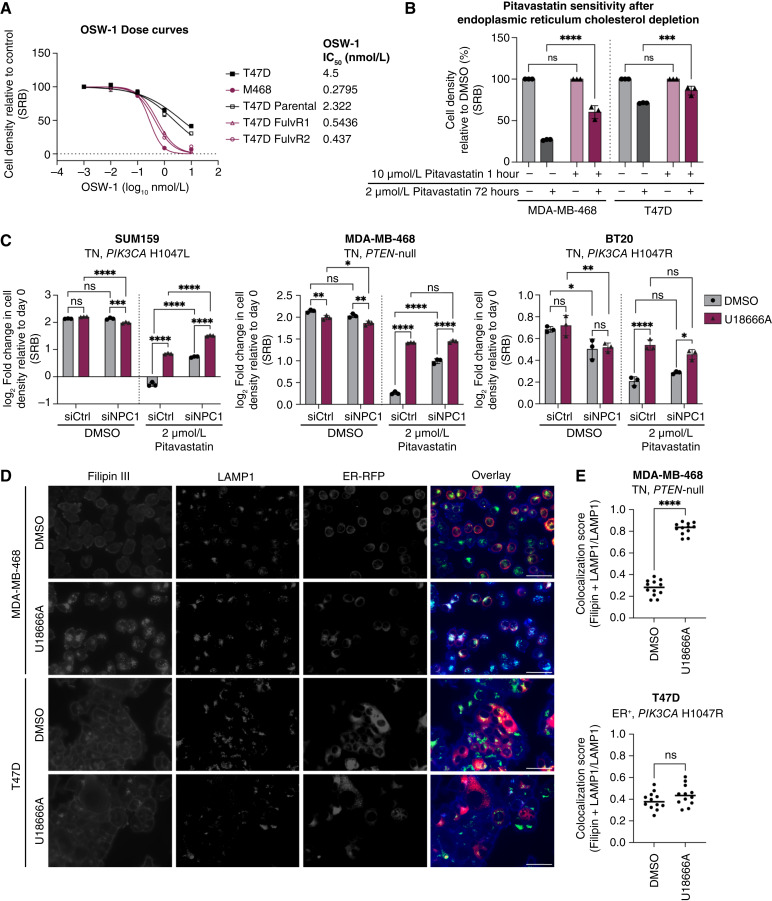
Triple-negative breast cancer (TNBC) is responsible for a disproportionate number of breast cancer patient deaths due to extensive molecular heterogeneity, high recurrence rates, and lack of targeted therapies. Dysregulation of the phosphoinositide 3-kinase (PI3K)/AKT pathway occurs in approximately 50% of TNBC patients. Here, we performed a genome-wide CRISPR/Cas9 screen with PI3Kα and AKT inhibitors to find targetable synthetic lethalities in TNBC. Cholesterol homeostasis was identified as a collateral vulnerability with AKT inhibition. Disruption of cholesterol homeostasis with pitavastatin synergized with AKT inhibition to induce TNBC cytotoxicity in vitro in mouse TNBC xenografts and in patient-derived estrogen receptor (ER)-negative breast cancer organoids. Neither ER-positive breast cancer cell lines nor ER-positive organoids were sensitive to combined AKT inhibitor and pitavastatin. Mechanistically, TNBC cells showed impaired sterol regulatory element-binding protein 2 (SREBP-2) activation in response to single-agent or combination treatment with AKT inhibitor and pitavastatin, which was rescued by inhibition of the cholesterol-trafficking protein Niemann-Pick C1 (NPC1). NPC1 loss caused lysosomal cholesterol accumulation, decreased endoplasmic reticulum cholesterol levels, and promoted SREBP-2 activation. Taken together, these data identify a TNBC-specific vulnerability to the combination of AKT inhibitors and pitavastatin mediated by dysregulated cholesterol trafficking. These findings support combining AKT inhibitors with pitavastatin as a therapeutic modality in TNBC. Significance: Two FDA-approved compounds, AKT inhibitors and pitavastatin, synergize to induce cell death in triple-negative breast cancer, motivating evaluation of the efficacy of this combination in clinical trials.


Conflict of interest statement

J. Högström reports grants from the American Association for Cancer Research, Maud Kuistila Memorial Foundation, Sigrid Jusélius Foundation and Orion Research Foundation during the conduct of the study. D.E. Root reports grants from AbbVie, Bristol Myers Squibb, Janssen, Merck and Vir Biotechnology outside the submitted work. M. Brown reports grants from the Ludwig Center at Harvard and Breast Cancer Research Foundation during the conduct of the study; as well as grants from Novartis and personal fees from Novartis, Kronos Bio, FibroGen and GV20 Therapeutics outside the submitted work. K. Cichowski reports other support from Erasca outside the submitted work. S.T. Barry reports employment and being a shareholder with AstraZeneca. R.R. Madsen reports grants from Wellcome Trust during the conduct of the study; as well as personal fees from Nested Therapeutics outside the submitted work. A. Toker reports grants from NCI and nonfinancial support from AstraZeneca during the conduct of the study; as well as personal fees from American Society for Biochemistry and Molecular Biology (ASBMB) and Novo Holdings of Novo Nordisk Foundation, and grants from BioHybrid Solutions outside the submitted work. No disclosures were reported by the other authors.

Figures

Figure 1.
Figure 1.
Genome-wide CRISPR/Cas9 screen identifies synergy with combined AKT inhibition and cholesterol homeostasis gene knockout in TNBC cells. A, Schematic of CRISPR/Cas9 screen. SUM159 cells were transduced with a Cas9-expressing lentivirus containing 94,495 sgRNAs with 3 to 4 sgRNAs per gene. Infected cells were allowed to grow for approximately 1 week before seeding the treatment arms. Cells were treated with DMSO, BYL719 (PI3Kα-selective inhibitor, 0.4 µmol/L), or GDC-0068 (catalytic AKT inhibitor, 3 µmol/L) for 72 hours (N = 3 technical replicates for each treatment arm). B, Rank plots showing the log2-fold change of each gene plotted against the dropout gene rank for the BYL719 and GDC-0068 treatments arms compared with the DMSO arm. Expected changes in PI3K/AKT signaling genes are highlighted, including TSC2, PTEN, and FOXM1. Plots were generated using MAGeCK with a read count cutoff of 50 (N = 3 technical replicates). C, Plot of the top pathways selectively perturbed in the GDC-0068 arm of the CRISPR/Cas9 screen. Analysis was performed via gene set enrichment analysis. D, Rank plot showing the log2-fold change of each gene plotted against the dropout gene rank for the GDC-0068 treatment arm of the CRISPR/Cas9 screen compared with the DMSO arm. The transcription factors SREBF1 and SREBF2 are highlighted. The plot was generated using MAGeCK with a read count cutoff of 50.
Figure 2.
Figure 2.
Disruption of cholesterol homeostasis synergizes with AKT inhibition in TNBC cells. A, Cholesterol is synthesized in multiple steps from acetyl-CoA. HMGCR catalyzes the first rate-limiting step of cholesterol biosynthesis. This pathway also generates the prenylation substrates FPP and GGPP. SREBP-1/2 sense low endoplasmic reticulum cholesterol levels and translocate from the endoplasmic reticulum to the Golgi where they are cleaved and activated. N-terminal active SREBP-1/2 enter the nucleus to regulate the transcription of target genes. Drugs targeting this pathway are highlighted, including HMGCR inhibitors (statins) and inhibitors of protein farnesylation (FTI-277) and geranylgeranylation (GGTI-298). B and C, TNBC cell lines (SUM159, MDA-MB-468, and BT20) were treated with increasing doses of GDC-0068 (SUM159, 0–10 µmol/L; MDA-MB-468, 0–20 µmol/L; and BT20, 0–5 µmol/L; B) or AZD5363 (SUM159, 0–5 µmol/L; MDA-MB-468, 0–40 µmol/L; BT20, 0–5 µmol/L; C) and pitavastatin (0–2,000 nmol/L) for 72 hours, and cell density was measured by SRB assay. Data are represented as mean ± SD (N = 3 technical replicates). D, TNBC cell lines (SUM159, MDA-MB-468, and BT20) were treated with DMSO, AZD5363 (SUM159, 2.5 µmol/L; MDA-MB-468, 10 µmol/L; BT20, 1.25 µmol/L), pitavastatin (SUM159, 4 µmol/L; MDA-MB-468, 2 µmol/L; BT20, 0.5 µmol/L), or a combination of AZD5363 and pitavastatin for 72 hours, and cell density was measured daily by SRB assay. Data are represented as mean ± SD (N = 3 technical replicates). Statistical analysis was performed using two-way ANOVA with Dunnett multiple comparison test. *, significant differences compared with the AZD5363 and pitavastatin combination treatment on day 4. **, P = 0.0021; ***, P = 0.0002; ****, P < 0.0001.
Figure 3.
Figure 3.
AKT inhibitors synergize with pitavastatin to induce TNBC cytotoxicity. A, TNBC cell lines (SUM159 and BT20) were treated with DMSO, AZD5363 (SUM159, 5 µmol/L; BT20, 1.25 µmol/L), pitavastatin (SUM159, 4 µmol/L; BT20, 2 µmol/L), or a combination of AZD5363 and pitavastatin, and the total cell number (rapid red nuclear dye) and number of dead cells (cleaved caspase-3/7 dye) were measured every 2 hours for 72 hours by Incucyte Live-Cell Analysis. Data are represented as mean ± SD of percent cleaved caspase-3/7 signal (N = 4 technical replicates). B–D, HCC70 cells were injected subcutaneously into NSG mice, and tumors were allowed to grow for 21 days before starting treatments. Mice were switched to a low geranylgeraniol chow diet 3 days before starting treatments and were treated once daily with vehicle (0.5% carboxymethylcellulose, N = 10), 100 mg/kg AZD5363 (4 days on, 3 days off, N = 12), 100 mg/kg pitavastatin (daily, N = 12), or both (N = 13) for 24 days. B, Tumor size (mm3) was measured every 3 to 4 days, starting 10 days after injection of cells. C, Tumor size (mm3) was measured at the endpoint. D, Tumor weight and mouse body weight were measured at the endpoint, and the tumor percent body weight was calculated by dividing tumor weight by mouse body weight. For B–D, statistical analysis was performed using two-way ANOVA with Tukey multiple comparison test (*, significant differences; in B, significant differences compared with the AZD5363 and pitavastatin combination treatment at the endpoint). E, A panel of breast cancer PDOs were treated with DMSO, 1 µmol/L AZD5363, 5 µmol/L pitavastatin, or the combination of AZD5363 and pitavastatin for 96 hours and then pulsed with EdU and stained with a cleaved caspase-3 antibody. A representative image for each PDO in each treatment condition is shown. Scale bars, 40 µm. F, Immunoblots of NPC1, HMGCR, PARP, pAKTSer473, pPRAS40Thr246, cleaved caspase-3, unprenylated RAP1A, β-actin, and vinculin in an ER-low (patient 10) and ER-positive (patient 26) organoid treated with DMSO, 1 µmol/L AZD5363, 5 µmol/L pitavastatin, or the combination for 24 hours. *, P = 0.0332; **, P = 0.0021; ***, P = 0.0002; ****, P < 0.0001; ns, not significant.
Figure 4.
Figure 4.
Pitavastatin does not synergize with AKT inhibition in ER-positive breast cancer cells. A, ER-positive breast cancer cell lines (T47D, MCF7, and BT474) were treated with increasing doses of GDC-0068 (0–2 µmol/L) or AZD5363 (T47D, 0–2 µmol/L; MCF7, 0–5 µmol/L; BT474, 0–2 µmol/L) and pitavastatin (0–2,000 nmol/L) for 72 hours, and cell density was measured by SRB assay. Data are represented as mean ± SD (N = 3 technical replicates). B, Parental and fulvestrant-resistant T47D cells were treated with increasing doses of GDC-0068 (0–5 µmol/L) or AZD5363 (0–5 µmol/L) and pitavastatin (0–2,000 nmol/L) for 72 hours, and cell density was measured by SRB assay (N = 1 technical replicate). C, Log2-fold change in AKT inhibitor IC50 (GDC-0068, AZD5363, MK2206, and ARQ 092) with 2 vs. 0 µmol/L pitavastatin was calculated for six TNBC and five ER-positive breast cancer cell lines. Data are represented around the median (N = the number of cell line and AKT inhibitor combinations tested). Statistical analysis was performed for the 2 µmol/L pitavastatin conditions using an unpaired, nonparametric Mann–Whitney test (P < 0.0001).
Figure 5.
Figure 5.
TNBC cells have impaired pitavastatin-induced SREBP-2 activation. A, RNA-seq was performed in TN (MDA-MB-468) and ER-positive (T47D) breast cancer cells treated with DMSO, AZD5363 (MDA-MB-468, 10 µmol/L; T47D, 0.25 µmol/L), pitavastatin (1 µmol/L), or a combination of AZD5363 and pitavastatin for 24 or 48 hours. Data for SREBF2 target genes are represented as log2 counts per million for each replicate (N = 3 biological replicates per condition). B, TN (MDA-MB-468) and ER-positive (T47D) breast cancer cells were transfected with siControl (siCtrl), siSREBF-1, or siSREBF-2 for 24 hours and then treated with DMSO, AZD5363 (MDA-MB-468, 15 µmol/L; T47D, 0.25 µmol/L), pitavastatin (2 µmol/L), or a combination of AZD5363 and pitavastatin for 72 hours, and cell density was measured by SRB assay. Data are represented as mean ± SD (N = 3 technical replicates). Statistical analysis was performed using two-way ANOVA with Tukey multiple comparison test (*, significant differences compared with the matched treatment condition in the siCtrl cells). C, Immunoblots of NPC1, HMGCR, SREBP-1/2, unprenylated RAP1A, and β-actin in TN (SUM159, MDA-MB-468, and BT20) and ER-positive (T47D, MCF7, BT474) breast cancer cell lines treated with DMSO or 2 µmol/L pitavastatin for 2, 6, or 24 hours. **, P = 0.0021; ***, P = 0.0002; ****, P < 0.0001; ns, not significant. cpm, counts per million.
Figure 6.
Figure 6.
NPC1 inhibition causes lysosomal cholesterol accumulation and rescues pitavastatin sensitivity. A, ER-negative (MDA-MB-468 and T47D fulvestrant-resistant clones 1 and 2) and ER-positive (T47D and parental T47D) breast cancer cell lines were treated with a range of concentrations of OSW-1 (0–10 nmol/L) for 72 hours, and cell density was measured by SRB assay. Data are represented as mean ± SD (N = 3 technical replicates). IC50 values for each cell line are reported. B, TN (MDA-MB-468) and ER-positive (T47D) breast cancer cells were seeded into media supplemented with 10% lipid-depleted serum and treated for 1 hour with vehicle or high dose of pitavastatin (10 µmol/L). Media were removed and replaced with media supplemented with 10% lipid-depleted serum and vehicle or low dose pitavastatin (2 µmol/L) for 72 hours, and cell density was measured by SRB assay. Data are represented as mean ± SD (N = 3 technical replicates). Statistical analysis was performed using two-way ANOVA with Šidák multiple comparison test. C, TNBC cells (SUM159, MDA-MB-468, and BT20) were transfected with siControl (siCtrl) or siNPC1 and then treated with DMSO or 1 µmol/L U18666A and DMSO or 2 µmol/L pitavastatin for 72 hours, and cell density was measured by SRB assay. Data are represented as mean ± SD (N = 3 technical replicates). Statistical analysis was performed using two-way ANOVA with Šidák multiple comparison test. D, TN (MDA-MB-468) and ER-positive (T47D) breast cancer cells expressing red fluorescent protein in the endoplasmic reticulum (ER-RFP; red) were treated with DMSO or 1 µmol/L U18666A for 24 hours. Cells were fixed with 4% formaldehyde and stained with Filipin III (blue) and a LAMP1 antibody (green). Representative images are shown. Scale bars, 50 µm. E, Quantification of Filipin III and LAMP1 colocalization normalized to total LAMP1 from 12 nonoverlapping fields. Statistical analysis was performed using an unpaired, two-tailed parametric t test. *, P = 0.0332; **, P = 0.0021; ***, P = 0.0002; ****, P < 0.0001; ns, not significant.

References

    1. Giaquinto AN, Sung H, Miller KD, Kramer JL, Newman LA, Minihan A, et al. . Breast cancer statistics, 2022. CA Cancer J Clin 2022;72:524–41. - PubMed
    1. Garrido-Castro AC, Lin NU, Polyak K. Insights into molecular classifications of triple-negative breast cancer: improving patient selection for treatment. Cancer Discov 2019;9:176–98. - PMC - PubMed
    1. Bianchini G, De Angelis C, Licata L, Gianni L. Treatment landscape of triple-negative breast cancer—expanded options, evolving needs. Nat Rev Clin Oncol 2022;19:91–113. - PubMed
    1. The Cancer Genome Atlas Network . Comprehensive molecular portraits of human breast tumours. Nature 2012;490:61–70. - PMC - PubMed
    1. Manning BD, Toker A. AKT/PKB signaling: navigating the network. Cell 2017;169:381–405. - PMC - PubMed

MeSH terms