. 2024 Oct 1;84(19):3235-3249.
doi: 10.1158/0008-5472.CAN-23-4054.

CCN6 Suppresses Metaplastic Breast Carcinoma by Antagonizing Wnt/β-Catenin Signaling to Inhibit EZH2-Driven EMT

Affiliations

CCN6 Suppresses Metaplastic Breast Carcinoma by Antagonizing Wnt/β-Catenin Signaling to Inhibit EZH2-Driven EMT

Maria E Gonzalez et al. Cancer Res. .

Abstract

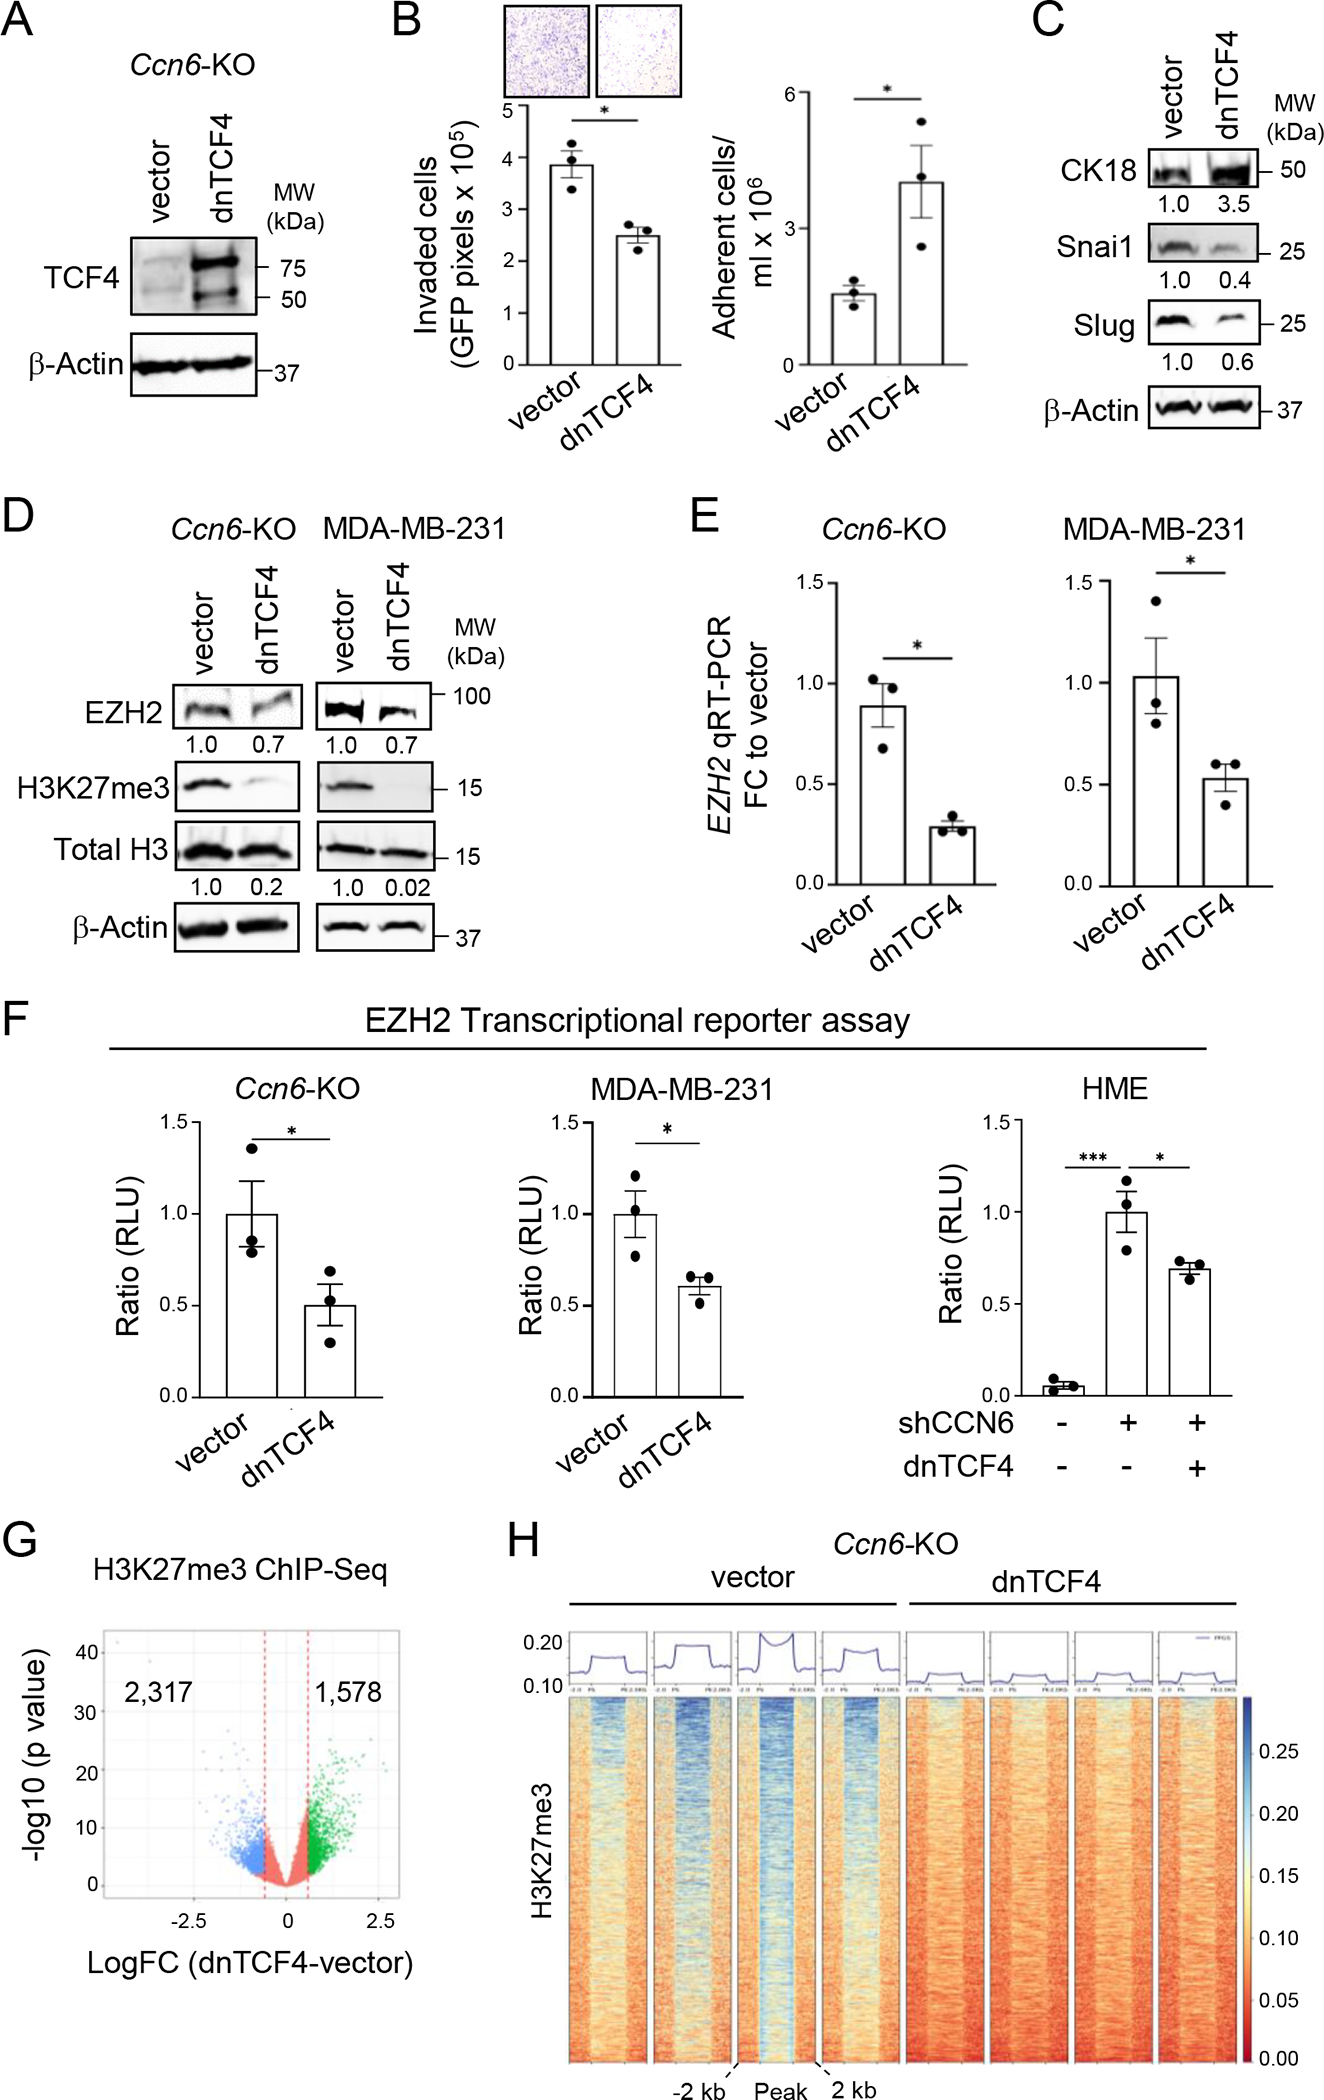
Metaplastic breast carcinomas (mBrCA) are a highly aggressive subtype of triple-negative breast cancer with histologic evidence of epithelial-to-mesenchymal transition and aberrant differentiation. Inactivation of the tumor suppressor gene cellular communication network factor 6 (CCN6; also known as Wnt1-induced secreted protein 3) is a feature of mBrCAs, and mice with conditional inactivation of Ccn6 in mammary epithelium (Ccn6-KO) develop spindle mBrCAs with epithelial-to-mesenchymal transition. Elucidation of the precise mechanistic details of how CCN6 acts as a tumor suppressor in mBrCA could help identify improved treatment strategies. In this study, we showed that CCN6 interacts with the Wnt receptor FZD8 and coreceptor LRP6 on mBrCA cells to antagonize Wnt-induced activation of β-catenin/TCF-mediated transcription. The histone methyltransferase EZH2 was identified as a β-catenin/TCF transcriptional target in Ccn6-KO mBrCA cells. Inhibiting Wnt/β-catenin/TCF signaling in Ccn6-KO mBrCA cells led to reduced EZH2 expression, decreased histone H3 lysine 27 trimethylation, and deregulation of specific target genes. Pharmacologic inhibition of EZH2 reduced growth and metastasis of Ccn6-KO mBrCA mammary tumors in vivo. Low CCN6 is significantly associated with activated β-catenin and high EZH2 in human spindle mBrCAs compared with other subtypes. Collectively, these findings establish CCN6 as a key negative regulator of a β-catenin/TCF/EZH2 axis and highlight the inhibition of β-catenin or EZH2 as a potential therapeutic approach for patients with spindle mBrCAs. Significance: CCN6 deficiency drives metaplastic breast carcinoma growth and metastasis by increasing Wnt/β-catenin activation to upregulate EZH2, identifying EZH2 inhibition as a mechanistically guided treatment strategy for this deadly form of breast cancer.


Conflict of interest statement

Conflict of Interest Statement: The authors declare no conflicts of interest.

Figures

Figure 1.
Figure 1.. Human spindle metaplastic carcinomas display an interacting network of CCN6, β-catenin, and EZH2
A. Protein-protein interaction (PPI) network for differentially expressed proteins in metaplastic breast carcinomas (mBrCA) compared to normal breast. MetaCore network analysis shows β-catenin-EZH2-CCN6 (WISP3) interaction containing 16 up-regulated (red target) proteins and 24 down-regulated (blue target) proteins. Fold change of +/− 1 and a p value of < 1.0e-16 were considered for the analysis. B. Enrichment analysis using gene ontology (GO) annotations showing the top GO terms based on biological process. Significant proteins were considered using p-value < 0.05, fold change (log2-FC) >1. Barplot shows significant terms of hub genes. C. Representative images of human mBrCAs of spindle, squamous and sarcomatoid subtypes stained with hematoxylin and eosin (H&E) and immunostained for CCN6, β-catenin, and EZH2 (×600 magnification). Results are tabulated. Low/negative CCN6 is significantly associated with associated with nuclear β-catenin and high nuclear EZH2 in the spindle subtype of mBrCA compared to other subtypes (sarcomatoid and squamous) (Chi-square p < 0.029). Bars, 100 μm.
Figure 2.
Figure 2.. CCN6 antagonizes canonical Wnt/β-catenin signaling and reduces EZH2 expression
A. Immunoblot of the conditioned media (CM) of MDA-MB-231 cells stably transduced with lentivirus containing CCN6-Flag or ΔTSP1-Flag. Ponceau stain serves as loading control. B. Ectopic CCN6 interacts with endogenous Lrp6 and Fzd8. Proteins from whole cell extracts of cells in A were pulled down using Flag magnetic beads followed by WB. C. Immunofluorescence of MDA-MB-231 cells transduced with Flag-CCN6 or Flag-Vector with antibodies against active hypo-phosphorylated β-catenin and DAPI. Bars show the quantification of nuclear active β-catenin. Bars: mean ± SEM of triplicate experiments. Scale bar, 50 μm. D. Immunofluorescence of Ccn6-KO cells treated rhCCN6 (0.5ng/μl), rhWNT10B (0.3ng/μl), or combined and stained with antibodies against active β-catenin and DAPI. Bars show quantification of nuclear active β-catenin. Scale bar, 50 μm. E. Immunoblot for the indicated proteins of Ccn6-KO cells transduced with CCN6-Flag or ΔTSP1-Flag treated with rhWNT3A (0.3ng/μl) (left) and immunoblot of Ccn6-KO cells treated with rhCCN6 (0.5ng/μl) or rhWNT10B (0.3ng/μl) (right). F. Leading light Wnt reporter assay in cells treated as indicated and shown as response to untreated. rhCCN6 antagonizes canonical Wnt transcriptional activity to similar levels than the Wnt inhibitor Dkk1. G. Immunoblot for the indicated proteins of HME cells transduced with lentivirus containing sh-Control or two independent shRNAs against CCN6. H. Bars show quantification of immunofluorescence staining for nuclear active β-catenin in HME cells treated as indicated. I. Immunoblot of HME-shCCN6 cells treated with rhCCN6 (0.5ng/μl) or WNT3A (0.3ng/μl) for the indicated proteins. For all panels *P < 0.05; **P < 0.005; ***P < 0.0005; ****P < 0.0001
Figure 3.
Figure 3.. CCN6 regulates a β-catenin/EZH2 pathway in mBrCA tumors in vivo
A. Paraffin embedded orthotopic tumors of MMTV-Cre;Ccn6fl/fl previously treated with rhCCN6 or vehicle were employed for H&E and for active β-catenin immunostaining. Bars show percentage of cells with nuclear active β-catenin per 10 high power fields ± SEM. Scale bar, 100 μm. B. Immunohistochemistry of tumors in A, stained with the indicated antibodies. Bars: mean IHC score calculated using the percentage of positive cells and intensity of staining per 10 high power fields ± SEM. Scale bar, 100 μm. C. MetaCore network analysis of quantitative TMT-proteomics of tumors in A reveals a protein-protein interaction (PPI) network of 18 up-regulated (red) proteins and 14 down-regulated (blue) proteins highlighting β-catenin-EZH2 involvement. P value <1.0e-16. D. Gene Ontology (GO) functional annotation of statistically significant differential proteins in the CCN6-β-catenin-EZH2 PPI network. *P < 0.05; **P < 0.005; ***P < 0.0005; ****P < 0.0001
Figure 4.
Figure 4.. The canonical WNT pathway mediates EZH2 transcriptional activity and invasive phenotype of Ccn6-KO mBrCA
A. Western blot (WB) of MMTV-Cre;Ccn6fl/fl tumor-derived cells (Ccn6-KO) transduced with a dominant-negative TCF4 (dnTCF4) construct or pPGS vector control. B. Cells in A were used for cell invasion and adhesion assays. C. WB of Ccn6-KO transduced with dnTCF4 or pPGS control for the indicated proteins. The numbers underneath the bands represent the fold change of dnTCF4 to vector. D. WB of Ccn6-KO and MDA-MB-231 cells transduced with dnTCF4 or pPGS control show that dnTCF4 leads to reduced EZH2 and H3K27me3 expression. The numbers underneath the bands represent the fold change of dnTCF4 to vector. E. qRT-PCR of cells in A shows that dnTCF4 significantly reduces EZH2 mRNA expression levels in Ccn6-KO and in MDA-MB-231 cells. Bars: mean ± SEM of triplicate experiments. F. EZH2 promoter activity using an EZH2 transcriptional reporter assay in Ccn6-KO, MDA-MB-231, and HME-shCCN6 cells transduced with dnTCF4 or pPGS control. Bars: mean promoter activity measured as RLU ± SEM of triplicate experiments. G. H3K27me3 ChIP-sequencing analyses of Ccn6-KO cells transduced with dnTCF4 or pPGS vector. Volcano plot of the log fold change (dnTCF4 vs. pPGS) showing all tested loci. A locus is considered differentially bound if FDR < 0.05 and |logFC| > 0.585. Points are colored according to the direction of differential binding. The vertical lines correspond to the logFC cut-off. H. Profile plot and binding heatmap for H3K27me3 ChIP-seq signal shows the binding within each sample to target loci split among regions differentially bound in dnTCF4 and pPGS. For all panels *P < 0.05; **P < 0.005; ***P < 0.0005; ****P < 0.0001
Figure 5.
Figure 5.. EZH2 transcriptional repressor activity is required for Ccn6-KO-induced β-catenin/TCF4-mediated invasion
A. Heatmap of RNA-seq analyses of Ccn6-KO cells transduced with pPGS vector or dnTCF4 and rescued with adenovirus containing MYC-tagged wild-type EZH2 (MYC-EZH2), ΔSET-EZH2 (MYC-ΔSET), or adenovirus vector. The heatmap shows differential gene expression of Ccn6-KO-dnTCF4-vector vs. Ccn6-KO-dnTCF4-EZH2 (n=452 differentially expressed genes, DEGs, from 13,710 genes with measured expression). Green bars indicate genes that are rescued by MYC-EZH2 but not by MYC-ΔSET (n=64). B. Volcano plot of the 452 significant DEGs between Ccn6-KO-dnTCF4-vector and Ccn6-KO-dnTCF4-EZH2. The x-axis shows the measured expression of DEGs and y-axis shows the significance of the change as negative log (base 10) of the p-value. The dotted lines represent the thresholds used to select DEGs. Upregulated genes are red, downregulated genes are blue. We found that 64 genes are rescued by wild-type EZH2 but not by ΔSET-EZH2. Highlighted in yellow are 17 most significant DEGs that form the strongest network with EZH2. C. GO functional annotation of the 17 genes highlighted in yellow in B. D. Immunoblot of Ccn6-KO cells transduced with pPGS vector or dnTCF4 and rescued with MYC-tagged wild type EZH2, ΔSET-EZH2, ΔNLS-EZH2, or vector. E. Cells in E were subjected to invasion (left) and adhesion (right) assays. Bars show mean of triplicate experiments ± SEM. *P < 0.05; **P < 0.005; ***P < 0.0005; ****P < 0.0001.
Figure 6.
Figure 6.. EZH2 methyltransferase activity inhibition reduces tumor growth and distant metastasis in Ccn6-KO mBrCA tumors.
A. Primary tumor growth curves of FVB mice orthotopically implanted with syngeneic Ccn6-KO cells expressing GFP-Luciferase treated with vehicle or with EZH2i (EPZ-6438/tazemetostat, daily i.p 120 μl / 30 gm of body weight, n=15 mice/condition) starting 24 h after orthotopic implantation. Primary tumor growth measured with caliper, shown as mean ± SEM. B. Kaplan-Meier plot of tumor-free survival of mice in A, as determined by the detection of palpable tumors. C. Representative histopathological images of the resected primary tumors at necropsy of mice treated with EZH2i or vehicle stained with H&E. At 20x magnification, arrowhead shows skeletal muscle invasion in a vehicle treated tumor, and an area of treatment effect in an EZH2i treated tumor (asterisk) (scale bar, 500 μm). At 400x, vehicle treated tumors display a spindle cell morphology which contrasts with the polygonal epithelial cell shape of EZH2i-treated tumors (scale bar, 100 μm). Bars quantify the number of mitoses per 10 high power fields, mean ± SEM. D. Representative images of orthotopic tumors immunostained for cytokeratin 18 (CK18), vimentin, and ZEB1. Bars: mean IHC score calculated using the percentage of positive cells and intensity of staining per 10 high power fields ± SEM. Scale bar, 100 μm. E. Representative bioluminescence images of distally disseminated Ccn6-KO cells expressing GFP-Luciferase injected intracardially in FVB mice, treated with EZH2i or vehicle (n=10 mice/condition) starting 24 h after injection. Images were obtained at the indicated timepoints after treatment initiation. Bars quantify metastatic burden assessed by measuring photon flux at the indicated timepoints using Live Image Pro. Data are presented as means ± SEM. *P < 0.05; **P < 0.005; ***P < 0.0005; ****P < 0.0001. F. Working model of CCN6 tumor suppressor function in mBrCA.

References

    1. Lehmann BD, Colaprico A, Silva TC, Chen J, An H, Ban Y, et al. Multi-omics analysis identifies therapeutic vulnerabilities in triple-negative breast cancer subtypes. Nat Commun. 2021;12(1):6276. - PMC - PubMed
    1. Abouharb S, and Moulder S. Metaplastic breast cancer: clinical overview and molecular aberrations for potential targeted therapy. Curr Oncol Rep. 2015;17(3):431. - PubMed
    1. Pang J, Toy KA, Griffith KA, Awuah B, Quayson S, Newman LA, et al. Invasive breast carcinomas in Ghana: high frequency of high grade, basal-like histology and high EZH2 expression. Breast Cancer Res Treat. 2012;135(1):59–66. - PMC - PubMed
    1. El Zein D, Hughes M, Kumar S, Peng X, Oyasiji T, Jabbour H, et al. Metaplastic Carcinoma of the Breast Is More Aggressive Than Triple-negative Breast Cancer: A Study From a Single Institution and Review of Literature. Clin Breast Cancer. 2017;17(5):382–91. - PMC - PubMed
    1. Luini A, Aguilar M, Gatti G, Fasani R, Botteri E, Brito JA, et al. Metaplastic carcinoma of the breast, an unusual disease with worse prognosis: the experience of the European Institute of Oncology and review of the literature. Breast Cancer Res Treat. 2007;101(3):349–53. - PubMed

MeSH terms

Substances