. 2024 Jul 18;9(16):e177229.
doi: 10.1172/jci.insight.177229.

Caspase-4/11 promotes hyperlipidemia and chronic kidney disease-accelerated vascular inflammation by enhancing trained immunity

Affiliations

Caspase-4/11 promotes hyperlipidemia and chronic kidney disease-accelerated vascular inflammation by enhancing trained immunity

Yu Sun et al. JCI Insight. .

Abstract

To determine whether hyperlipidemia and chronic kidney disease (CKD) have a synergy in accelerating vascular inflammation via trained immunity (TI), we performed aortic pathological analysis and RNA-Seq of high-fat diet-fed (HFD-fed) 5/6 nephrectomy CKD (HFD+CKD) mice. We made the following findings: (a) HFD+CKD increased aortic cytosolic LPS levels, caspase-11 (CASP11) activation, and 998 gene expressions of TI pathways in the aorta (first-tier TI mechanism); (b) CASP11-/- decreased aortic neointima hyperplasia, aortic recruitment of macrophages, and casp11-gasdermin D-mediated cytokine secretion; (c) CASP11-/- decreased N-terminal gasdermin D (N-GSDMD) membrane expression on aortic endothelial cells and aortic IL-1B levels; (d) LPS transfection into human aortic endothelial cells resulted in CASP4 (human)/CASP11 (mouse) activation and increased N-GSDMD membrane expression; and (e) IL-1B served as the second-tier mechanism underlying HFD+CKD-promoted TI. Taken together, hyperlipidemia and CKD accelerated vascular inflammation by promoting 2-tier trained immunity.

Keywords: Chronic kidney disease; Inflammation; Vascular biology; Vasculitis.


Figures

Figure 1
Figure 1. IL1B is positively correlated with chronic kidney disease (CKD) progression.
(A) The expression of IL1B was increased in the glomeruli of patients with CKD. (B) IL1B expression in kidneys was inversely correlated with glomerular filtration rates (GFR) (Pearson analysis). The data were extracted from human Glomeruli samples (199 samples) in the NephroSeq database. (C) High-fat diet-fed (HFD) 5/6 nephrectomy mouse model of CKD with sham controls and normal chow diet (ND) controls. (D and E) HFD resulted in hyperlipidemia/dyslipidemia but did not exacerbate IL1B levels in the kidney or impair kidney function. (D) Cholesterol levels in the plasma of HFD+CKD, HFD-sham, ND-CKD, and ND-sham mice (<100 was considered normal by The Jackson Laboratory). (E) LDL/VLDL levels in the plasma of HFD+CKD, HFD-sham, ND-CKD, and ND-sham mice (n = 3–4 per group). (F) Blood urea nitrogen (BUN) levels in the plasma of HFD+CKD, HFD-sham, ND-CKD, and ND-sham mice. BUN < 24 was considered normal based on Mayo Clinic criteria (n = 5 in ND-sham, n = 7 in ND-CKD and HFD-sham, n = 13 in HFD+CKD). (G) IL1B levels in the aorta of HFD+CKD, HFD-sham, ND-CKD, and ND-sham. Two-tailed Student’s t test was used in A; Pearson correlations were used in B. The Kruskal-Wallis test with Benjamini and Hochberg multiple-comparison method was used to control the overall FDR of 5% (DG).
Figure 2
Figure 2. The expression and activity of caspase-4 are positively associated with the progression of CKD-accelerated vascular inflammation.
(A) Casppase-1 (casp1) expression in the kidneys of patients with CKD compared with that of healthy donors. (B) Caspase-4 (CASP4) expression in the kidneys of patients with CKD compared with that of healthy donors. (C and D) CASP1 and CASP4 were negatively correlated with GFR (Pearson analysis). (E) The top 20 CASP4/Gasdermine D–related (GSDMD-related) secretion genes were significantly increased in patients with CKD (GSE66494). (F) The LPS level in the aorta of HFD+CKD, HFD-Sham, ND-CKD, and ND-Sham mice was detected by an ELISA kit (n = 4–6). (G) Casp11 activation scales in the HFD+CKD aorta were higher than those of CASP1. Western blot analysis of WT mouse aortic tissue for CASP1 and casp11. (H) Casp11 activities in the aorta of HFD+CKD, HFD-sham, ND-CKD, and ND-sham were detected by the casp4 activity assay. In total, 50 μg protein from each sample was used to detect casp11 activities (n = 4–6). (I) The proinflammatory cytokines in the plasma of HFD+CKD, HFD-sham, ND-CKD, and ND-sham were analyzed by cytokine array. Each sample was pooled from 3 mice in each group (n = 3). ImageJ was used to quantify the bands, and the significantly changed proteins were indicated. Two-tailed Student’s t test was used in A and B. Pearson correlations were used in C and D. The Kruskal-Wallis test with Benjamini and Hochberg multiple-comparison method was used to control the overall FDR of 5% (F, H, and I). *P < 0.05.
Figure 3
Figure 3. Caspase-11 deficiency decrease the formation of neointima in aortas of HFD+CKD mice.
(A) Volcano plot analysis of bulk RNA-Seq data showed the significantly modulated genes in casp11–/– CKD+HFD compared with WT CKD+HFD. Green number is original software generated data indicating 120 downregulated genes. (B) Ingenuity Pathway Analysis (IPA) of upregulated pathways in casp11–/– CKD+HFD upregulated genes compared with WT CKD+HFD upregulated genes. (P < 0.05, Z score < –1). (C) The Verhoeff–van Gieson stain of mouse aorta showed that HFD+CKD increased neointima area and the ratios of neointima/media in WT aortas, which were significantly suppressed in casp11–/– HFD+CKD aortas. (DF) The quantifications of neointima, media, and neointima/media. The Kruskal-Wallis test with Benjamini and Hochberg multiple-comparison method was used to control the overall FDR of 5% (DF).
Figure 4
Figure 4. Caspase-11 deficiency inhibits inflammatory cell infiltration into the aortas of HFD+CKD mice.
(A and B) Flow cytometry analysis demonstrated that HFD+CKD increased the recruitment of CD45+CD11b+ monocytes and CD45+CD11b+F4/80+ macrophages into the WT aorta, which were significantly suppressed in HFD+CKD casp11–/– aortas. (C and D) Flow cytometry analysis demonstrated that casp11–/– decreased blood CD45+CD11b+ monocytes in HFD-sham mice compared with WT HFD-sham mice; and HFD+CKD mice did not significantly change blood CD45+CD11b+ monocytes and CD45+CD11b+F4/80+ macrophages in HFD+CKD mice (n = 6–8). Flow cytometry analysis showed the infiltrated monocytes (CD11b+CD45+) and macrophages (CD11b+CD45+F4/80+) in the blood of WT and casp11–/– HFD+CKD and HFD-Sham mice. (E) Cytokine array showed that casp11–/– decreased HFD+CKD-induced chemokines and cytokines, including CCL2 and CCL22, MMP-3, chinitianase 3-like 1 (CHIL3L1), IL-12p40, myeloperoxidase, TNFRSF11b, and PCSK9 in plasma. Each sample was pooled from 3 mice in each group (n = 3). ImageJ was used to quantify the bands, and the significantly changed proteins were indicated. The Kruskal-Wallis test with Benjamini and Hochberg multiple-comparison method was used to control the overall FDR of 5% (AE).
Figure 5
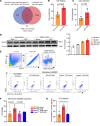
Figure 5. Caspase-11 deficiency decreases the cleavage of N-GSDMD in the aortas of HFD+CKD mice.
(A) Five endothelial cell activation genes were identified in Venn diagram of 584 significantly downregulated genes in casp11–/– aortas and 1,311 endothelial cell activation genes identified in the literature (P < 0.05, log2FC < –1). (B and C) Intravital microscopy was used to examine peripheral blood cell rolling and adhesion in the cremaster muscle vein in male mice (n = 4–6). (D) Western blot analysis showed that HF+CKD increased the expression of endothelial cell adhesion molecule VCAM-1 in aortas compared with CKD and HFD-sham controls, suggesting that HFD+CKD activates aortic endothelial cells. (E) Flow cytometry gating analysis was used on mouse aorta cells to examine membrane GSDMD expression (n = 3–4). (F) Quantification of N-GSDMD expression was performed in endothelial cells (CD45CD31+) in WT and casp11–/– HFD+CKD and HFD-Sham mouse aortas. (G) IL-1β secretion in the aorta of WT and casp11–/– HFD+CKD and HFD-Sham mice were quantified by ELISA. The Mann Whitney U test was used in B and C. The Kruskal-Wallis test with Benjamini and Hochberg multiple-comparison method was used to control the overall FDR of 5% (F and G).
Figure 6
Figure 6. Cytosolic LPS is increased in the aorta of HFD+CKD and activates the casp4/11-GSDMD pathway.
(A) The expression of LPS endocytic protein HMGB1 was increased in the kidneys of patients with CKD. (B) The expression of HMGB1 was negatively correlated with GFR (GSE9493, GSE66494). (C and D) The LPS-FITC (2 μg/mL) was transfected into human aortic endothelial cell (HAECs) using FuGENE for 16 hours. The transfection efficiency was detected by flow cytometry (D) and verified by visualization with confocal microscopy images (C) (40× magnification). (E and F) HAECs were treated with blank control, direct LPS stimulation (2 μg/mL), LPS transfection (2 μg/mL), and transfection control. The activity of casp4 (E) and cleavage of N-GSDMD (F) were examined by FLICA and flow cytometry. (G) The secretion of IL-1β in the supernatant was determined by ELISA. (H) The design of a new competitive inhibitor of GSDMD cleavage. (I and J) The inhibition efficiency detection of GSDMD peptide inhibitor (4 μM) was examined by flow cytometry (n = 6). (K) The secretion of IL-1β via the N-GSDMD protein channel into the supernatant of LPS-transfected HAECs was detected in the presence and absence of GSDMD cleavage inhibitor by ELISA (n = 3). (L) The expression of adhesion molecule VCAM-1 was measured by flow cytometry in the LPD, LPS transfection, and LPS transfection after the addition of different concentrations of GSDMD inhibitor. Two-tailed Student’s t test was used in A. Pearson correlations were used in B. The Kruskal-Wallis test with Benjamini and Hochberg multiple-comparison method was used to control the overall FDR of 5% (DG and JL).
Figure 7
Figure 7. Cytosolic LPS-activated caspase-4 promotes human aortic endothelial cell activation via the caspase-4/GSDMD pathway.
(A) HAECs were treated with CKD-related gut microbiota generated uremic toxin indoxyl sulfate (250 μM), palmitic acid (250 μM), and LPS transfection (2 μg/mL) for 4 hours. The expression of VCAM-1 was examined by flow cytometry (n = 3). (B) The expression of adhesion molecule VCAM-1 was measured by flow cytometry in the presence or absence of a casp4 inhibitor (50 μM). The Kruskal-Wallis test with Benjamini and Hochberg multiple-comparison method was used to control the overall FDR of 5% (A and B).
Figure 8
Figure 8. Mitochondrial ROS (mitoROS) generation is increased by cytosolic LPS, mitoROS promotes the caspase-4/GSDMD pathway, and casp4/GSDMD also promotes mitoROS generation.
(A) In total, 165 ROS regulator genes from GSEA were screened in WT aorta RNA-Seq data and casp11–/– CKD+HFD aorta RNA-Seq data. (B) The mitoROS level was detected using mitoSOX (5 μM) in LPS-transfected HAECs in the presence or absence of a GSDMD cleavage inhibitor (8 μM). (CE) Casp4 activity (C). The expression levels of N-GSDMD (D) and adhesion molecule VCAM-1 (E) were detected in LPS-transfected HAECs in the presence or absence of mitoROS inhibitor mitoTempo (1 μM) using flow cytometry. The Kruskal-Wallis test with Benjamini and Hochberg multiple-comparison method was used to control the overall FDR of 5% (BE).
Figure 9
Figure 9. IL-1β released via caspase-4/N-GSDMD protein pores serves as the second step of HFD+CKD-promoted trained immunity, promotes trained immunity gene expression, and enhances caspase-4/11–induced VCAM-1 expression and IL-1β secretion in HAECs.
(A) Volcano plot analysis of bulk RNA-Seq data shows the differentially expressed genes in HFD+CKD versus HF and HFD+CKD versus CKD. (B) Venn diagram of upregulated genes in HFD+CKD versus HFD and HFD+CKD versus CKD and 101 trained immunity genes. (CE) Venn diagram showed the common shared genes between 125 IL-1β–upregulated genes and 101 trained immunity genes (C), 266 immunometabolism genes (D), and 1,223 casp4/11-dependent secrotomes (E). (F and G) VCAM-1 expression (F) and IL-1β secretion (G) were examined in LPS-transfected HAECs in the presence and absence of IL-1Ra (10 μM) (n = 3). Each experiment was repeated 3 times. The Kruskal-Wallis test with Benjamini and Hochberg multiple-comparison method was used to control the overall FDR of 5% (F and G).
Figure 10
Figure 10. Our working model.
HFD+CKD (UTs) promote extracellular LPS enter aortic cell cytosol, increase intracellular gram-negative bacterial infections in CKD, increase intracellular crystallization of CKD-elevated palmitic acid, activate casp4/11 and N-GSDMD membrane expression, increase secretion of IL-1β and other casp11-GSDMD secretome, and upregulate TI genes in aortic cells; after sensing intracellular LPS, palmitic acid stimulation, and UT indoxyl sulfate stimulation, casp11 gets activated and cleaves N-GSDMD and promotes N-GSDMD membrane expression in aortic endothelial cells.

References

    1. Levey AS, et al. National Kidney Foundation practice guidelines for chronic kidney disease: evaluation, classification, and stratification. Ann Intern Med. 2003;139(2):137–147. doi: 10.7326/0003-4819-139-2-200307150-00013. - DOI - PubMed
    1. Jankowski J, et al. Cardiovascular disease in chronic kidney disease: pathophysiological insights and therapeutic options. Circulation. 2021;143(11):1157–1172. doi: 10.1161/CIRCULATIONAHA.120.050686. - DOI - PMC - PubMed
    1. Wong J, et al. Beta-glucans in advanced CKD: role in endotoxaemia and inflammation. BMC Nephrol. 2020;21(1):118. doi: 10.1186/s12882-020-01779-9. - DOI - PMC - PubMed
    1. McIntyre CW, et al. Circulating endotoxemia: a novel factor in systemic inflammation and cardiovascular disease in chronic kidney disease. Clin J Am Soc Nephrol. 2011;6(1):133–141. doi: 10.2215/CJN.04610510. - DOI - PMC - PubMed
    1. Jefferies HJ, et al. Circulating endotoxaemia and frequent haemodialysis schedules. Nephron Clin Pract. 2014;128(1-2):141–146. doi: 10.1159/000366519. - DOI - PubMed

MeSH terms

LinkOut - more resources