. 2024 Jul 18;9(16):e180907.
doi: 10.1172/jci.insight.180907.

Transcriptome and microbiome-immune changes across preinvasive and invasive anal cancer lesions

Affiliations

Transcriptome and microbiome-immune changes across preinvasive and invasive anal cancer lesions

Ezequiel Lacunza et al. JCI Insight. .

Abstract

Anal squamous cell carcinoma (ASCC) is a rare gastrointestinal malignancy linked to high-risk human papillomavirus (HPV) infection, which develops from precursor lesions like low-grade squamous intraepithelial lesions and high-grade squamous intraepithelial lesions (HGSILs). ASCC incidence varies across populations and poses increased risk for people living with HIV. Our investigation focused on transcriptomic and metatranscriptomic changes from squamous intraepithelial lesions to ASCC. Metatranscriptomic analysis highlighted specific bacterial species (e.g., Fusobacterium nucleatum, Bacteroides fragilis) more prevalent in ASCC than precancerous lesions. These species correlated with gene-encoding enzymes (Acca, glyQ, eno, pgk, por) and oncoproteins (FadA, dnaK), presenting potential diagnostic or treatment markers. Unsupervised transcriptomic analysis identified distinct sample clusters reflecting histological diagnosis, immune infiltrate, HIV/HPV status, and pathway activities, recapitulating anal cancer progression's natural history. Our study unveiled molecular mechanisms in anal cancer progression, aiding in stratifying HGSIL cases based on low or high risk of progression to malignancy.

Keywords: Bioinformatics; Cell biology; Expression profiling; Molecular biology; Oncology.


Conflict of interest statement

Conflict of interest: The authors have declared that no conflict of interest exists.

Figures

Figure 1
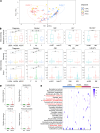
Figure 1. Richness, diversity, and microbial profile of LGSIL, HGSIL, and ASCC.
(A) Principal coordinate analysis depicting the unsupervised distribution of samples, assessed at the species level based on microbiota composition and evaluated through Euclidean distance. (B) β-Diversity comparison between diagnosis groups and covariates. (C) Observed and Chao1 richness indices obtained at species level by metatranscriptome analysis. (D) Significantly altered phyla Fusobacteriota, Bacteroidota, Bacillota, and Pseudomonadota were related to ASCC. Statistical significance was calculated with Wilcoxon’s signed-rank test. (E) Heatmap representation of the relative abundances of the most abundant bacterial species identified across all samples. Highlighted in red are the taxa significantly enriched in ASCC compared with SIL obtained by MaAsLin2 analysis. *P < 0.05; **P < 0.01; ***P < 0.001.
Figure 2
Figure 2. Viral composition of LGSIL, HGSIL, and ASCC.
(A) Relative abundance heatmap showing the most prevalent viral species identified in the diagnosis groups using metatranscriptome analysis (RNA level). (B) Alpha-PV-10 was found to be linked to the SIL group, whereas Alpha-PV-9 and Alpha-PV-7 were associated with ASCC. Statistical significance was derived from MaAsLin2 analysis. (C) Percentage of patients with detectable viruses of the species Alpha-PV-10, -9, and -7 assessed by metatranscriptome analysis. (D) Heatmpa visualizing the HPV types identified through DNA genotyping across the different diagnosis groups. (E) Percentage distribution of HPV types, assessed by DNA genotyping and classified into low-risk (LR) and high-risk (HR) categories. (F) Percentage of patients in each diagnostic group with detectable LR- and HR-HPV types identified through DNA genotyping. Statistical significance was determined through application of Fisher’s exact test. **P < 0.01; ***P < 0.001.
Figure 3
Figure 3. Functional and taxonomic enrichment of microbial gene proteins associated with anal lesions.
(A) Heatmap representation of metabolic pathways enriched in ASCC compared with SILs represented by 60 gene proteins contributed by relevant gut microbiota taxa, of which F. nucleatum, B. fragilis, and C. ureolyticus are predominant. (B) Viral proteins identified as differentially abundant in ASCC relative to SILs contributed by high-risk and low-risk HPV.
Figure 4
Figure 4. Differential gene expression analysis and functional enrichment of transcriptomic data.
(A) Unsupervised hierarchical clustering of samples classified according to diagnosis groups. (B and C) Volcano plots representing significant DEGs (logFC > 1, adj P < 0.05) from the comparisons between LGSIL and HGSIL (B) and between HGSIL and ASCC (C). Upregulated genes are indicated by red arrowheads, while downregulated genes are indicated by blue arrowheads. The top 20 significant genes are shown. (DG) Dot plots of GSEA obtained from the comparisons between LGSIL and HGSIL (D and E) and between HGSIL and ASCC (F and G). (D) Dot plot of significantly activated and suppressed GO pathways in HGSIL compared with LGSIL. (E) Dot plot of significantly activated and suppressed Hallmarks of Cancer in HGSIL compared with LGSIL. (F) Dot plot of significantly activated and suppressed GO pathways in ASCC compared with HGSIL. (G) Dot plot of significantly activated and suppressed Hallmarks of Cancer in ASCC compared with HGSIL.
Figure 5
Figure 5. Heatmaps illustrating the expression profiles of gene signatures across diagnostic groups: LGSIL, HGSIL, and ASCC.
(A) Epidermal differentiation signature. (B) Immune signature. (C) Cell cycle signature. The color coding bar at the bottom of each heatmap indicates the score (high or low) assigned to each sample based on the average expression of the gene signature divided by the median value.
Figure 6
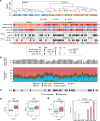
Figure 6. Integrative analysis of host transcriptome of LGSIL, HGSIL, and ASSC.
(A) Tile plot illustrating signature scores, HPV status, and HIV status of samples distributed according to the unsupervised clustering analysis. Statistical significance was determined through the application of Fisher’s exact test. (B) Immune profiling and cell fraction composition for each sample using ESTIMATE and EPIC, respectively. (C) T cell dysfunction and exclusion (TIDE) score for each sample. Statistical significance was determined through the application of Fisher’s exact test. (D) Relative mRNA abundance of CDKN2A (p16) and MKI67 (Ki67) across samples in cluster I versus cluster II. (E) Comparative analysis of clusters for age and gender. Statistical significance was determined through the application of a t test for age and χ2 test for gender. *P < 0.05; **P < 0.01; ***P < 0.001.
Figure 7
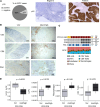
Figure 7. Comprehensive analysis of p16+, CD3+, and CD8+ TILs’ density and PD-L1 expression in the tumor microenvironment of ASCC.
(A) Immunohistochemistry (IHC) results of p16 in 10 ASCC cases. Microphotographs represent negative and diffusely positive p16 staining on ASCC (original magnification, ×10). (B) Representative IHC results depicting high and low expression levels of CD3, CD8, and PD-L1. (C) Tile plot illustrating ASCC samples analyzed by IHC, showcasing scores for immune signature; CD3, CD8, and PD-L1 IHC results; along with EPIC cell fractions. (D) Box plots comparing tumor purity, CAFs, and macrophage levels, as obtained by EPIC, between tumors with low (n = 8) and high (n = 6) CD3+/CD8+ TILs. Statistical significance was calculated with Wilcoxon’s signed-rank test.
Figure 8
Figure 8. Comparative analysis of gene signature expression patterns and enriched pathways in HNSCC, cervical lesions, and anal lesions.
(A) Heatmap visualization of HNSCC gene signature across our sample cohort, grouped by immune score within each diagnosis category. Additionally, the epidermal differentiation score is displayed. (B) Heatmap visualization of the ASCC gene signature expression profile in HNSCC samples organized by subtype classification according to Zhang et al., 2016 (48). (C) Heatmap visualization of CSCC gene signature across our sample cohort grouped by immune score within each diagnosis category. (D) Heatmap visualization of the ASCC gene signature across cervical lesions, arranged in ascending order based on the immune gene profile within each diagnosis category.
Figure 9
Figure 9. Mutational profiles among squamous cell carcinomas.
(A) Tile plot of the most prevalent somatic cancer driver mutations identified in 23 ASCC cases through transcriptome-based sequencing. The upper color-coded bars provide an indication of the immune signature score and HR-HPV status for each respective sample. On the left bar plot, the proportions of somatic mutations within each group are presented, relative to the total number of cases in that specific group. TSG, tumor suppressor gene. (B) Comparative frequency of the mutations identified in the ASCC cohort with respect to CSCC and HNSCC retrieved from the TCGA cohorts.

References

    1. Clifford GM. et al. A meta-analysis of anal cancer incidence by risk group: toward a unified anal cancer risk scale. Int J Cancer. 2021;148(1):38–47. doi: 10.1002/ijc.33185. - DOI - PMC - PubMed
    1. Darragh TM, et al. The lower anogenital squamous terminology standardization project for HPV-associated lesions: background and consensus recommendations from the College of American Pathologists and the American Society for Colposcopy and Cervical Pathology. Arch Pathol Lab Med. 2012;136(10):1266–1297. doi: 10.5858/arpa.LGT200570. - DOI - PubMed
    1. Berry JM, et al. Progression of anal high-grade squamous intraepithelial lesions to invasive anal cancer among HIV-infected men who have sex with men. Int J Cancer. 2014;134(5):1147–1155. doi: 10.1002/ijc.28431. - DOI - PubMed
    1. Hoots BE, et al. Human papillomavirus type distribution in anal cancer and anal intraepithelial lesions. Int J Cancer. 2009;124(10):2375–2383. doi: 10.1002/ijc.24215. - DOI - PubMed
    1. de Martel C, et al. Worldwide burden of cancer attributable to HPV by site, country and HPV type. Int J Cancer. 2017;141(4):664–670. doi: 10.1002/ijc.30716. - DOI - PMC - PubMed

MeSH terms