. 2024 Jul 18;134(17):e175217.
doi: 10.1172/JCI175217.

Notch signaling suppresses neuroendocrine differentiation and alters the immune microenvironment in advanced prostate cancer

Affiliations

Notch signaling suppresses neuroendocrine differentiation and alters the immune microenvironment in advanced prostate cancer

Sheng-Yu Ku et al. J Clin Invest. .

Abstract

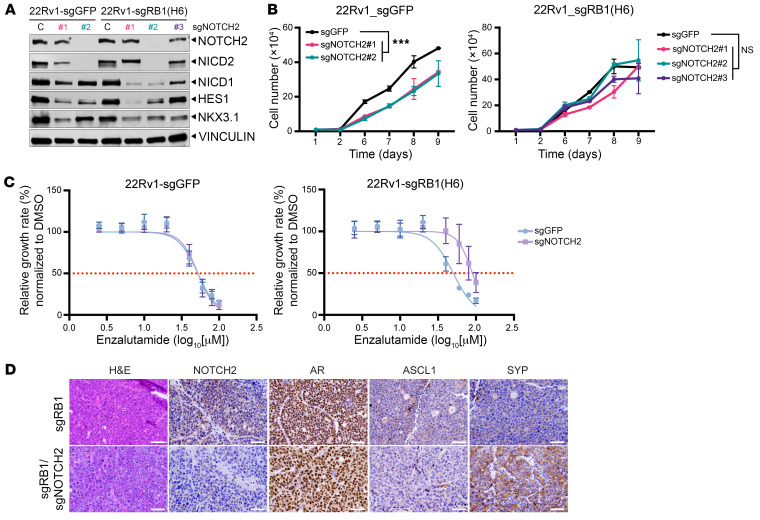
Notch signaling can have either an oncogenic or tumor-suppressive function in cancer depending on the cancer type and cellular context. While Notch can be oncogenic in early prostate cancer, we identified significant downregulation of the Notch pathway during prostate cancer progression from adenocarcinoma to neuroendocrine (NE) prostate cancer, where it functions as a tumor suppressor. Activation of Notch in NE and Rb1/Trp53-deficient prostate cancer models led to phenotypic conversion toward a more indolent, non-NE state with glandular features and expression of luminal lineage markers. This was accompanied by upregulation of MHC and type I IFN and immune cell infiltration. Overall, these data support Notch signaling as a suppressor of NE differentiation in advanced prostate cancer and provide insights into how Notch signaling influences lineage plasticity and the tumor microenvironment (TME).

Keywords: Oncology; Prostate cancer.


Figures

Figure 1
Figure 1. Notch signaling activity during prostate cancer progression.
(A) Expression of the 19-gene Notch signaling mRNA score. Representative cases of CRPC-Adeno PCa (n = 2) and NEPC (n = 2) are shown. Expression levels were Z transformed. (B) The Notch score was significantly lower in NEPC (n = 22) than in hormone-naive PCa (n = 68) or CRPC-Adeno (n = 31) in the Beltran data set (35). ****P < 0.0001, by 1-way ANOVA. (C) Clinical specimens of PCa, CRPC-Adeno PCa, and NEPC were stained for protein expression of NOTCH2, HES1, and DLL3. Scale bars: 200 μm. Original magnification, ×10 (NOTCH2, HES1); ×40 (DLL3) (insets). (D) Spearman’s correlation analysis of the Notch signaling and NEPC scores showed a significant negative correlation in the Beltran data set (r = –0.4427, ****P < 0.0001) (35). (E) SKO, DKO, agnd TKO GEMM tumors were stained for NOTCH2, HES1, KRT8, and SYP. Scale bars: 50 μm. (F) Notch signaling score in the indicated GEMMs. **P < 0.01 and ****P < 0.0001, by 1-way ANOVA (SKO vs. DKO, SKO vs. TKO). (G) The Notch signaling and NEPC scores were negatively correlated in GEMMs (Spearman’s r = –0.5537, P = 0.0027).
Figure 2
Figure 2. Evaluation of DKO-Nicd1 and TKO-Nicd1 GEMMs.
(A) Schematic of DKO-Nicd1 and TKO-Nicd1 GEMMs. Both Nicd1 and EGFP are expressed when the lox-STOP-lox cassette is deleted by probasin-driven Cre recombination. (B) Survival of TKO and TKO-Nicd1 mice. The median survival was 15 weeks for TKO-Nicd1 mice and 16 weeks for TKO mice (log-rank P = 0.025). (C) Ratio of GU weight/body weight of TKO and TKO-Nicd1 mice. TKO-Nicd1 mice had a significantly lower GU weight/body weight ratio (P < 0.01, by 2-tailed t test). (D) End-stage TKO and TKO-Nicd1 tumors were immunostained for the indicated proteins. TKO tumors expressed SYP and had reduced levels of HES1 and AR. TKO-Nicd1 tumors could be either NE or non-NE phenotypes. Scale bars: 50 μm. (E) Percentage of SYP+ tumor area in the indicated genotypes of end-stage mice. TKO-Nicd1 mice had significantly smaller SYP+ areas than did TKO mice (P < 0.01, by Mann-Whitney U test). (F) The doubling time of tumor growth was calculated using a nonlinear regression method, which showed that TKO-Nicd1 mice had a significantly longer doubling time than did TKO mice (P < 0.01, by Mann-Whitney U test).
Figure 3
Figure 3. Restoration of Notch signaling in human NEPC models.
(A) Bright-field images of WCM154-DEST (control) and fNICD2-#1 organoids. The size of an organoid was determined by its diameter on day 12. Ten images were taken from each WCM154-DEST and fNICD2-#1 organoid per biological duplicate, with 3 replicates in total. One or 2 organoids were measured per image. Each dot represents the size of 1 organoid (DEST: n = 44; fNICD2-#1: n = 47). ****P < 0.0001, by 2-tailed t test. Scale bars: 50 μm. (B) Immunostaining of WCM154-DEST and fNICD2-#1 organoids for HES1, KRT8, and CHGA. Scale bars: 50 μm. (C) fNICD2 expression was induced upon doxycycline treatment after 24 hours in WCM154-DOX-fNICD2 organoids, but not in DOX-RFP (control) organoids. Doxycycline-treated WCM154-DOX-fNICD2 organoids show increased HES1 and decreased SYP, INSM1, and FOXA2 levels. (D) WCM154-DEST and fNICD2-#1 organoids were implanted subcutaneously, and tumor volume measurements were initiated at 100 mm3 (n = 3 per group). The relative tumor size was normalized to day 1. ****P < 0.0001, by 2-way ANOVA. Data represent the mean ± SD. (E) H&E staining shows glandular like and luminal differentiation in fNICD2-#1 tumors indicated by arrows. Scale bars: 50 μm. (F) fNICD2-#1 tumor exhibits reduced levels of DLL3, INSM1, and SYP but increased KRT8 levels. Scale bars: 50 μm.
Figure 4
Figure 4. Notch signaling induces distinct lineages in human NEPC models.
(A) Immunofluorescence staining of a fNICD2-#1 tumor for SYP (green), KRT8 (red), INSM1 (magenta), and DNA (blue). Three distinct lineages are highlighted by dashed lines. The NE lineage is labeled as SYP+INSM1+KRT8; the transition lineage is labeled as SYP+INSM1KRT8+; the luminal lineage is labeled as SYPINSM1KRT8+. Scale bars: 50 μm. (B) PCA differentiated transcriptomes of DEST tumors, NE, and transitional and luminal lineages of fNICD2-#1 tumors. (C) The Notch signaling and (D) NEPC signature scores were calculated for DEST and fNICD2-#1 tumors. **P < 0.01 and ****P < 0.0001, by one-way ANOVA. (E) Spearman’s correlation analysis showed a negative correlation between the Notch signaling score and the NEPC signature score (r = –0.6733, P < 0.0001). (F). Volcano plot indicates genes differentially expressed between the NE and luminal lineages within fNICD2-#1 tumors. (G) WCM154-DEST and fNICD2-#1 tumors were stained for the luminal markers PSCA and PIGR to confirm that fNICD2-#1 increased the expression of luminal markers. Scale bars: 50 μm.
Figure 5
Figure 5. AR signaling in the WCM154-CMV-fNICD2 model.
(A) AR signature scores were calculated in DEST tumor and NE, transitional, and luminal lineages of fNICD2-#1 tumors. *P < 0.05 and ***P < 0.001, by 1-way ANOVA. (B) DEST and fNICD2-#1 tumors were assessed for AR and SYP expression. Mouse prostate epithelial cells were used as an internal control to indicate positive nuclear AR staining and negative SYP staining. Scale bars: 50 μm. (C) DEST and fNICD2-#1 tumors were subcutaneously implanted into male mice. When tumor size reached approximately 100 mm3, half of the mice were surgically castrated. Tumor size was measured on the indicated days (n = 4–5 per group). A 2-way ANOVA was performed to test for significant differences between intact (AS) and castrated (Cx) mice for both DEST and fNICD2-#1. (D) Histology of intact and castrated DEST and fNICD2-#1 tumors. Scale bars: 100 μm.
Figure 6
Figure 6. Deletion of ASCL1 in the WCM154 model.
(A) Relative mRNA levels of ASCL1, DLL3, and NOTCH2 in WCM154-sgGFP, -sgASCL1-#1, and -sgASCL1-#2 organoids are shown. Standard deviations were measured from 3 independent replicates. (B) Growth of WCM154-sgGFP (control) and WCM154-sgASCL1 organoids was measured by CellTiter-Glo at the indicated time points and normalized to day 1. The data are from 3 biological replicates and represent the mean ± SD. ****P < 0.0001, by 2-way ANOVA. (C) Expression levels of Notch signaling markers (NOTCH2, HES1) and NE markers (INSM1, FOXA2, SYP) in ASCL1-KO organoids. (D) Histology of sgGFP and sgASCL1 organoid–derived xenografts. Tumor sections were stained with the Notch negative regulators ASCL1 and DLL3 and the positive regulators NOTCH2 and HES1 to indicate upregulated Notch signaling in the WCM154-sgASCL1 tumor. Scale bars: 100 μm. (E) Differential gene expression in sgASCL1 versus sgGFP tumors. Several NE transcription factors, such as INSM1 and PEG10, were downregulated in the sgASCL1 tumors. (F) GO analysis reveals enriched biological processes after ASCL1 KO.
Figure 7
Figure 7. Deletion of NOTCH2 in 22Rv1 cells in combination with RB1 loss.
(A) NOTCH2, NICD1, NICD2 and HES1 expression levels were reduced in 22Rv1-sgNOTCH2 cells. The NE markers INSM1 and CHGA were undetectable in control (C) and NOTCH2-KO cells. (B) The growth of NOTCH2-KO 22Rv1 cells with (22Rv1-sgGFP) and without RB1 (22Rv1-sgRB1) was measured using a hemacytometer. Data are from 4 technical replicates and 2 biological replicates and represent the mean ± SD. ***P < 0.001, by 2-way ANOVA. (C) 22Rv1 cells with or without RB1 and NOTCH2 loss were treated with DMSO (control) or enzalutamide with the indicated concentrations for 6 days. Relative cell growth was measured by CellTiter-Glo on day 6 and normalized to DMSO. The IC50 was determined using GraphPad and is shown on the graph. 22Rv1-sgGFP: 52.1 μM; 22Rv1-sgRB1/sgNOTCH2: 89.8 μM. The data are from 3 biological replicates with multiple technical replicates and represent the mean ± SD. (D) 22Rv1-sgRB1 and 22Rv1-sgRB1/sgNOTCH2 cells were subcutaneously transplanted into host mice. Tumors were stained with H&E, NOTCH2, AR, ASCL1, and SYP to characterize the phenotypes. Scale bars: 100 μm.
Figure 8
Figure 8. Notch-mediated prostate cancer lineage state influences the tumor immune microenvironment.
(A) Prostate tissue from SKO (n = 3; 18,622 cells), TKO (n = 6; 19,485 cells), and TKO-Nicd1 (n = 4; 19,253 cells) GEMMs or TKO (TKO.TrPl, n = 2; 11,918 cells) and TKO-Nicd1 (TKO-Nicd1.TrPl, n = 2; 11,691 cells) transplant tumors were analyzed by scRNA-Seq, and the cells were clustered by transcriptional profile. The clusters are color coded on the basis of cell type as determined by the expression of cell-type–specific gene expression markers. UMAP, uniform manifold approximation and projection; prolif., proliferating. (B) The cell-type clusters are displayed for each genotype to compare relative cell-type composition of the samples. (C) Normalized expression of IFN/inflammatory (Ifitm1, Ckap4) and MHC genes (B2m, H2-K1) in neoplastic cells from TKO and TKO-Nicd1 GEMMs was determined by scRNA-Seq (Supplemental Figure 15D). Wilcox tests were used to assess differences between genotypes, and the P values are shown. (D) The proportion of immune cell subtypes detected within TKO and TKO-Nicd1 prostate tissue was calculated from scRNA-Seq data. A 2-tailed t test was used to assess the differences observed, the P values are shown. (E) Volcano plots depicting genes differentially expressed between NE and non-NE lineages developing in fNICD2-#1 transplant tumors. MHC-I genes (HLA-A, -B, -E, and -F) and B2M are highlighted, showing upregulation in non-NE cells. (F) A fNICD2-#1 transplant tumor section immunostained for HLA-ABC demonstrates upregulation at the protein level in cells with a non-NE lineage phenotype. Scale bar: 100 μm. (G) GSEA was performed using the spatial transcriptomics data in the luminal lineage, and type I IFN responses were identified. (H) Schematic of Notch signaling in NEPC. Notch signaling suppresses NE differentiation, drives non-NE lineage differentiation, and influences the immune microenvironment. Mon, monocytes; Mac, macrophages.

References

    1. Hanahan D. Hallmarks of cancer: new dimensions. Cancer Discov. 2022;12(1):31–46. doi: 10.1158/2159-8290.CD-21-1059. - DOI - PubMed
    1. Le Magnen C, et al. Lineage plasticity in cancer progression and treatment. Annu Rev Cancer Biol. 2018;2:271–289. doi: 10.1146/annurev-cancerbio-030617-050224. - DOI - PMC - PubMed
    1. Quintanal-Villalonga A, et al. Lineage plasticity in cancer: a shared pathway of therapeutic resistance. Nat Rev Clin Oncol. 2020;17(6):360–371. doi: 10.1038/s41571-020-0340-z. - DOI - PMC - PubMed
    1. Aggarwal R, et al. Clinical and genomic characterization of treatment-emergent small-cell neuroendocrine prostate cancer: a multi-institutional prospective study. J Clin Oncol. 2018;36(24):2492–2503. doi: 10.1200/JCO.2017.77.6880. - DOI - PMC - PubMed
    1. Beltran H, et al. The role of lineage plasticity in prostate cancer therapy resistance. Clin Cancer Res. 2019;25(23):6916–6924. doi: 10.1158/1078-0432.CCR-19-1423. - DOI - PMC - PubMed

MeSH terms