. 2024 Jul 18;134(18):e179472.
doi: 10.1172/JCI179472.

TWIST1+FAP+ fibroblasts in the pathogenesis of intestinal fibrosis in Crohn's disease

Affiliations

TWIST1+FAP+ fibroblasts in the pathogenesis of intestinal fibrosis in Crohn's disease

Yao Zhang et al. J Clin Invest. .

Abstract

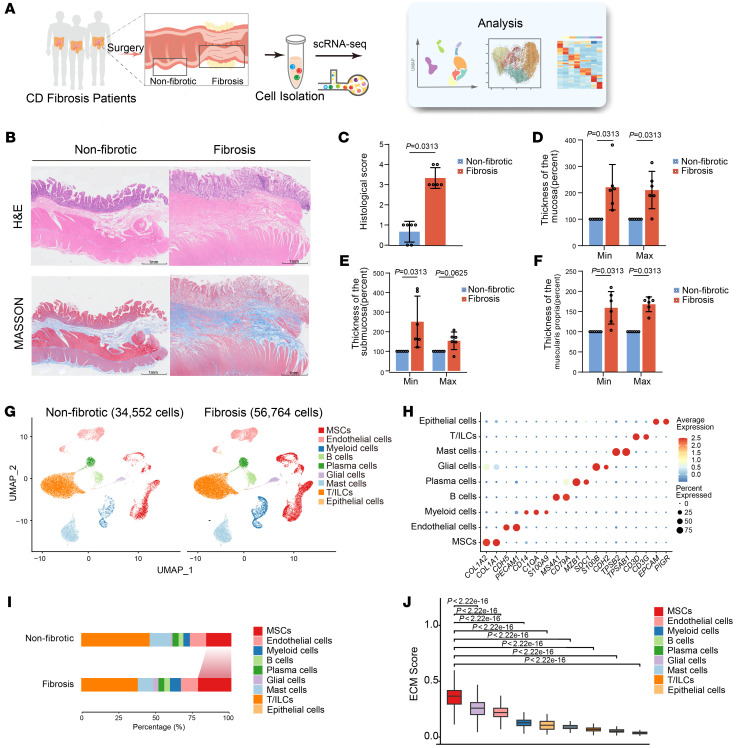
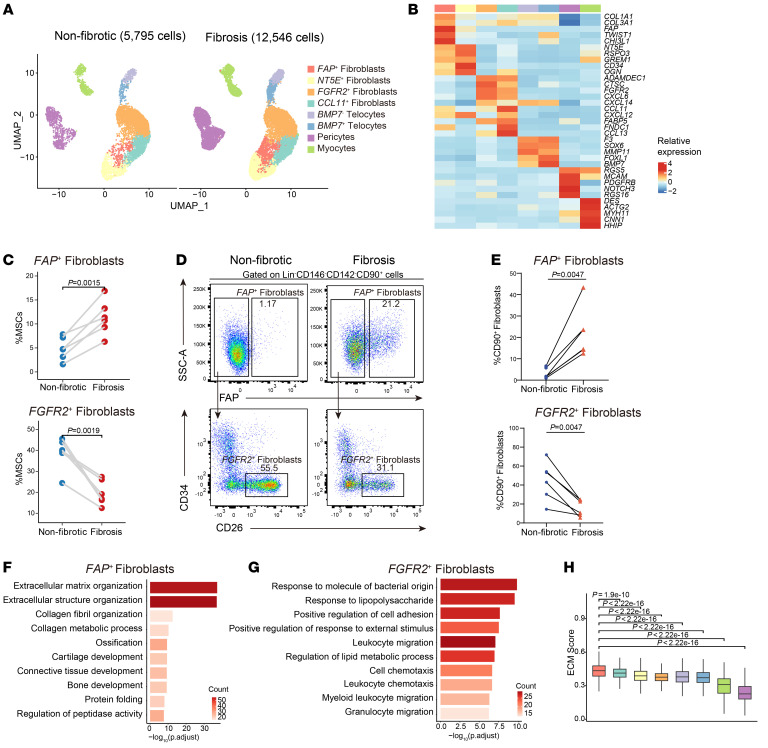
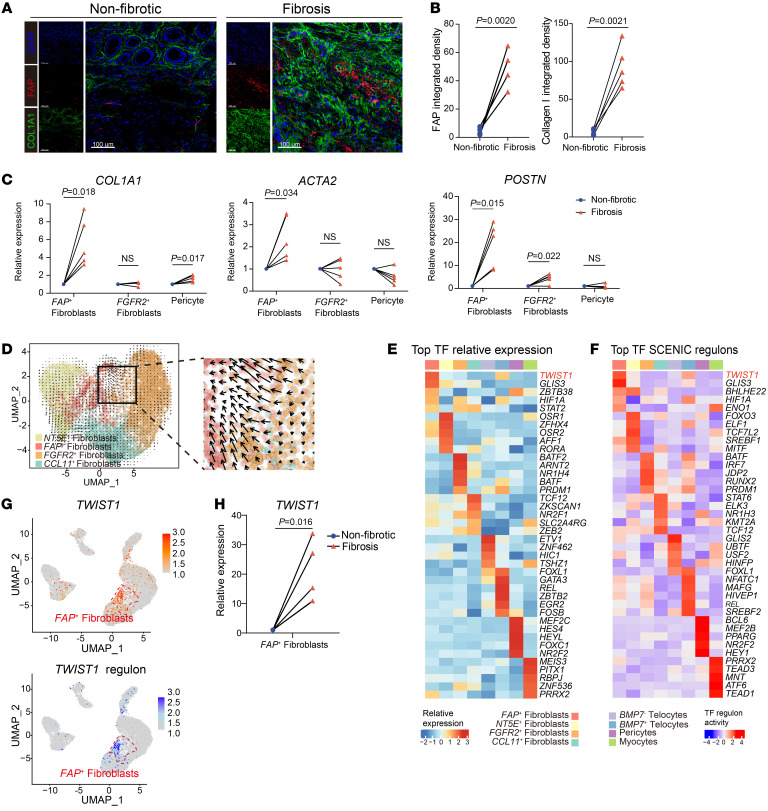
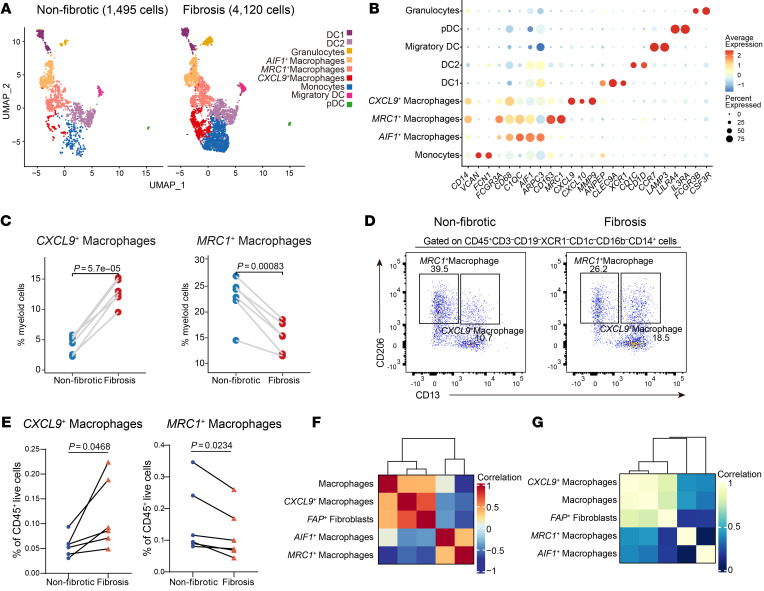
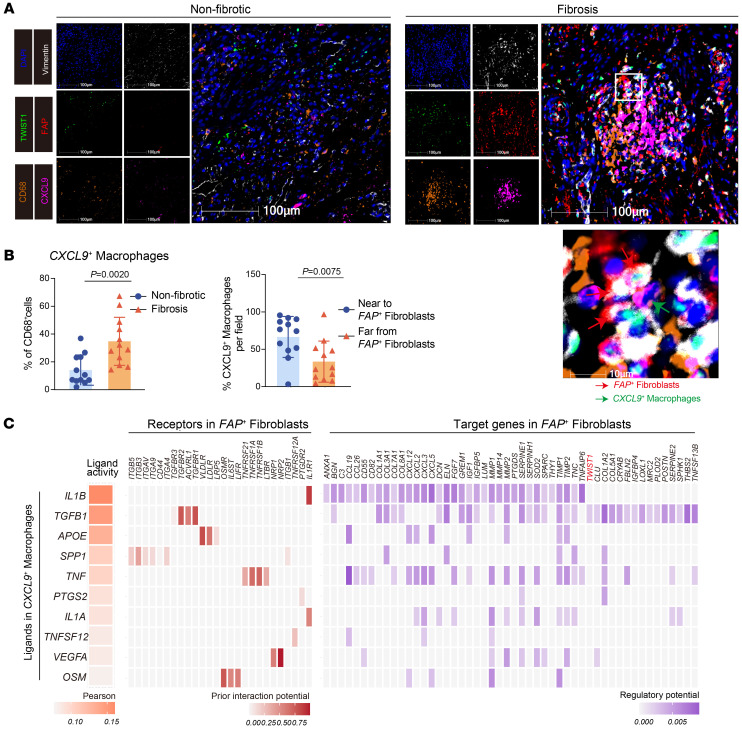
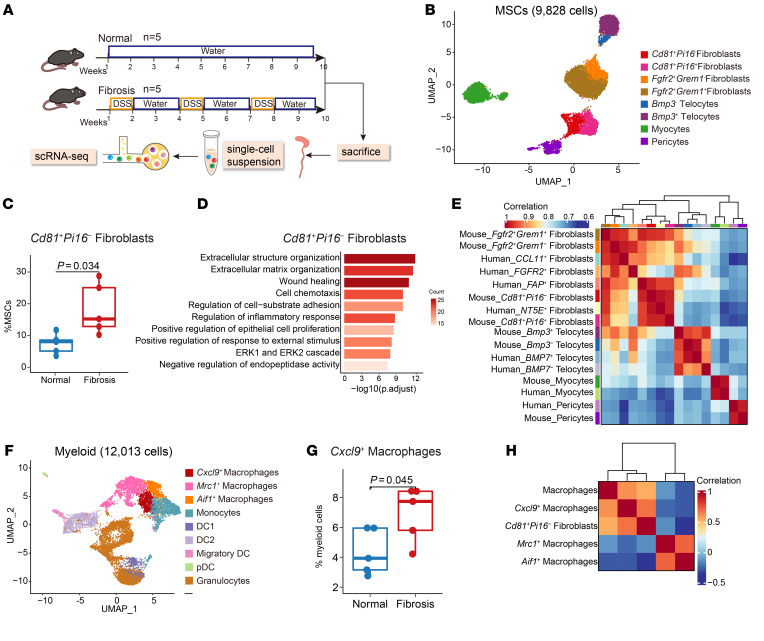
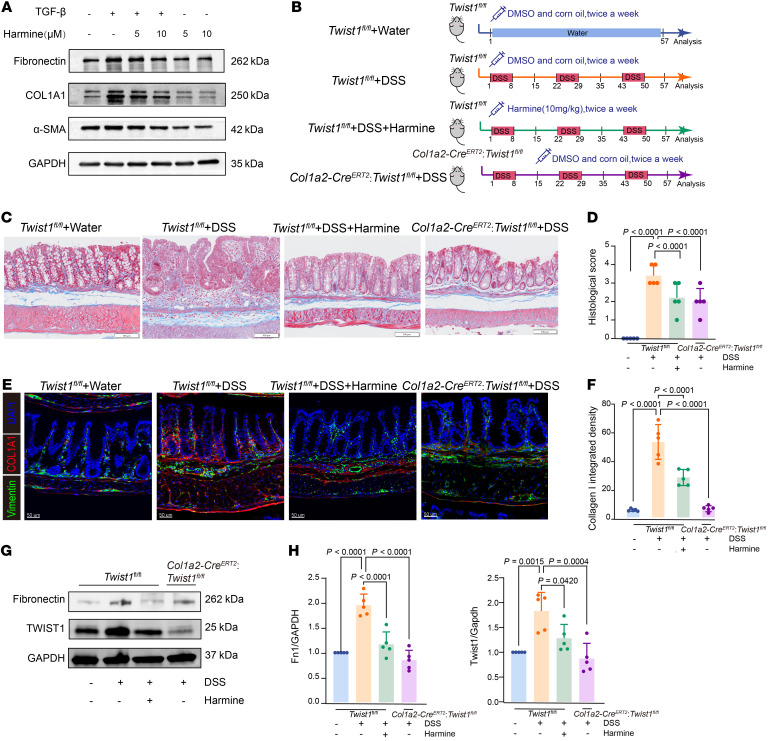
Intestinal fibrosis, a severe complication of Crohn's disease (CD), is characterized by excessive extracellular matrix (ECM) deposition and induces intestinal strictures, but there are no effective antifibrosis drugs available for clinical application. We performed single-cell RNA sequencing (scRNA-Seq) of fibrotic and nonfibrotic ileal tissues from patients with CD with intestinal obstruction. Analysis revealed mesenchymal stromal cells (MSCs) as the major producers of ECM and the increased infiltration of its subset FAP+ fibroblasts in fibrotic sites, which was confirmed by immunofluorescence and flow cytometry. Single-cell transcriptomic profiling of chronic dextran sulfate sodium salt murine colitis model revealed that CD81+Pi16- fibroblasts exhibited transcriptomic and functional similarities to human FAP+ fibroblasts. Consistently, FAP+ fibroblasts were identified as the key subtype with the highest level of ECM production in fibrotic intestines. Furthermore, specific knockout or pharmacological inhibition of TWIST1, which was highly expressed by FAP+ fibroblasts, could significantly ameliorate fibrosis in mice. In addition, TWIST1 expression was induced by CXCL9+ macrophages enriched in fibrotic tissues via IL-1β and TGF-β signal. These findings suggest the inhibition of TWIST1 as a promising strategy for CD fibrosis treatment.

Keywords: Extracellular matrix; Fibrosis; Gastroenterology; Inflammatory bowel disease.


Figures

Figure 1
Figure 1. Cellular landscape of fibrotic and nonfibrotic tissues from patients with intestinal fibrosis.
(A) Graphic overview of the study design. Surgical specimens of fibrotic and adjacent nonfibrotic intestinal segments from patients with CD were processed into single-cell suspensions and subjected to scRNA-Seq using 10x Genomics. Integrated analyses of single-cell transcriptome data are shown in the rectangle to the right. (B) Representative plots of H&E and Masson’s trichrome staining of fibrotic and nonfibrotic intestine tissues from a patient with CD. Scale bar: 1 mm. (C) Bar plots showing histologic scores of the fibrotic intestinal (n = 6) and nonfibrotic (n = 6) segments. Data represent the mean ± SD. Statistical differences were determined by paired Wilcoxon’s rank-sum tests. (DF) The relative minimal (min) and maximal (max) width of the mucosa (D), submucosa (E), and muscularis propria (F) of the fibrotic and nonfibrotic intestine. All nonfibrotic values were normalized to 100% to calculate the relative thickness of the fibrosis site. Data represent the mean ± SD. Statistical differences were determined by paired Wilcoxon’s rank-sum tests. (G) Uniform manifold approximation and projection (UMAP) plots showing 9 major cell types from 6 fibrotic samples (56,764 cells) and 6 nonfibrotic samples (34,552 cells). (H) Dot plots of representative markers in the indicated major cell types. The average gene expression and percentage of cells expressed are shown by dot color and size, respectively. (I) Bar graph showing the percentage of major cell types in fibrotic and nonfibrotic samples. (J) Box plots showing the ECM signature score of each cell type in fibrotic states. Statistical differences were determined by 1-way ANOVA with Bonferroni’s correction.
Figure 2
Figure 2. Heterogeneity of mesenchymal stromal cells in intestinal fibrosis.
(A) UMAP plots of subclustered mesenchymal stromal cells in nonfibrotic and fibrotic states. (B) Heatmap showing the relative expression (Z score) of representative markers in each MSC subtype. Clusters are colored as in A. (C) Comparison of frequencies of FAP+ fibroblasts and FGFR2+ fibroblasts of MSCs in paired fibrotic intestinal samples (n = 6) and nonfibrotic intestinal samples (n = 6). Statistical differences were determined by paired t tests. (D) Representative flow cytometry plots of FAP+ fibroblasts (top) and FGFR2+ fibroblasts (bottom) in fibrotic and nonfibrotic mucosa samples. The gating strategies for MSCs are shown in Supplemental Figure 2D. (E) Flow cytometry analysis revealed the proportional variation in FAP+ fibroblasts and FGFR2+ fibroblasts to CD90+ fibroblasts in fibrotic and nonfibrotic sites. The points corresponding to the paired samples (n = 6) in the graph are connected. Statistical differences were determined by paired t tests. (F and G) Representative Gene Ontology (GO) enrichment of the marker genes expressed in FAP+ fibroblasts (F) and FGFR2+ fibroblasts (G). A hypergeometric test was performed with FDR-adjusted P values. (H) Box plots showing the ECM signature score of each subcluster of MSCs in fibrotic states. Statistical differences were determined by 1-way ANOVA with Bonferroni’s correction.
Figure 3
Figure 3. TWIST1 is a critical transcription factor in the differentiation of FAP+ fibroblasts.
(A) Representative IF staining of human fibrotic and nonfibrotic intestinal tissue (original magnification, ×20). DAPI (blue), FAP (red), and COL1A1 (green) in individual and merged channels are shown. Scale bar: 100 μm. (B) Quantitative analysis (integrated fluorescence intensity) of FAP and COL1A1 in IF staining. The points corresponding to the paired samples (n = 5) in the graph are connected. Statistical differences were determined by paired t tests. (C) The mRNA levels of COL1A1, ACAT2, and POSTN in FAP+ fibroblasts, FGFR2+ fibroblasts, and pericytes sorted from fibrotic and nonfibrotic sites were analyzed by qPCR. The points corresponding to the paired samples (n = 5) in the graph are connected. Statistical differences were determined by paired t tests. (D) RNA velocity of 4 fibroblast subclusters. Color is as in Figure 2A. The inferred developmental trajectory of FAP+ fibroblasts enlarged. (E) Heatmap showing the relative expression (Z score) of the top 5 transcription factor (TF) genes in each MSC subtype. Color is as in Figure 2A. (F) Heatmap showing the normalized activity of the top 5 TF regulons in MSC subtypes predicted by SCENIC. Color is as in Figure 2A. (G) Feature plots showing the expression of TWIST1 (top) and the activity of TWIST1 regulon (bottom). The position of FAP+ fibroblasts is red circled. (H) The mRNA levels of TWIST1 in FAP+ fibroblasts sorted from fibrotic and nonfibrotic sites were analyzed by qPCR. The points corresponding to the paired samples (n = 5) in the graph are connected. Statistical differences were determined by paired t tests.
Figure 4
Figure 4. Identification of profibrotic macrophage phenotypes in intestinal fibrosis.
(A) UMAP plots of the subclustered myeloid cells in the nonfibrotic and fibrotic states. (B) Dot plots of the representative markers of subclustered myeloid cells. The average gene expression levels and percentage of cells expressed are shown by dot color and size, respectively. (C) Comparison of frequencies of CXCL9+ macrophages and MRC1+ macrophages of myeloid cells in paired fibrotic intestinal samples (n = 6) and nonfibrotic intestinal samples (n = 6). Statistical differences were determined by paired t tests. (D) Representative flow cytometry plots of CXCL9+ macrophages and MRC1+ macrophages in fibrotic and nonfibrotic mucosa samples. The gating strategies for MSCs are shown in Supplemental Figure 5F. (E) Flow cytometry analysis revealed the proportion variation in CXCL9+ macrophages and MRC1+ macrophages to CD45+ live cells in fibrotic and nonfibrotic sites. The points corresponding to the paired samples (n = 6) in the graph are connected. Statistical differences were determined by paired t tests. (F) Heatmap showing the correlation between the percentages of total macrophages and macrophage subsets and FAP+ fibroblasts across 12 scRNA-Seq samples. (G) Heatmap showing the gene signature correlation between total macrophages and macrophage subsets and FAP+ fibroblasts in an RNA-Seq dataset (GSE192786, n = 40).
Figure 5
Figure 5. The interaction between FAP+ fibroblasts and CXCL9+ macrophages.
(A) Representative multiplex immunofluorescence (mIF) staining of human fibrotic (right) and nonfibrotic (left) intestinal tissue (original magnification, ×20). DAPI (blue), FAP (red), TWIST1 (green), vimentin (white), CD68 (orange), and CXCL9 (purple) in individual and merged channels are shown. Scale bar: 100 μm. A high-power field (bottom) showing close colocalization between FAP+ fibroblasts (red arrows) and CXCL9+ macrophages (green arrows). The experiment was performed in 4 patients. (B) Quantitative analysis of mIF staining. Proportion of CXCL9+ macrophages to CD68+ cells between fibrotic and nonfibrotic intestinal samples (left); the proportion of CXCL9+ macrophages near to FAP+ fibroblasts (within 30 μm) and far from FAP+ fibroblasts (of 30 μm) per field in fibrosis states (right) was calculated by HALO software (n = 12, 4 patients with 3 fields). Statistical differences were determined by t test. (C) Heatmap showing the activity of the top-ranked ligands inferred to regulate FAP+ fibroblasts by CXCL9+ macrophages according to NicheNet (left), the ligand–receptor interaction between them ordered by ligand activity (middle), and the downstream target genes in FAP+ fibroblasts (right).
Figure 6
Figure 6. Transcriptomic homology between murine stromal cell subsets and human stromal cell subsets.
(A) Graphic overview of the scRNA-Seq design for the mouse model. Colons of chronic DSS-treated (n = 5) and control mice (n = 5) were processed into single-cell suspensions and subjected to scRNA-Seq using 10x Genomics. (B) UMAP plot of the subclustered MSCs of the mouse model. (C) Box plots showing the proportions of CD81+Pi16 fibroblasts in DSS-treated (n = 5) and control mice (n = 5). Statistical differences were determined by t tests. (D) Representative Gene Ontology (GO) enrichment of the marker genes expressed in CD81+Pi16 fibroblasts. A hypergeometric test was performed with FDR-adjusted P values. (E) Heatmap showing Spearman’s correlation of transcriptomic homology among human and mouse MSC subclusters. (F) UMAP plot of the subclustered myeloid cells of the mouse model. (G) Box plots showing the proportions of Cxcl9+ macrophages in DSS-treated (n = 5) and control mice (n = 5). Statistical differences were determined by t tests. (H) Heatmap showing the correlation between the percentages of total macrophages and macrophage subsets and CD81+Pi16 fibroblasts across 10 mouse scRNA-Seq samples.
Figure 7
Figure 7. Targeting TWIST1 inhibits fibroblast activation and attenuates experimental intestinal fibrosis.
(A) Western blotting images showing the expression of ECM-related genes in primary human intestinal fibroblasts with or without TGF-β (5 ng/mL, 48 hours) and harmine administration (5 μM or 10 μM, 48 hours). (B) Schematic diagram for the in vivo experiments (5 mice per group). (C) Masson’s trichrome staining showing collagen deposition in mouse colons across the 4 indicated groups. Scale bar: 100 μm. (D) Bar plots showing histologic scores of mouse colons across the 4 indicated groups. Data represent the mean ± SD. Statistical differences were determined by the 1-way ANOVA with Bonferroni’s correction. (E) Representative IF staining of mouse colons across the 4 indicated groups (original magnification, ×20). DAPI (blue), COL1A1 (red), and vimentin (green) in merged channels are shown. Scale bar: 50 μm. (F) Quantitative analysis (integrated fluorescence intensity) of COL1A1 in IF staining of mouse colons. Data represent the mean ± SD. Statistical differences were determined by 1-way ANOVA with Bonferroni’s correction. (G and H) Representative plots (G) and quantitative analysis (H) of Western blotting images showing the expression of fibronectin and TWIST1 in mouse colons across the 4 indicated groups. Data represent the mean ± SD. Statistical differences were determined by 1-way ANOVA with Bonferroni’s correction.

Comment in

  • UnTWISTing intestinal fibrosis: single-cell transcriptomics deciphers fibroblast heterogeneity, uncovers molecular pathways, and identifies therapeutic targets doi: 10.1172/JCI184112

References

    1. Cosnes J, et al. Epidemiology and natural history of inflammatory bowel diseases. Gastroenterology. 2011;140(6):1785–1794. doi: 10.1053/j.gastro.2011.01.055. - DOI - PubMed
    1. Peyrin-Biroulet L, et al. The natural history of adult Crohn’s disease in population-based cohorts. Am J Gastroenterol. 2010;105(2):289–297. doi: 10.1038/ajg.2009.579. - DOI - PubMed
    1. Santacroce G, et al. Therapeutic targeting of intestinal fibrosis in Crohn’s disease. Cells. 2022;11(3):429. doi: 10.3390/cells11030429. - DOI - PMC - PubMed
    1. Lenti MV, et al. Recent advances in intestinal fibrosis. Mol Aspects Med. 2024;96:101251. doi: 10.1016/j.mam.2024.101251. - DOI - PubMed
    1. Lin SN, et al. Development of antifibrotic therapy for stricturing Crohn’s disease: lessons from randomized trials in other fibrotic diseases. Physiol Rev. 2022;102(2):605–652. doi: 10.1152/physrev.00005.2021. - DOI - PMC - PubMed

MeSH terms