. 2024 Jul 25;84(14):2618-2633.e10.
doi: 10.1016/j.molcel.2024.06.031. Epub 2024 Jul 17.

The splicing factor CCAR1 regulates the Fanconi anemia/BRCA pathway

Affiliations

The splicing factor CCAR1 regulates the Fanconi anemia/BRCA pathway

Naoya Harada et al. Mol Cell. .

Abstract

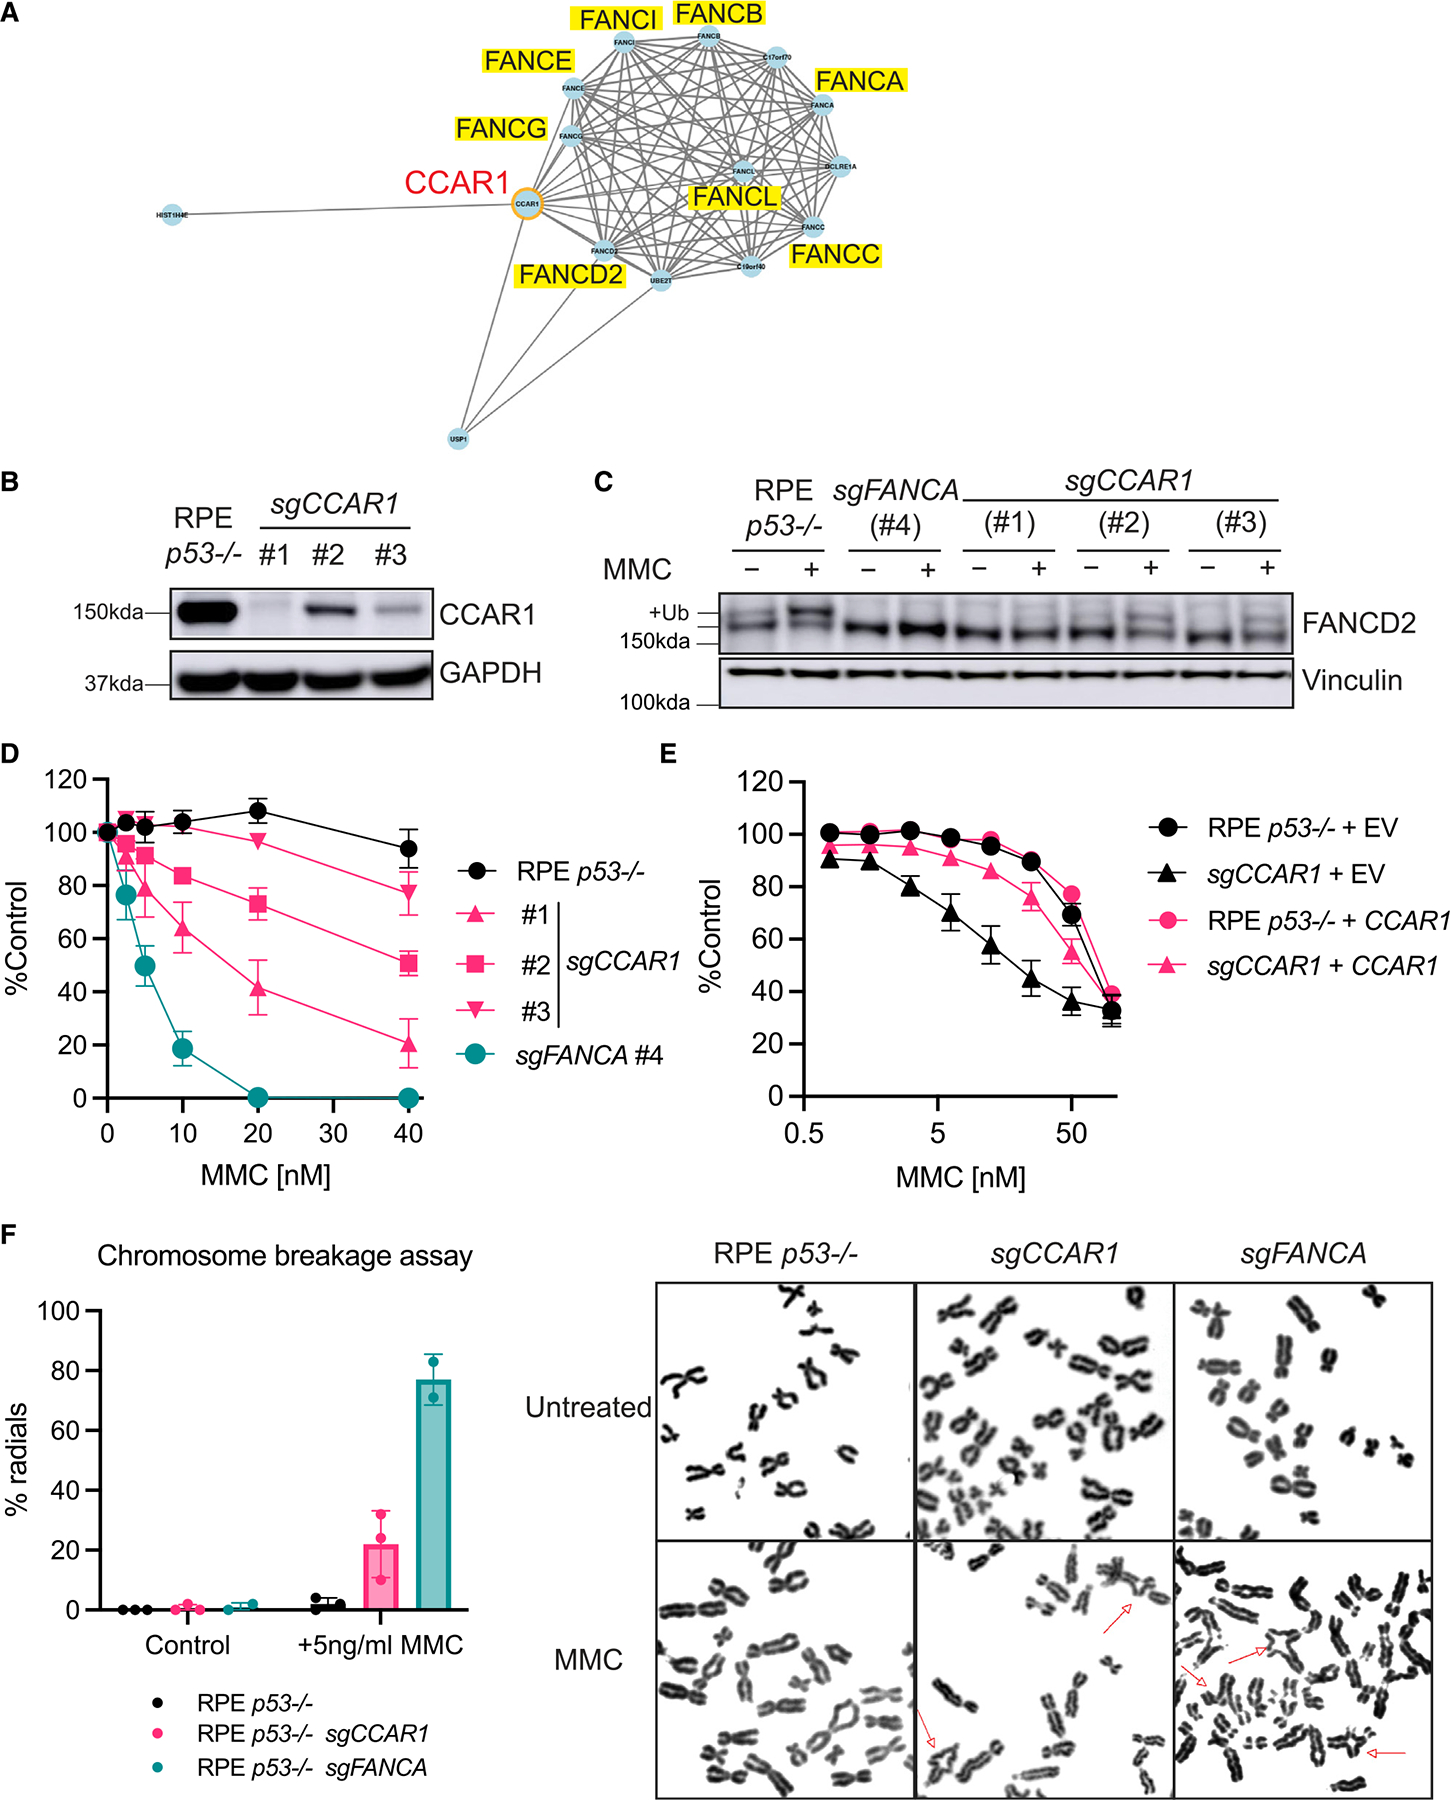
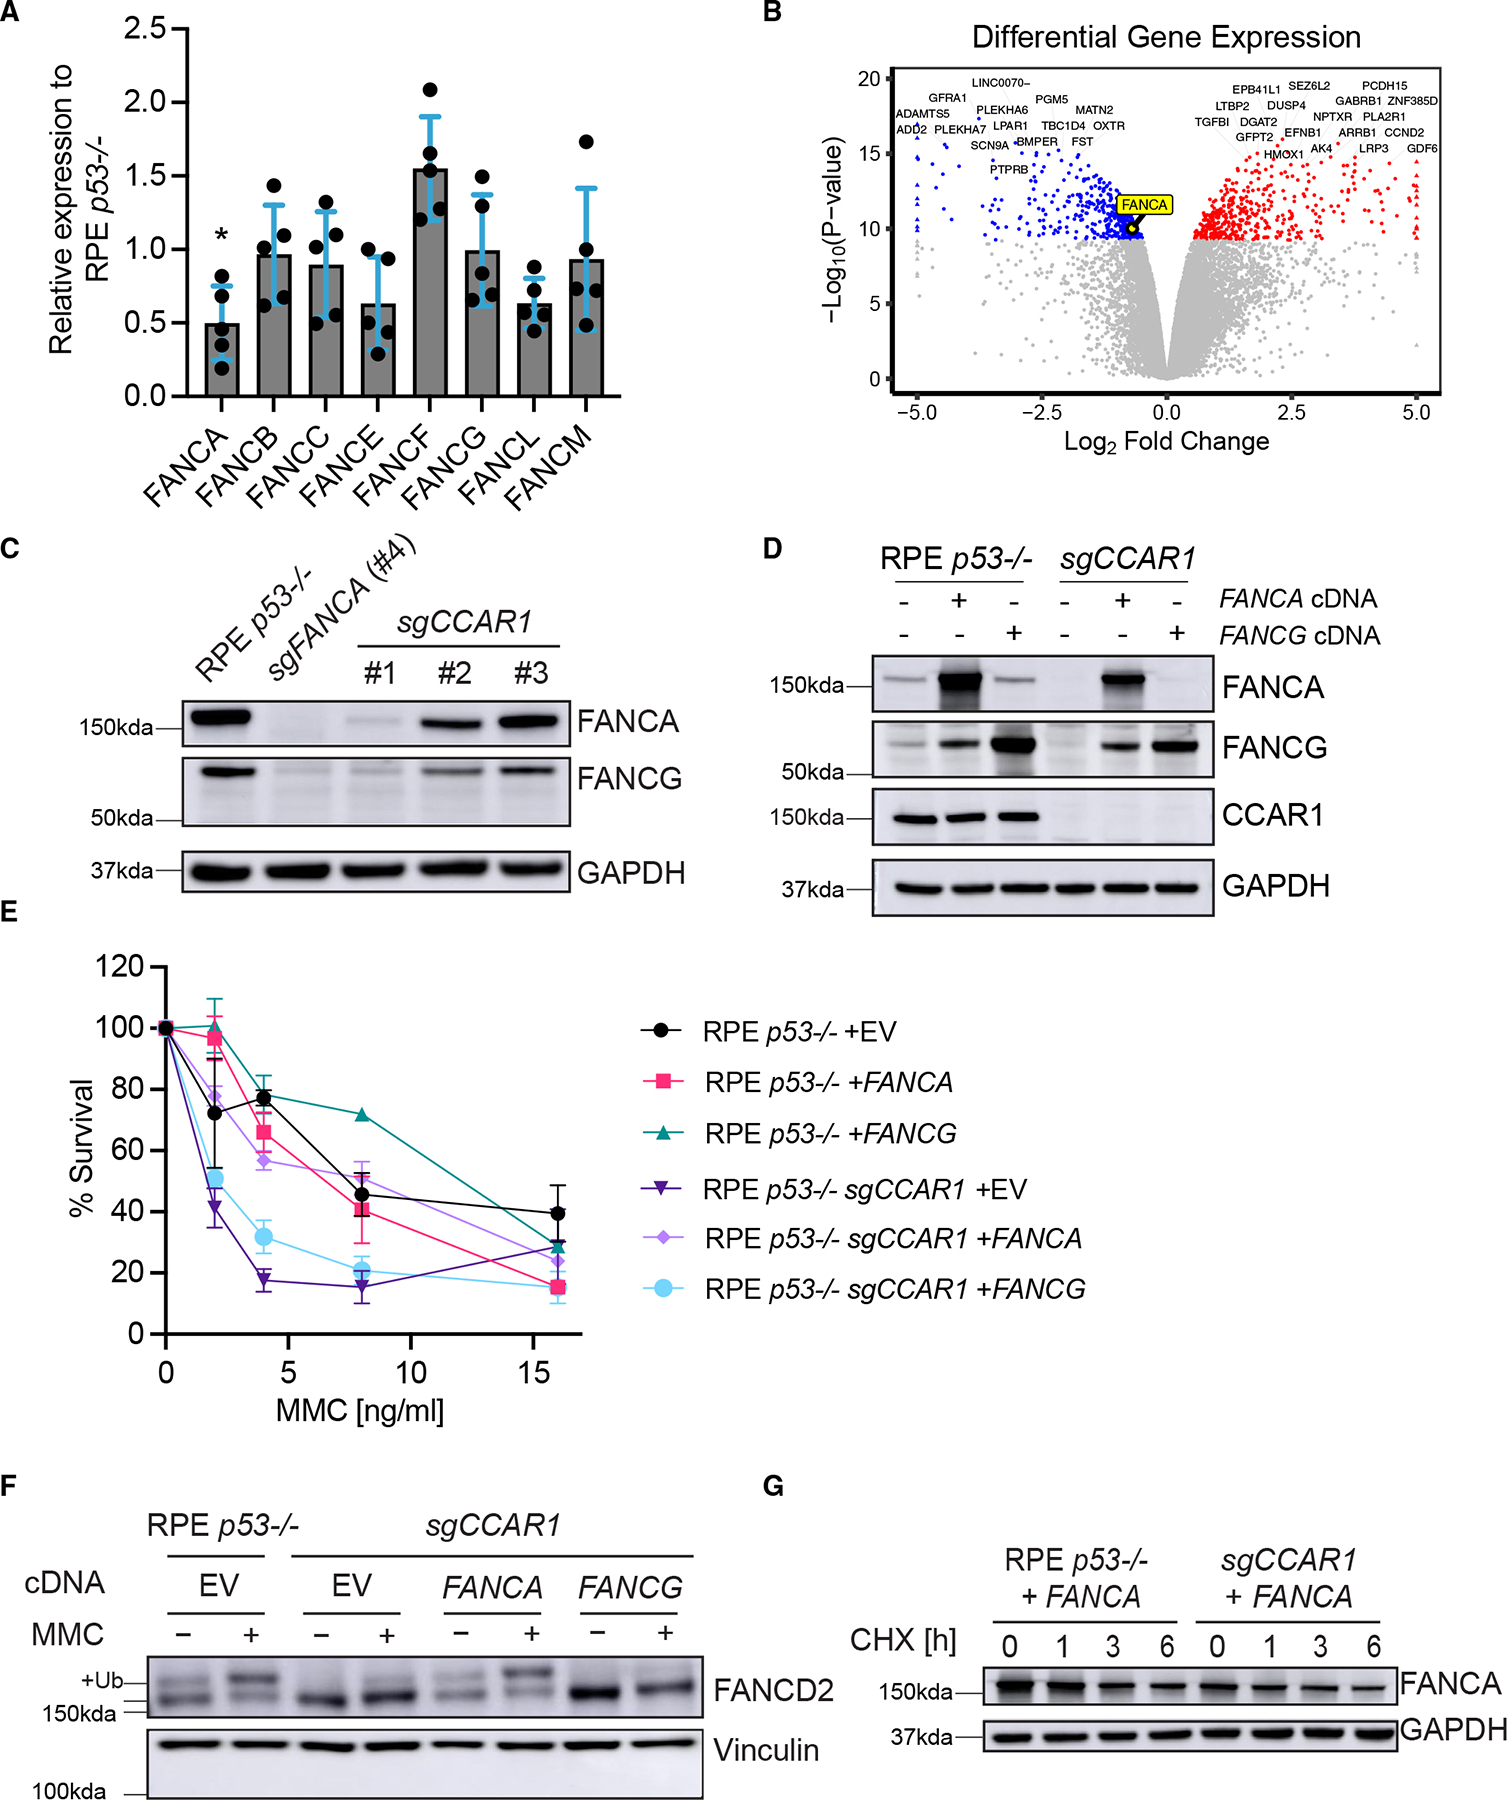
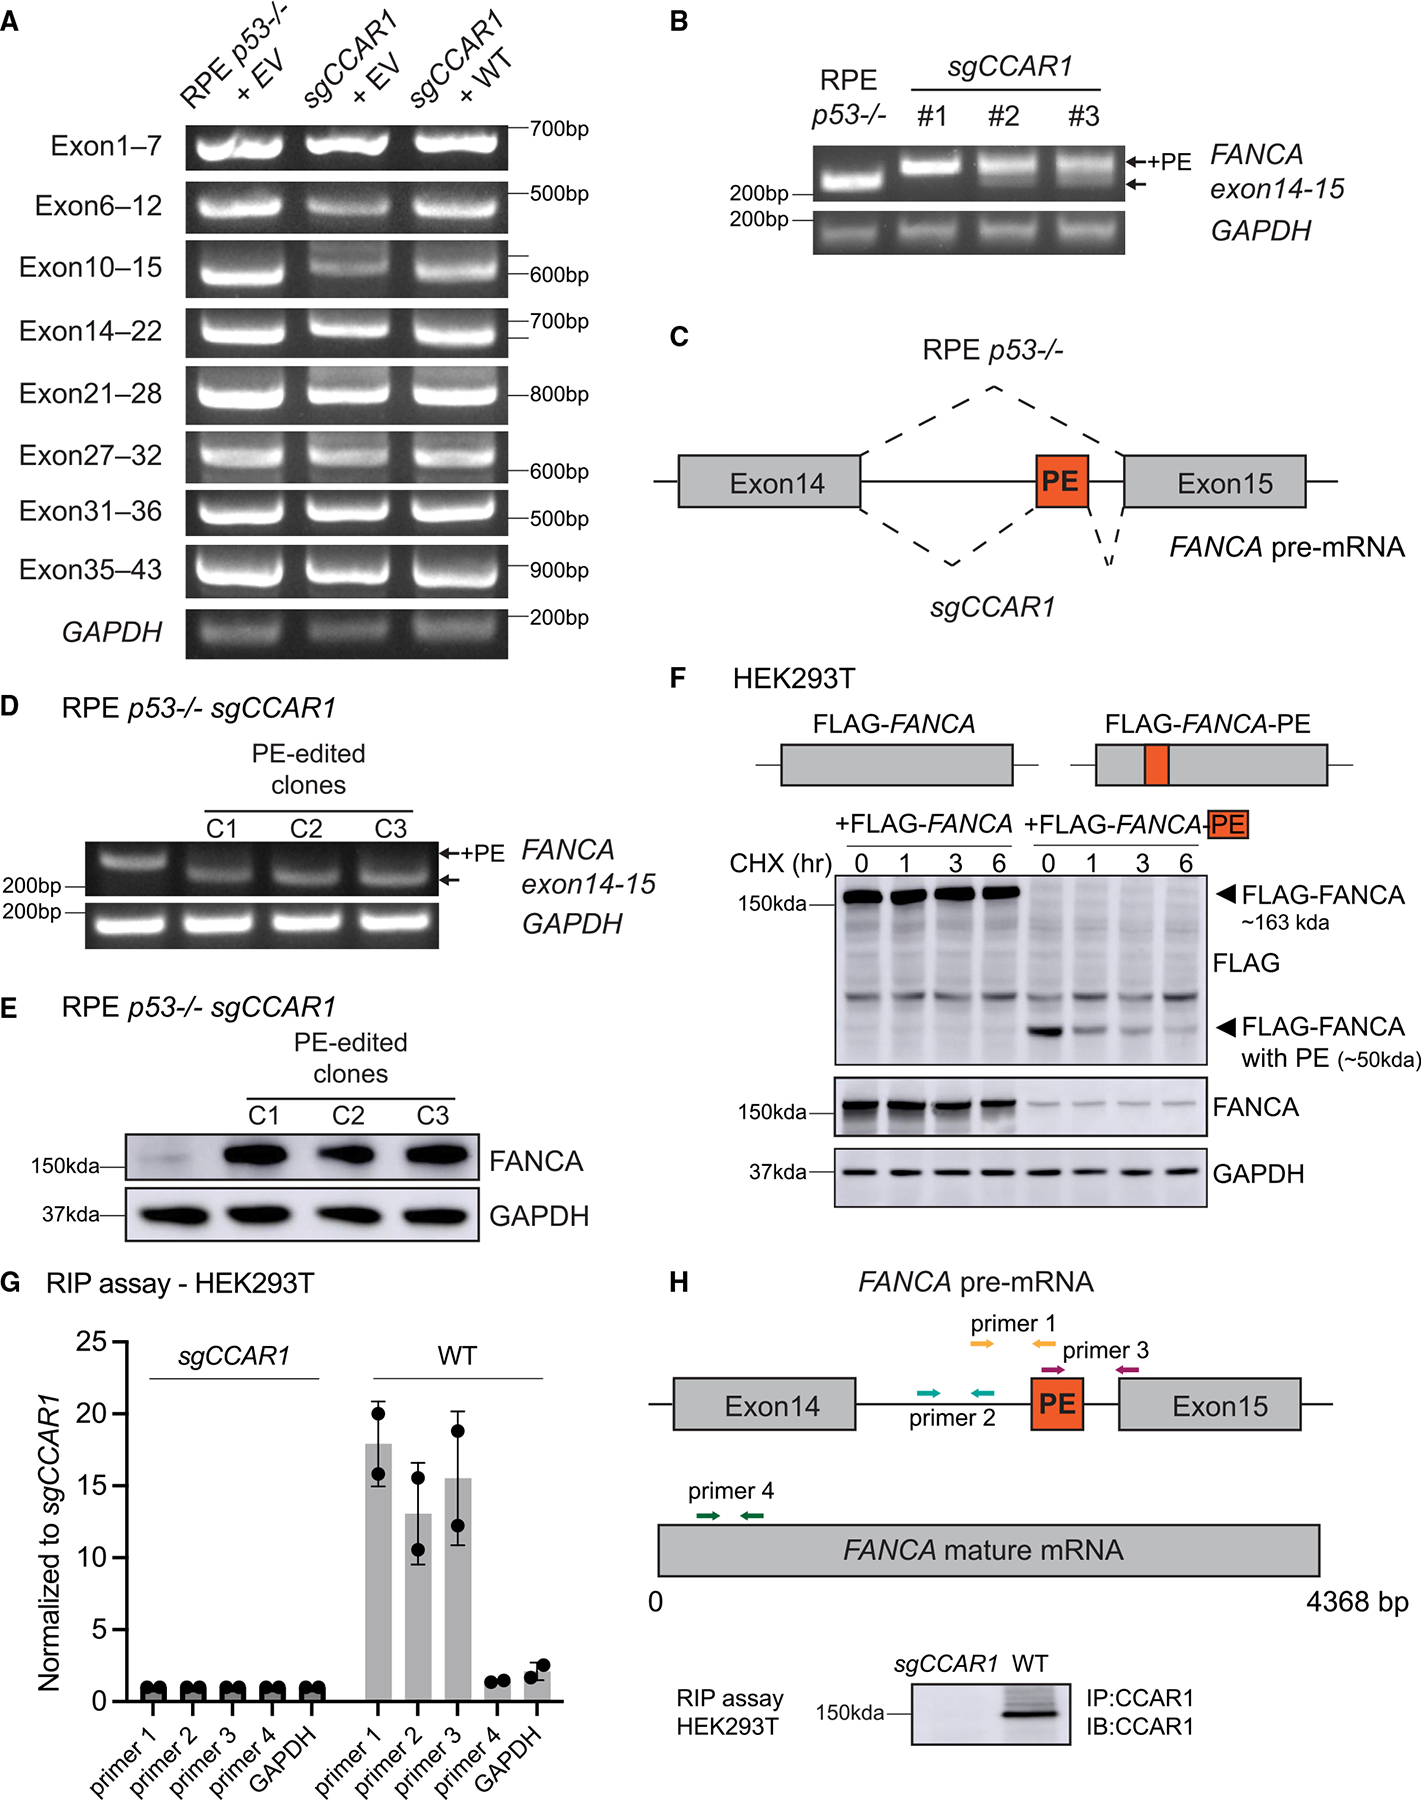
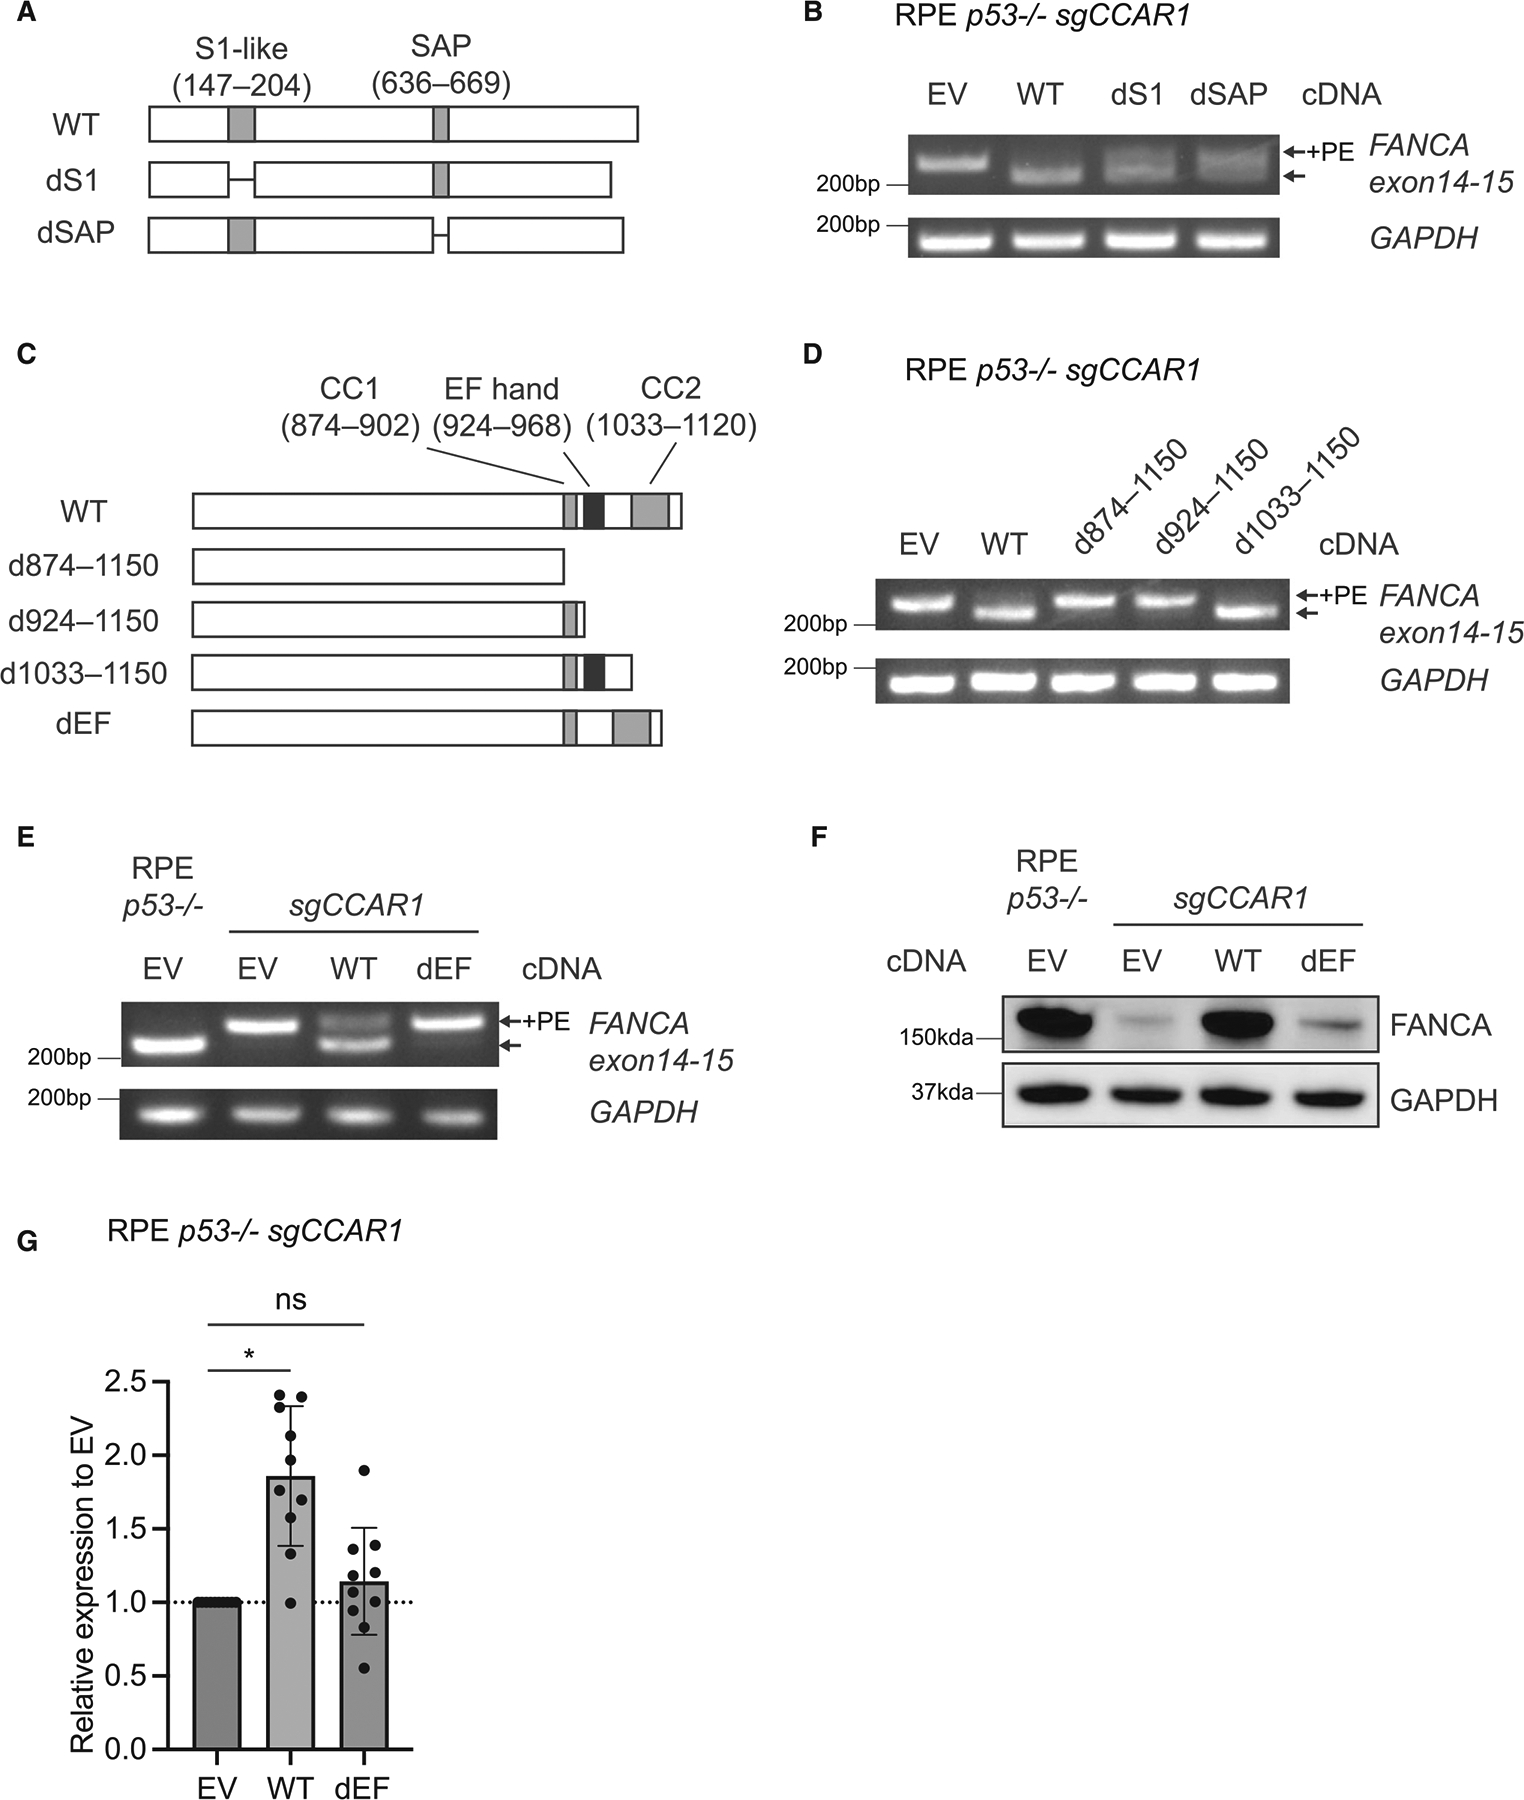
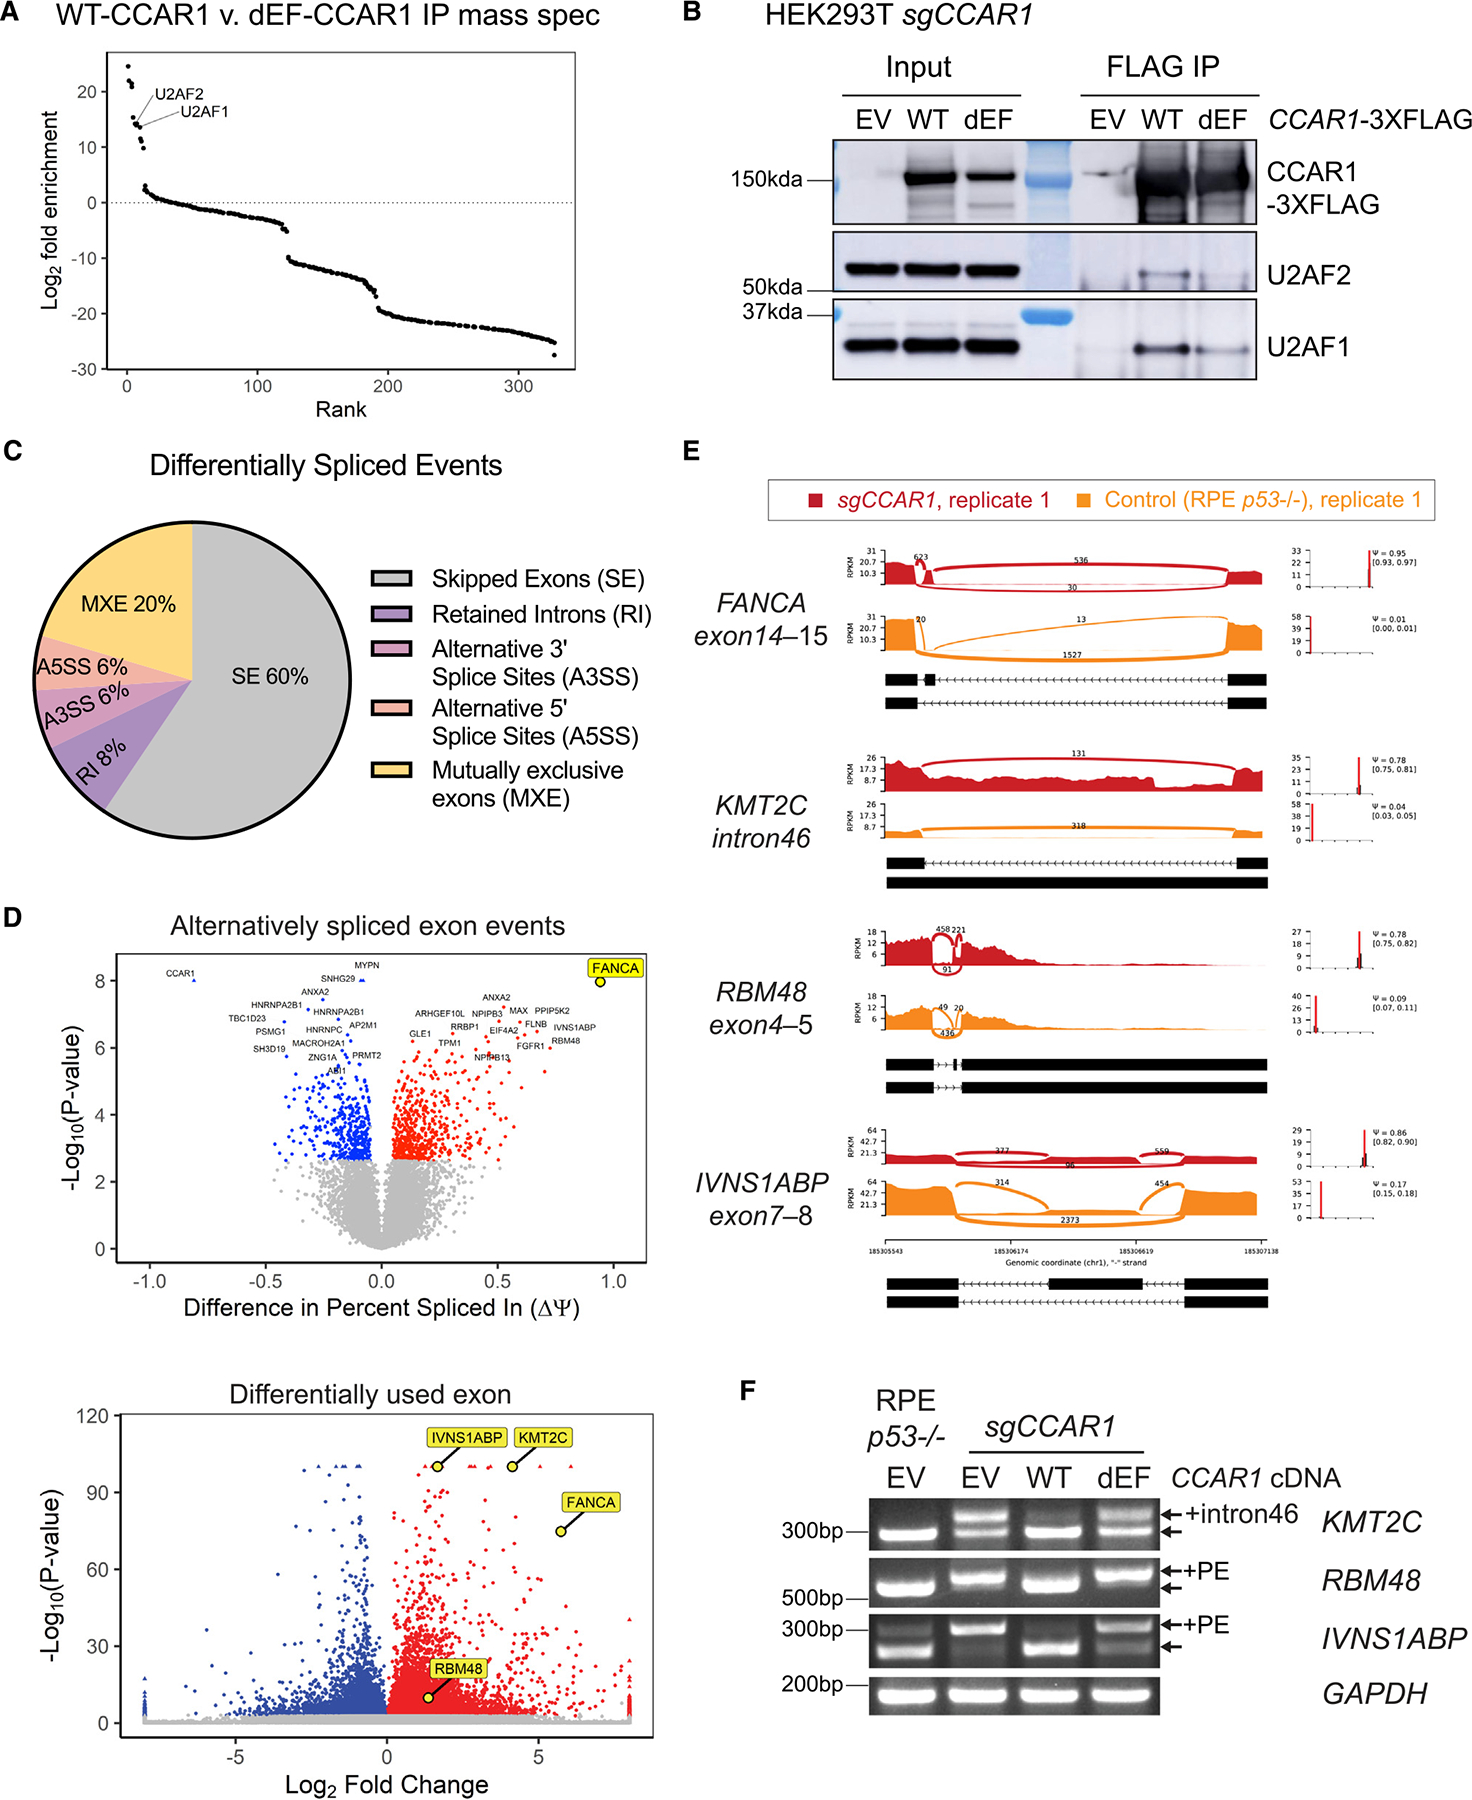
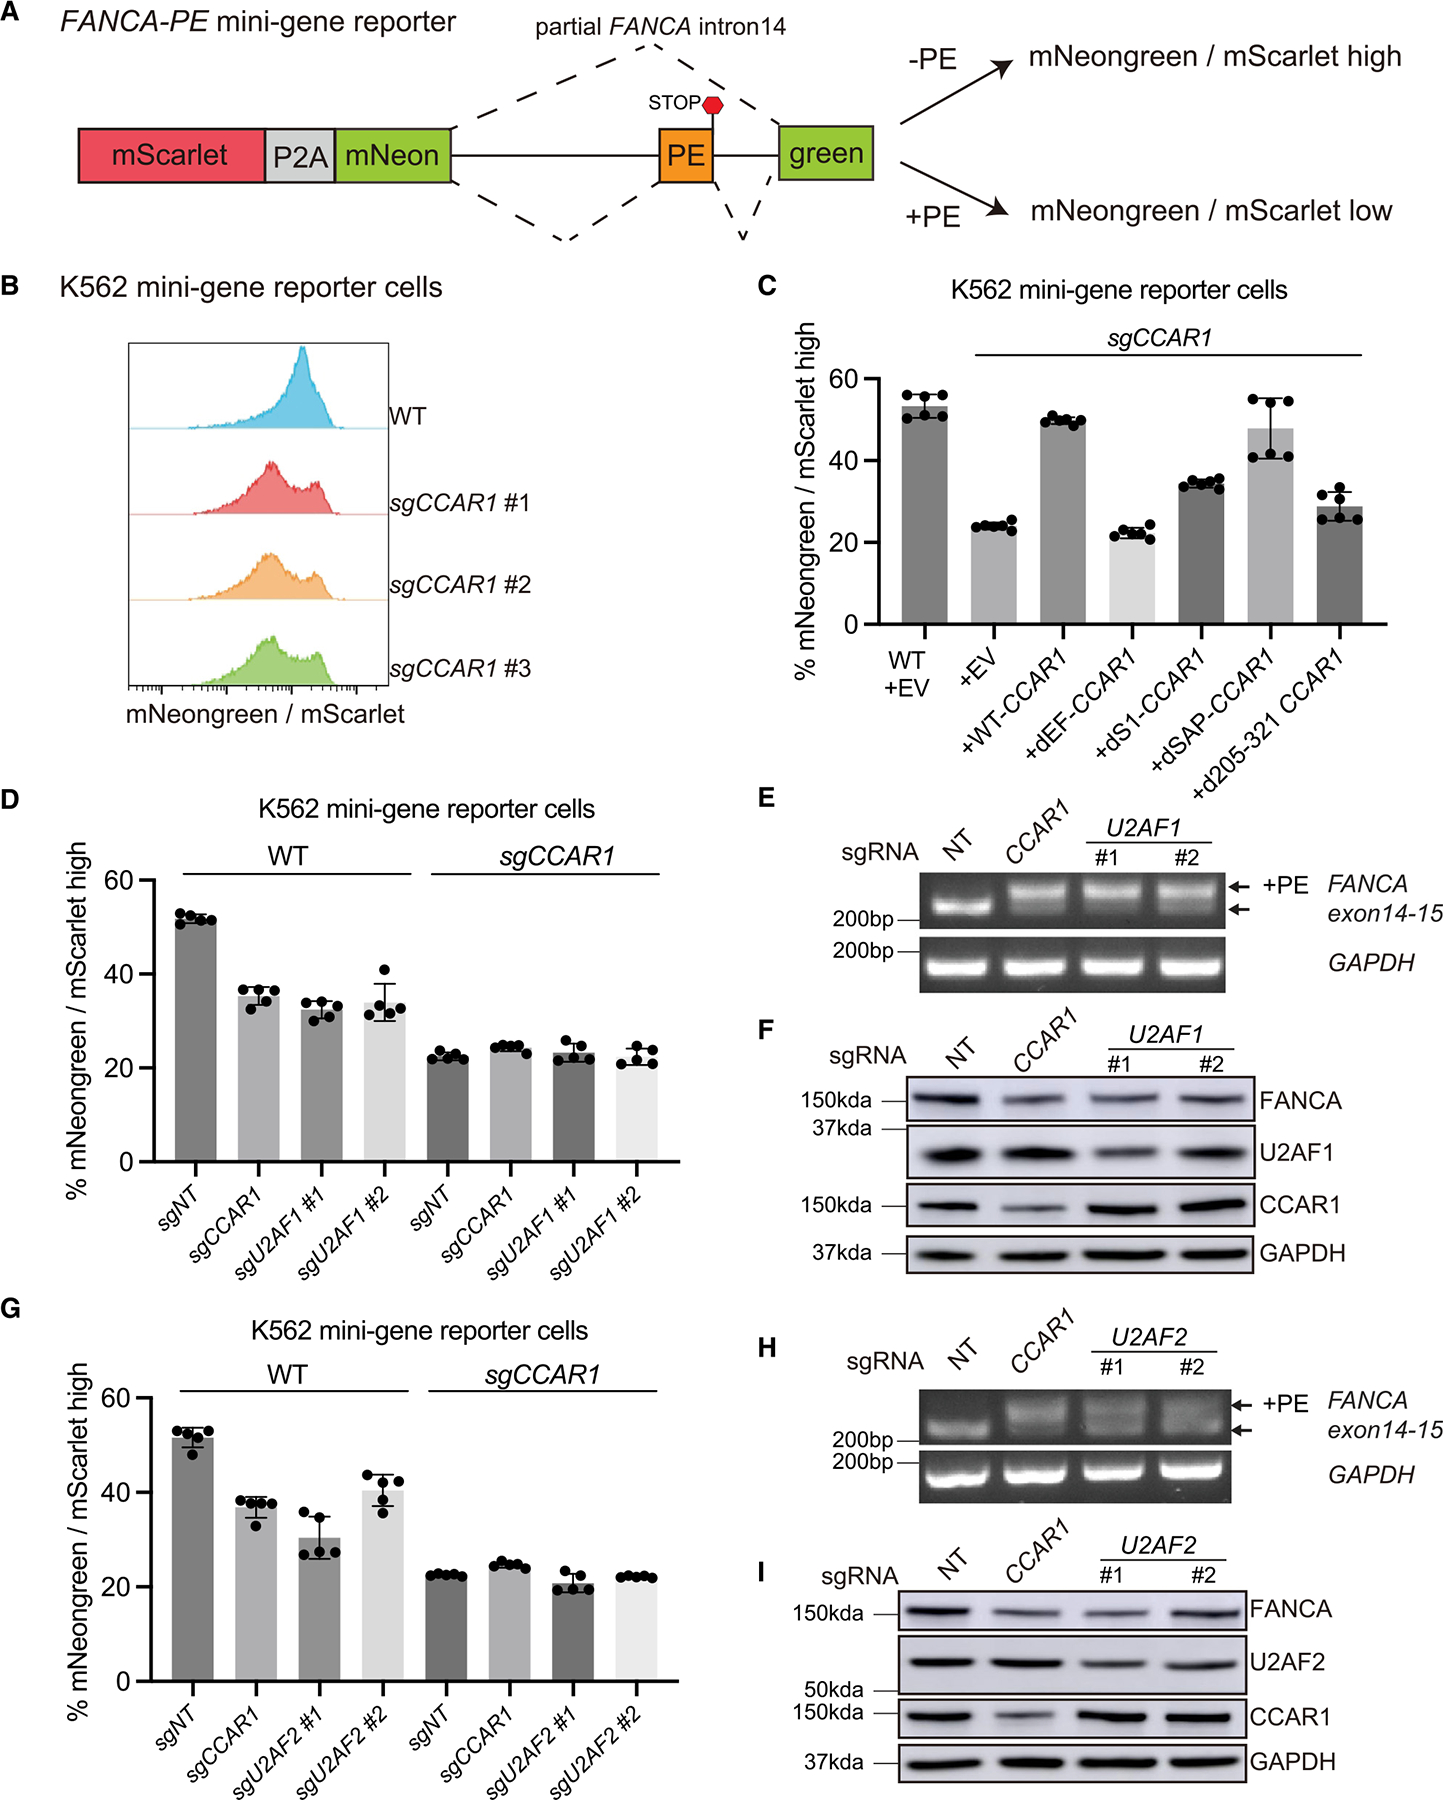
The twenty-three Fanconi anemia (FA) proteins cooperate in the FA/BRCA pathway to repair DNA interstrand cross-links (ICLs). The cell division cycle and apoptosis regulator 1 (CCAR1) protein is also a regulator of ICL repair, though its possible function in the FA/BRCA pathway remains unknown. Here, we demonstrate that CCAR1 plays a unique upstream role in the FA/BRCA pathway and is required for FANCA protein expression in human cells. Interestingly, CCAR1 co-immunoprecipitates with FANCA pre-mRNA and is required for FANCA mRNA processing. Loss of CCAR1 results in retention of a poison exon in the FANCA transcript, thereby leading to reduced FANCA protein expression. A unique domain of CCAR1, the EF hand domain, is required for interaction with the U2AF heterodimer of the spliceosome and for excision of the poison exon. Taken together, CCAR1 is a splicing modulator required for normal splicing of the FANCA mRNA and other mRNAs involved in various cellular pathways.

Keywords: CCAR1; DNA repair; EF hand; FANCA; Fanconi anemia; U2AF1/2; alternative splicing; poison exon.


Conflict of interest statement

Declaration of interests A.D.D. reports consulting for AbbVie, Deerfield Management Company, Impact Therapeutics, Moderna Therapeutics, PrimeFour Therapeutics, Schrödinger Inc., Servier BioInnovation LLC, and Tango Therapeutics; is a Scientific Advisory Board Member and Stockholder for Impact Therapeutics and Covant Therapeutics. K.A. is a member of the Advisory Board of Molecular Cell, the SAB of CAMP4 Therapeutics, consults for Syros Pharmaceuticals and Odyssey Therapeutics, and received research funding from Novartis not related to this work.

Figures

Figure 1.
Figure 1.. CCAR1 knockout cells display FA-like phenotypes
(A) CCAR1 was found in the same cluster as FA genes in CRISPR screens for DNA damage response. This figure was created using Genotoxic Screens app developed by the Durocher lab. Network correlation cutoff was set at 0.7. (B) Western blot (WB) of CCAR1 in RPE p53−/− CCAR1 knockout clones used in this study. (C) WB of FANCD2 in CCAR1 knockout clones (n = 2). The cells were treated with 100 ng/mL MMC for 24 h. (D) Colony formation assay data of RPE p53−/− CCAR1 knockout clones treated with MMC. Mean and SEM from n = 3 independent experiments are plotted. (E) CCAR1 transduced RPE p53−/− CCAR1 knockout clone #1 is resistant to MMC treatment. The cells were treated with MMC for 6 days, and then cell viability was measured by CellTiter-Glo assay. Mean and SEM from n = 3 independent experiments are plotted. (F) Chromosome breakage analysis in RPE p53−/− CCAR1 knockout clone #1. The cells were treated with 5 ng/mL MMC for 48 h. Mean and SD from n = 3 independent experiments (left) and representative images of radial chromosomes (right) are shown. The chromosome spreads were imaged using 100× objective. Red arrows indicate radial chromosome. See also Figure S1.
Figure 2.
Figure 2.. FANCA loss is a key mechanism for the FA phenotypes of CCAR1 knockout cells
(A) mRNA expression levels of FA core-complex genes in RPE p53−/−CCAR1 knockout clone #1. Mean and SEM from n = 5 independent experiments are plotted. *: p < 0.05 (two-way ANOVA, Šídák’s multiple comparisons test). (B) Volcano plots showing differential gene expression between control RPE p53−/− and CCAR1 knockout cells. (C) WB of FANCA and FANCG in RPE p53−/− CCAR1 knockout clones (n = 2). (D) WB showing complementation of RPE p53−/− and p53−/−CCAR1 knockout cells with FANCA or FANCG cDNA (n = 3). (E) Colony formation assay data for FANCA or FANCG cDNA transduced RPE p53−/− or p53−/−CCAR1 knockout cells treated with MMC. The cells were treated with MMC for 7 days. Mean and SD from n = 3 independent experiments are plotted. (F) WB of FANCD2 in RPE p53−/− CCAR1 knockout cells transduced with control (EV), FANCA, or FANCG cDNA. The cells were treated with 100 ng/mL MMC for 24 h (n = 2). (G) WB of FANCA in RPE p53−/− cells and p53−/−CCAR1 knockout cells transduced with FANCA cDNA. Cells were treated with cycloheximide (CHX) for 1–6 h (n = 3). See also Figure S2.
Figure 3.
Figure 3.. CCAR1 regulates the splicing of the FANCA transcript
(A) RT-qPCR evaluation of alternative splicing of the FANCA transcript in RPE p53−/− cells transduced with empty vector (EV), p53−/−CCAR1 knockout cells transduced with EV or WT CCAR1. Each fragment was amplified using a primer set indicated in the figure (n = 2). (B) RT-qPCR showing the poison exon (PE) in the FANCA transcript in CCAR1 knockout clones (n = 2). (C) Schematic of the alternative splicing of the FANCA transcript in CCAR1 knockout cells. The PE was retained between exon14 and 15. (D) RT-qPCR showing elimination of the FANCA PE in clones derived from RPE p53−/−CCAR1 knockout cells edited with poison exon targeting sgRNA (n = 2). (E) WB of FANCA in PE-edited CCAR1 knockout clones (n = 2). (F) FANCA mRNA containing the poison exon produces truncated FANCA, which is unstable. Blot showing HEK293T cells transfected with FLAG-FANCA cDNA containing WT FANCA CDS or FLAG-FANCA-PE cDNA containing FANCA CDS with the poison exon inserted between exon14 and 15. (G) Binding of CCAR1 to FANCA pre-mRNA evaluated using the RNA immunoprecipitation (RIP) assay, performed using anti-CCAR1 Ab. Mean and SD from n = 2 are plotted. The assay was performed in HEK293T WT, and CCAR1 knockout was used as a negative control. qPCR was performed with primers targeting FANCA pre-mRNA, FANCA mature mRNA, and GAPDH. (H) Schematic showing primers used for the RIP assay and blot showing immunoprecipitation of CCAR1 in the RIP assay samples. See also Figure S3.
Figure 4.
Figure 4.. The EF hand domain of CCAR1 is essential for FANCA expression
(A) Schematics of dS1 and dSAP mutants used in this study. (B) RT-qPCR evaluating inclusion of the FANCA PE in RPE p53−/−CCAR1 knockout cells transduced with empty vector (EV), WT CCAR1, dS1, or dSAP mutants (n = 2). (C) Schematics of d874–1,150, d924–1,150, d1033–1,150, and dEF mutants. (D) RT-qPCR evaluating inclusion of the FANCA PE in RPE p53−/−CCAR1 knockout cells transduced with d874–1,150, d924–1,150, or d1033–1,150 mutants (n = 2). (E) RT-qPCR evaluating inclusion of the FANCA PE in RPE p53−/−CCAR1 knockout cells transduced with the dEF mutant (n = 2). (F) WB of FANCA in RPE p53−/−CCAR1 knockout cells transduced with the dEF mutant (n = 2). (G) mRNA expression levels of FANCA in RPE p53−/−CCAR1 knockout cells transduced with the dEF mutant. Mean and SEM from n = 10 independent experiments are plotted. *p < 0.0001 (one-way ANOVA, Dunnett’s multiple comparisons test). Statistical analysis was performed by comparing to EV-transduced CCAR1 knockout cells. See also Figure S4.
Figure 5.
Figure 5.. CCAR1 is a component of the spliceosome and regulates splicing events
(A) FLAG IP-mass spectrometry analysis from HEK CCAR1 knockout transfected with EV, WT-CCAR1-3xFlag, or dEF-CCAR1-3xFlag. Rank plot shows log2 fold enrichment of factors in WT-CCAR1 as compared with dEF-CCAR1 pull-down (n = 2). Proteins with positive log2 fold enrichment have increased abundance in WT-CCAR1-3xFlag compared with dEF-CCAR1-3xFlag, and vice versa. (B) WT-CCAR1 interacts with U2AF1/2 complex strongly as compared with dEF-CCAR1. (C) Pie chart summarizing alternative splicing event types in RPE p53−/− CCAR1 knockout cells obtained by MISO analysis. (D) Volcano plots showing alternatively spliced skipped exon (SE) events (upper) and differentially used exons (lower) in RPE p53−/− CCAR1 knockout cells compared with RPE p53−/− cells. (E) Sashimi plots of the alternative splicing events in control and CCAR1 knockout cells: the region between exon14 and exon15 of FANCA transcript, retained intron46 of KMT2C transcript, the region between exon4 and exon5 of RBM48 transcript, and the region between exon7 and exon8 of IVNS1ABP transcript. (F) RT-qPCR showing the intron retention of KMT2C and the poison exons of RBM48 and IVNS1ABP in CCAR1 knockout cells transduced with empty vector (EV), WT CCAR1, or dEF mutant (n = 2). See also Figure S5.
Figure 6.
Figure 6.. The CCAR1-U2AF1/2 axis is critical for exclusion of the FANCA poison exon
(A) Schematic representation of the fluorescence-based FANCA PE mini-gene reporter. See also Figure S6A. (B) Histograms showing the ratio of mNeongreen to mScarlet (mNG/mSC) signal from K562 WT and CCAR1 knockout clones carrying the mini-gene reporter. (C) K562 WT and CCAR1 knockout mini-gene reporter cells were transduced with the indicated lentiviral constructs. Mean and SD of mNG/mSC high cells are plotted (n = 6). (D and G) Loss of CCAR1, U2AF1, or U2AF2 leads to reduced mNG/mSC indicating splicing defect. K562 WT or CCAR1 knockout mini-gene reporter cells were lentivirally transduced with Cas9 and either non-targeting control sgRNA (sgNT), sgCCAR1, or sgU2AF1 (D), or sgU2AF2 (G). 96 h after puromycin selection, the pool cells were analyzed by flow cytometry, and the mean and SD of mNG/mSC ratio was plotted (n = 5). (E and H) Loss of U2AF1 or U2AF2 leads to inclusion of FANCA poison exon. RT-qPCR showing evaluation of FANCA poison exon (PE) inclusion in the K562 minigene reporter cells transduced with sgNT, sgCCAR1, sgU2AF1(E), or sgU2AF2(H). (F and I) Loss of CCAR1, U2AF1, or U2AF2 leads to reduction in FANCA protein levels. Evaluation of FANCA protein levels in K562 mini-gene reporter cells transduced with sgNT, sgCCAR1, sgU2AF1(F), or sgU2AF2(I). See also Figure S6.

Comment in

References

    1. Hanahan D, and Weinberg RA (2011). Hallmarks of cancer: the next generation. Cell 144, 646–674. 10.1016/j.cell.2011.02.013. - DOI - PubMed
    1. Yap TA, Plummer R, Azad NS, and Helleday T (2019). The DNA Damaging Revolution: PARP Inhibitors and Beyond. Am. Soc. Clin. Oncol. Educ. Book 39, 185–195. 10.1200/EDBK_238473. - DOI - PubMed
    1. Ceccaldi R, Liu JC, Amunugama R, Hajdu I, Primack B, Petalcorin MIR, O’Connor KW, Konstantinopoulos PA, Elledge SJ, Boulton SJ, et al. (2015). Homologous-recombination-deficient tumours are dependent on Poltheta-mediated repair. Nature 518, 258–262. 10.1038/nature14184. - DOI - PMC - PubMed
    1. Ceccaldi R, Rondinelli B, and D’Andrea AD (2016). Repair Pathway Choices and Consequences at the Double-Strand Break. Trends Cell Biol. 26, 52–64. 10.1016/j.tcb.2015.07.009. - DOI - PMC - PubMed
    1. Jo U, and Kim H (2015). Exploiting the Fanconi Anemia Pathway for Targeted Anti-Cancer Therapy. Mol. Cells 38, 669–676. 10.14348/molcells.2015.0175. - DOI - PMC - PubMed

MeSH terms