. 2024 Jul 18;7(10):e202302516.
doi: 10.26508/lsa.202302516. Print 2024 Oct.

C/EBPβ deletion in macrophages impairs mammary gland alveolar budding during the estrous cycle

Affiliations

C/EBPβ deletion in macrophages impairs mammary gland alveolar budding during the estrous cycle

Michelle D Rojo et al. Life Sci Alliance. .

Abstract

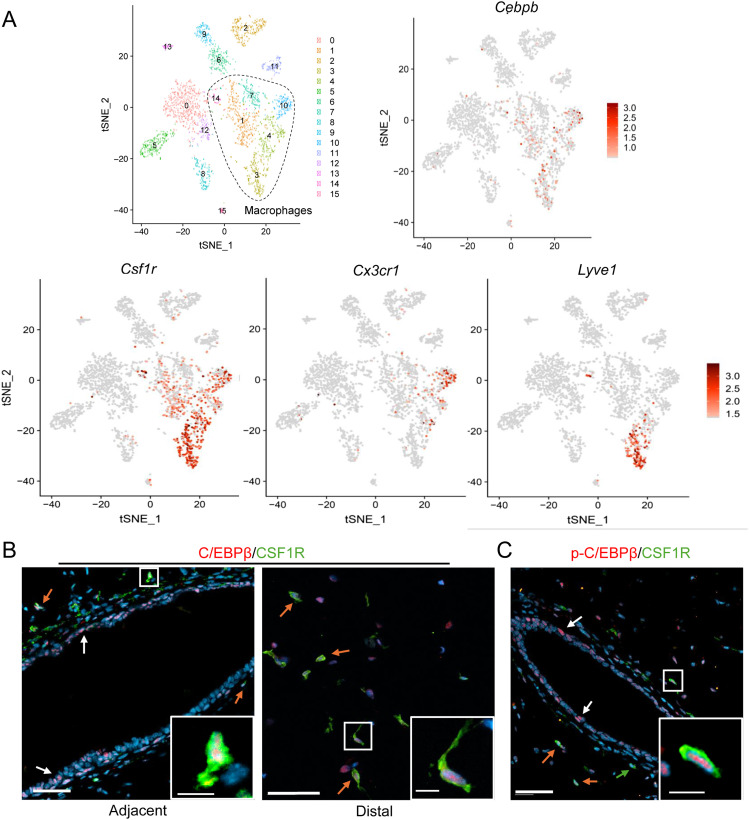
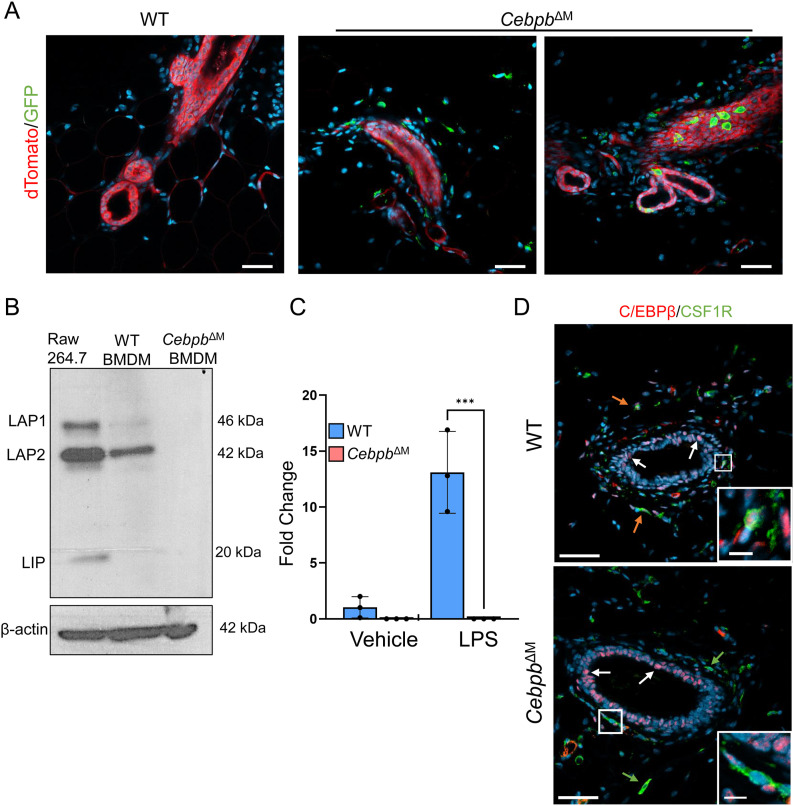
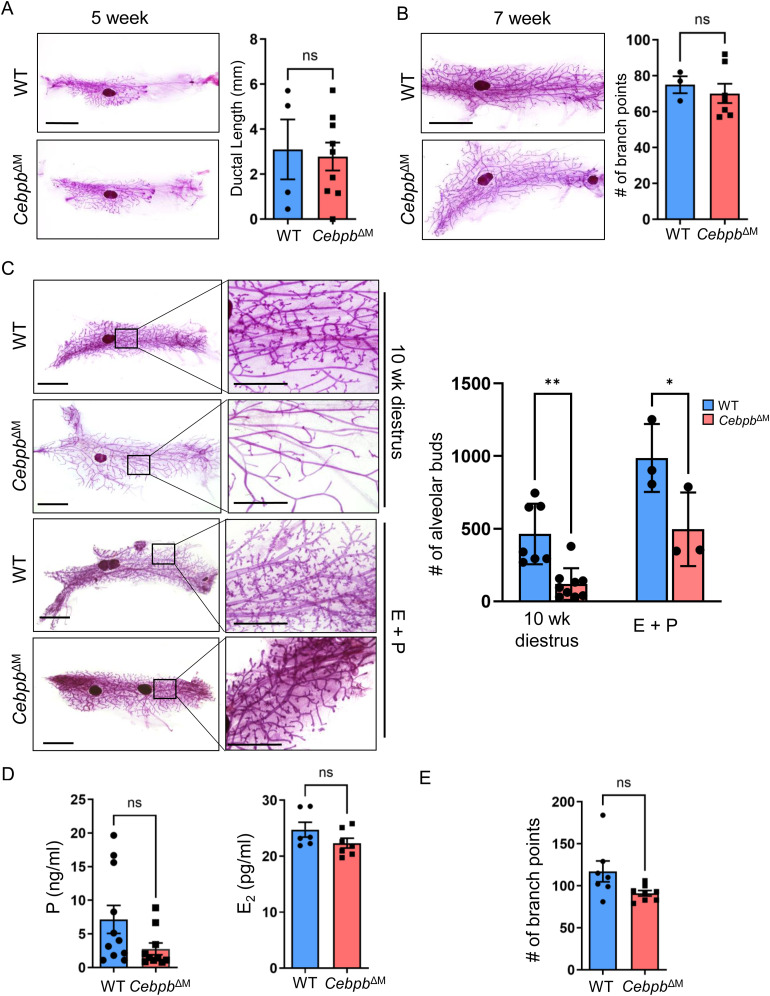
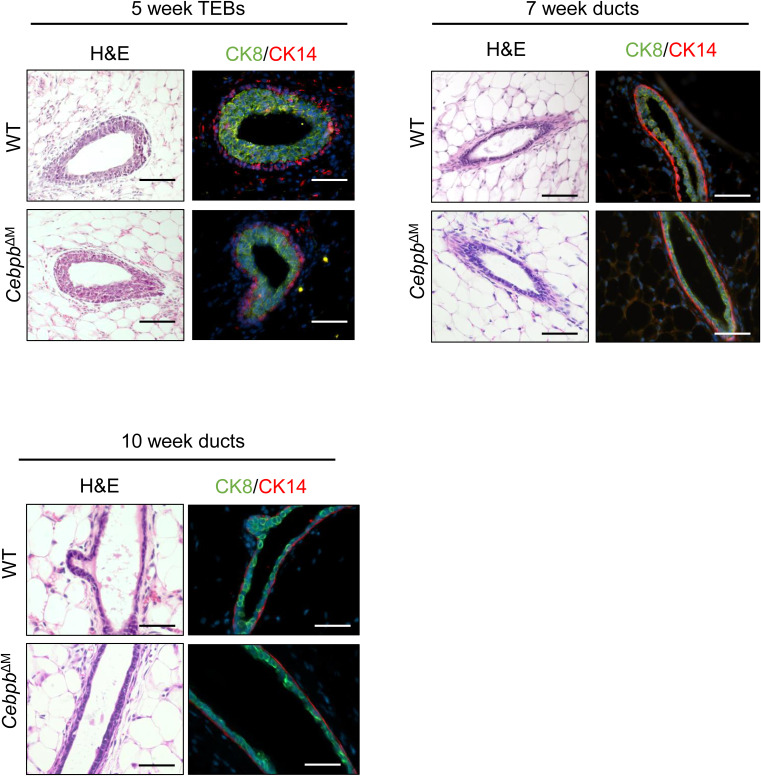
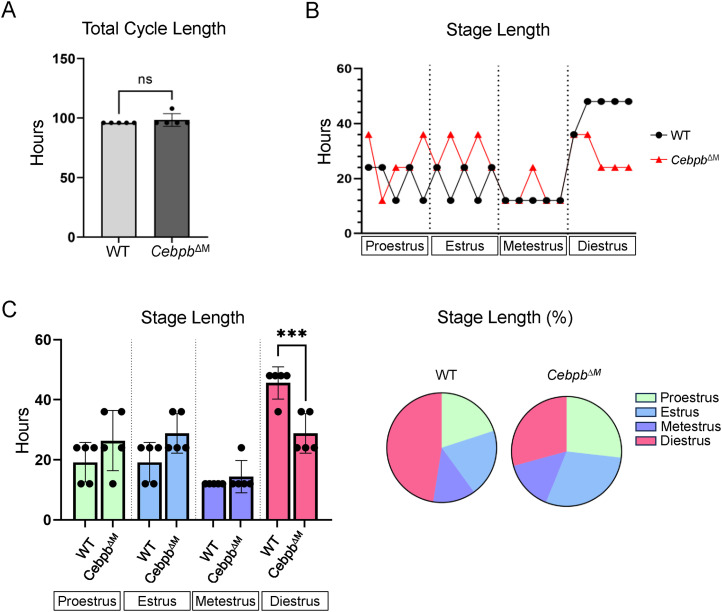
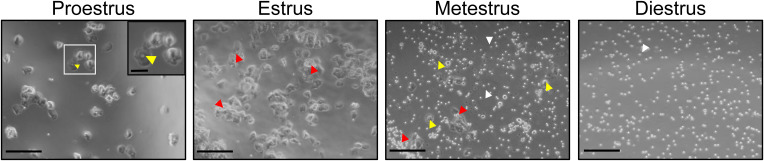
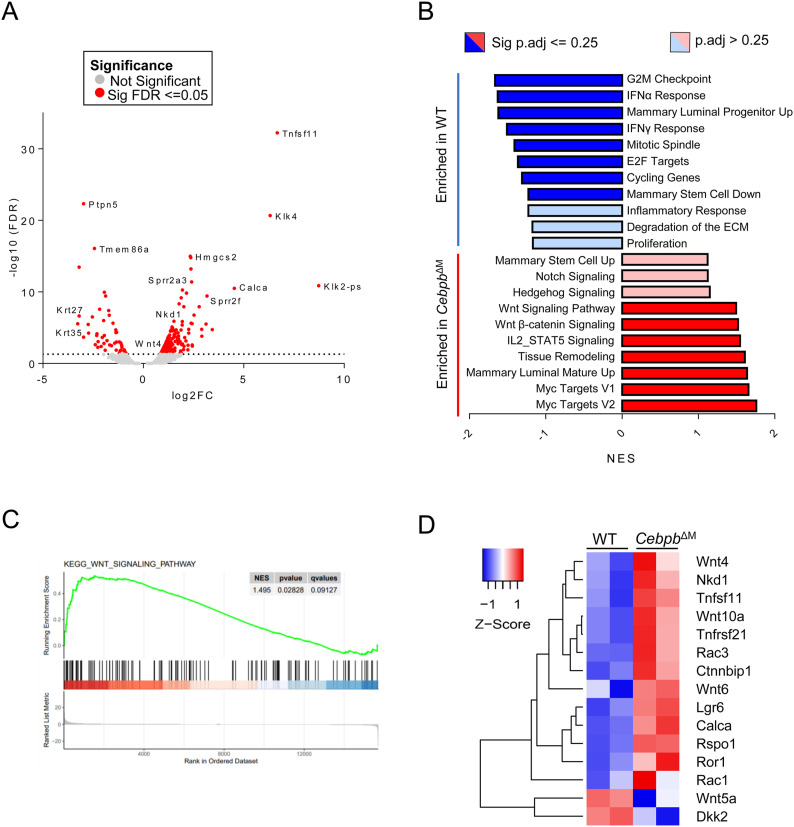
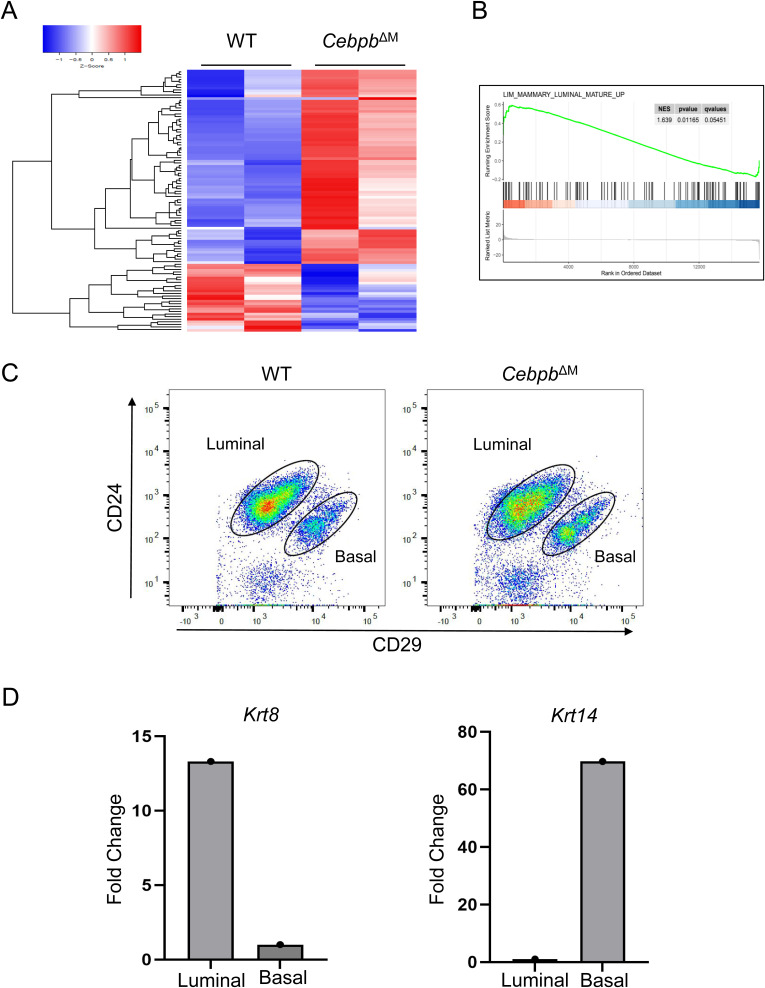
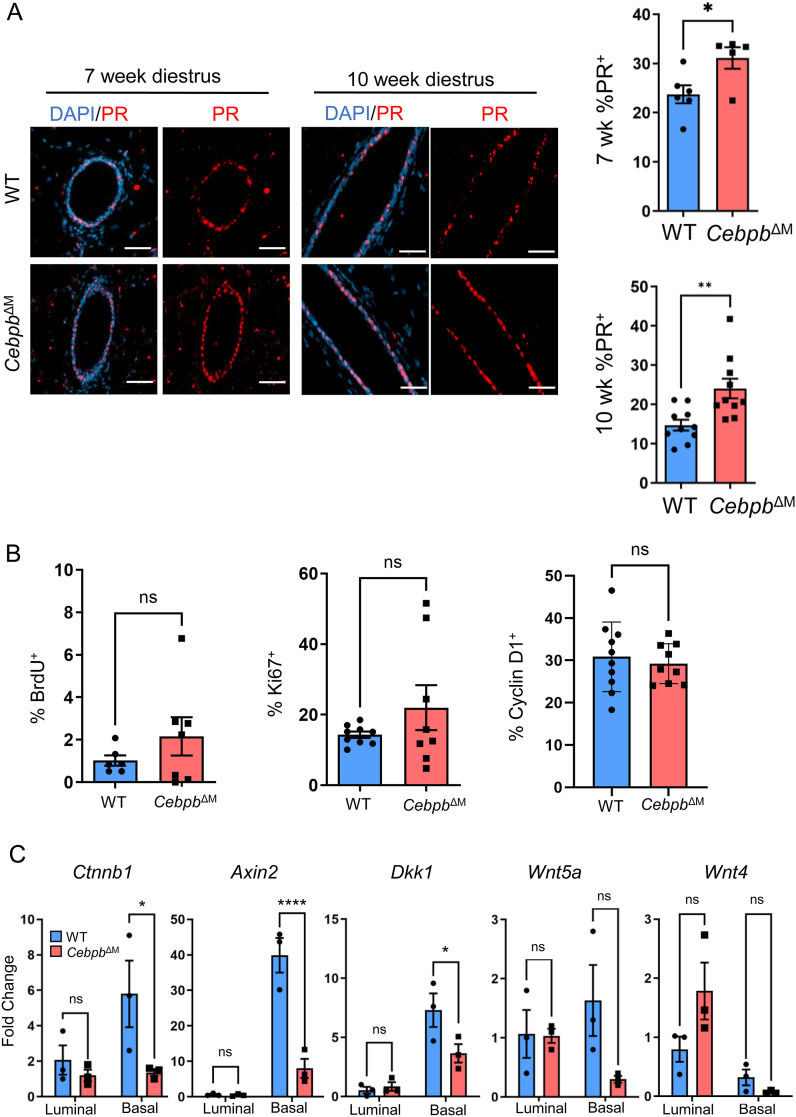
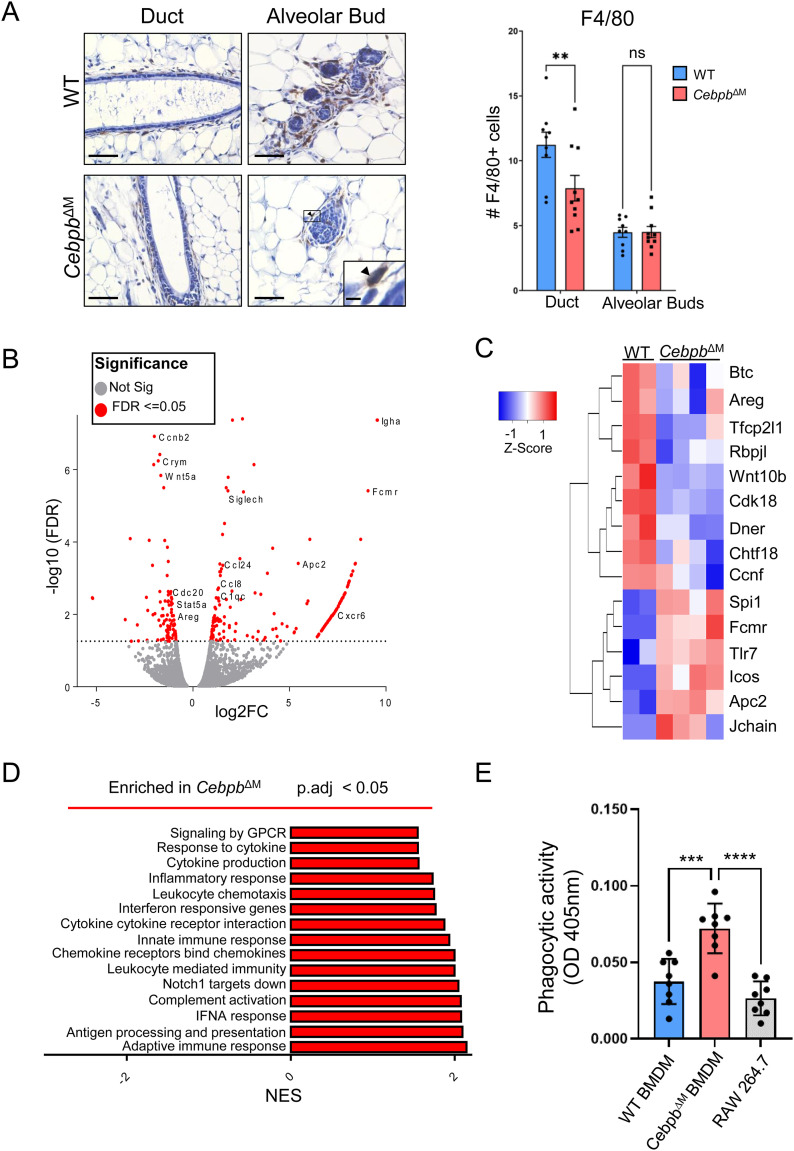
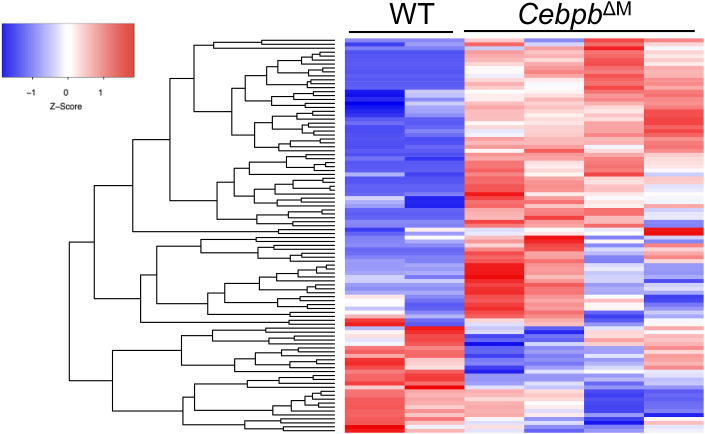
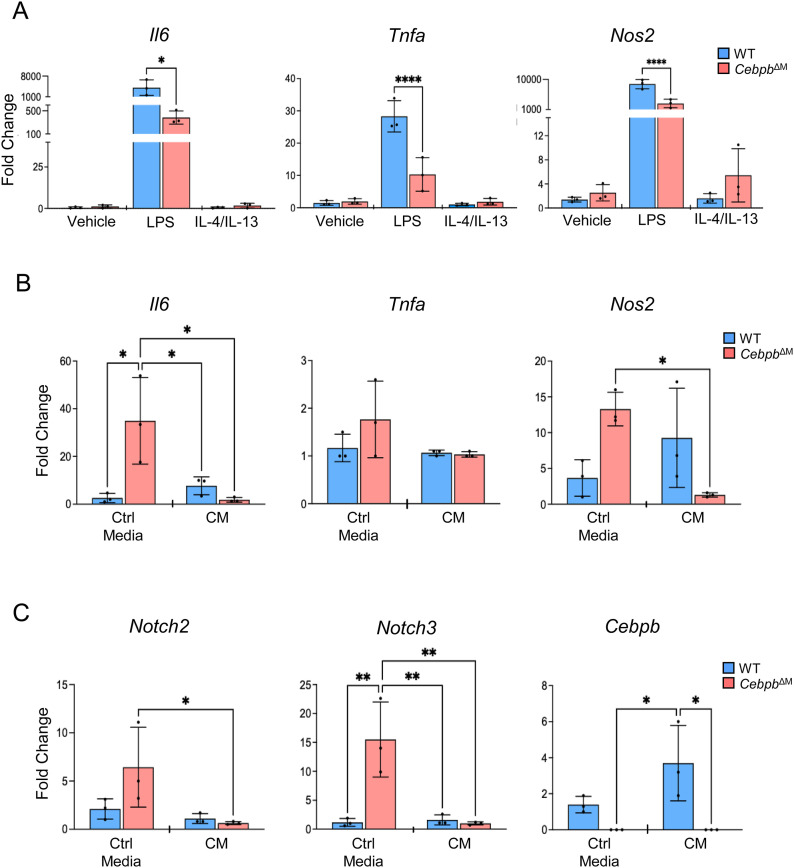
Macrophages have important roles in mammary gland development and tissue homeostasis, but the specific mechanisms that regulate macrophage function need further elucidation. We have identified C/EBPβ as an important transcription factor expressed by multiple macrophage populations in the normal mammary gland. Mammary glands from mice with C/EBPβ-deficient macrophages (Cebpb ΔM) show a significant decrease in alveolar budding during the diestrus stage of the reproductive cycle, whereas branching morphogenesis remains unchanged. Defects in alveolar budding were found to be the result of both systemic hormones and local macrophage-directed signals. RNA sequencing shows significant changes in PR-responsive genes and alterations in the Wnt landscape of mammary epithelial cells of Cebpb ΔM mice, which regulate stem cell expansion during diestrus. Cebpb ΔM macrophages demonstrate a shift from a pro-inflammatory to a tissue-reparative phenotype, and exhibit increased phagocytic capacity as compared to WT. Finally, Cebpb ΔM macrophages down-regulate Notch2 and Notch3, which normally promote stem cell expansion during alveolar budding. These results suggest that C/EBPβ is an important macrophage factor that facilitates macrophage-epithelial crosstalk during a key stage of mammary gland tissue homeostasis.


Conflict of interest statement

The authors declare that they have no conflict of interest.

Figures

Figure 1.
Figure 1.. C/EBPβ is expressed in mammary gland macrophages.
(A) t-SNE plot shows scRNA-seq analysis of CD45+ cells isolated from mammary glands of 10-wk-old FVB mice (30), where dotted line indicates putative macrophage populations. Feature plots depict Cebpb, Csf1r, Cx3cr1, and Lyve1. (B) Representative 20X images depict immunostaining of mammary glands from 10-wk-old diestrus-staged WT mice. CSF1R+ (green) and C/EBPβ+ (red) cells in the adjacent (left) and distal (right) stroma (n = 3). Orange arrows show macrophage C/EBPβ, and white arrows show epithelial C/EBPβ. Scale bar = 50 μm. Inset scale bar = 10 μm. (C) Representative 20X images of immunostaining for CSF1R (green) and p-C/EBPβ-Thr235 (red) in WT mammary glands (n = 3). Orange arrows show macrophage p-C/EBPβ, and white arrows show epithelial p-C/EBPβ. Scale bar = 50 μm. Inset scale bar = 10 μm.
Figure 2.
Figure 2.. Deletion of Cebpb in macrophages.
(A) Representative 40X confocal imaging of whole glands from WT and CebpbΔM mice bred to RosamTmG reporter mice. Creneg cells express dTomato (red), and cells that have undergone Cre recombination express GFP (green) (n = 3). Scale bar = 40 μm. (B) Immunoblot of C/EBPβ (LAP1, LAP2, LIP) in RAW 264.7 cells, WT BMDMs, and CebpbΔM BMDMs (n = 3). (C) Graph shows qRT-PCR analysis of Cebpb from vehicle- or LPS-treated BMDMs from WT and CebpbΔM mice (three mice per group). Values represent the mean and SD (***P = 0.0001, one-way ANOVA with multiple comparisons). (D) Representative 20X images depicting immunostaining for C/EBPβ (red) and CSF1R (green) in WT and CebpbΔM mice (three mice per group). Orange arrows show macrophage C/EBPβ, white arrows show epithelial C/EBPβ, and green arrows show macrophages where C/EBPβ has been deleted. Scale bar = 50 μm. Inset scale bar = 10 μm.
Figure 3.
Figure 3.. Cebpb deletion in macrophages impairs alveolar budding in the adult mammary gland.
(A) Representative whole-mount images of carmine alum–stained mammary glands at 5 wk of age (scale bar = 5 mm) from WT and CebpbΔM mice. The graph shows the quantification of ductal elongation by measuring the distance (mm) from the center of the lymph node to the most distal tip of a TEB (P = 0.80, unpaired t test) (four to eight mice per group). (B) Whole mounts of mammary glands from 7-wk-old animals harvested in diestrus (scale bar = 5 mm). The graph depicts the quantification of branching morphogenesis, analyzed by counting the branch points in the entire gland (P = 0.60, unpaired t test) (three to seven mice per group). (C) Left: whole mounts of mammary glands from 10-wk-old animals harvested in diestrus or after E+P treatment, showing changes in alveolar budding in CebpbΔM glands as compared to WT (scale bar = 5 mm). Higher magnification (right), scale bar = 2 mm. Right: the graph depicts the quantification of alveolar budding after counting all alveolar buds in an entire gland (**P = 0.006, *P = 0.02, one-way ANOVA with multiple comparisons) (three to nine mice per group). (D) Plasma was collected from 10-wk-old WT and CebpbΔM mice in diestrus and analyzed for progesterone (left) and estradiol (right). Graphs depict levels of progesterone in ng/ml (P = 0.08, unpaired t test) and estradiol in pg/ml (P = 0.15, unpaired t test) from 6 to 11 mice per group. (E) Quantification of branching morphogenesis (P = 0.51, unpaired t test) in 10-wk-old diestrus-staged animals from seven to nine mice per group.
Figure S1.
Figure S1.. CebpbΔM mice have normal ductal morphology.
Representative 20X images depicting H&E staining and immunostaining (CK8: green; CK14: red) of TEBs of 5-wk-old mammary glands (top left), ducts of 7-wk-old mammary glands from diestrus-staged mice (top right), and ducts of 10-wk-old mammary glands from diestrus-staged mice (bottom left) (n = 3–6; scale bar = 40 μm).
Figure 4.
Figure 4.. CebpbΔM mice have a shorter diestrous stage.
Reproductive cycle was tracked by vaginal cytology over a period of eight consecutive days (five mice per group, 10 wk of age). Graphs are represented in hours, which was calculated by dividing the number of days in each cycle by 2 (to represent one cycle) and then multiplied by 24 to determine the number of hours. (A) Graph depicts the total cycle length of one complete reproductive cycle of WT and Cebpb∆M mice (P = 0.35, unpaired t test). (B) Graph shows the number of hours each individual mouse spent in each stage of the estrous cycle. (C) Bar graph shows the number of hours spent in each stage of the estrous cycle (***P = 0.001, one-way ANOVA with multiple comparisons). Pie charts represent the percentage of time spent in each stage of the estrous cycle.
Figure S2.
Figure S2.. Estrous staging.
Vaginal cytology was imaged with a Zeiss Axio Observer inverted microscope with phase contrast, and stages were determined by identifying nucleated or corneated epithelial cells, or leukocytes: pro-estrus, enlarged nucleated epithelial cells (yellow arrows); estrus, enlarged corneated epithelial cells (red arrows); metestrus, nucleated epithelial cells, corneated epithelial cells, and leukocytes (white arrows); diestrus, leukocytes. Scale bar = 100 μm; inset scale bar = 50 μm.
Figure 5.
Figure 5.. Gene expression analysis of mammary epithelial cells from CebpbΔM mice.
RNA sequencing was performed on mammary epithelial cells (MECs) isolated from 10-wk-old diestrus-staged WT and CebpbΔM mice. (A) Volcano plot representation of differentially expressed genes in CebpbΔM MECs as compared to WT. Red points mark the genes with significantly increased or decreased expression (P-adjusted <=0.05). The x-axis shows log fold changes and the y-axis the −log10 (FDR). (B) Gene set enrichment analysis identifies unique pathways enriched in WT (blue) MECs and in CebpbΔM (red) MECs. Pathways were placed in order of the normalized enrichment score (P-adjusted <= 0.25). (C) Gene set enrichment analysis of the KEGG Wnt signaling pathway (P-adjusted = 0.12) enriched in WT MECs compared with CebpbΔM MECs. (D) Heatmap depicts the differential gene expression of selected genes in WT and CebpbΔM MECs. Genes regulated by PR or expressed in the Wnt pathway are represented, where red indicates higher expression, and blue indicates lower expression.
Figure S3.
Figure S3.. Analysis of mammary epithelial cells from CebpbΔM mice.
(A) Heatmap depicts the top 100 differentially expressed genes in CebpbΔM MECs compared with WT, with red indicating higher expression and blue indicating lower expression. (B) Gene set enrichment analysis of Mammary Luminal Mature Up (P = 0.062) depicting WT MECs are enriched for genes expressed in mature luminal epithelial cells. (C) Dot plots show sorting strategy for luminal (CD45CD24+CD29Lo) and basal (CD45CD24+CD29Hi) cell populations from MECs isolated from the mammary glands of 10-wk-old diestrus-staged mice (three to six mice per group, with representative plots from one biological replicate). (D) qRT-PCR analysis of Krt8 and Krt14 of luminal and basal cells from WT BALB/c mice. One representative biological replicate is depicted (five mice were analyzed separately for five biological replicates).
Figure 6.
Figure 6.. Altered expression of the PR and Wnt pathway in the CebpbΔM mammary epithelium.
(A) Representative images from 7-wk-old (20X, scale bar = 50 μm) or 10-wk-old (40X, scale bar = 40 μm) WT and CebpbΔM mice harvested in diestrus, depicting PR (red) expression. Graphs show the quantification of PR+ mammary epithelial cells expressed as a percentage of epithelial cells. A minimum of 500 DAPI ductal cells were counted, divided by the number of PR+ cells, and multiplied by 100 to calculate the percent of PR+ cells. Values are the mean and SEM from 5 to 10 mice per group (*P = 0.03, **P = 0.004, unpaired t test). (B) Percent of ductal epithelial cells expressing BrdU (P = 0.28), Ki67 (P = 0.22), or cyclin D1 (P = 0.61), where a minimum of 500 DAPI ductal cells were counted, divided by the number of marker-specific positive cells, and multiplied by 100 to calculate the percent of proliferating cells. Values are shown as the mean and SEM from 6 to 10 mice per group of 10-wk-old diestrus-staged mice (unpaired t test). (C) MECs were isolated from the mammary glands of 10-wk-old diestrus-staged mice and FACS-sorted for luminal (CD45CD24+CD29Lo) and basal (CD45CD24+CD29Hi) epithelium. Graphs show qRT-PCR for alterations in the Wnt signaling pathway using primers to Ctnnb1 (*P = 0.04), Axin2 (****P < 0.0001), Dkk1 (*P = 0.05), Wnt5a (P = 0.12), and Wnt4 (P = 0.05). Values shown are the mean and SD (two-way ANOVA with multiple comparisons, three mice per group).
Figure 7.
Figure 7.. Altered gene expression and function in CebpbΔM macrophages.
(A) Representative 40X images (inset 200X) of F4/80 immunostaining in 10-wk-old mammary glands from WT and CebpbΔM diestrus-staged mice (five mice per group) (scale bar = 40 μm; inset scale bar = 0.2 μm; arrow depicts F4/80+ cell). The graph shows the quantitation of the average number of F4/80+ cells per FOV. A minimum of five FOV (at least five ductal or five alveolar buds) were counted for each group (**P = 0.006, two-way ANOVA with multiple comparisons). (B) Volcano plot representation of differentially expressed genes in CebpbΔM macrophages as compared to WT. Red points mark the genes with significantly increased or decreased expression (−log10[FDR] > 2). (C) Heatmap depicts differentially expressed genes in CebpbΔM macrophages compared with WT. (D) GSEAs showing pathways enriched in CebpbΔM macrophages. Pathways were placed in order of the normalized enrichment score (P-adjusted <0.05). (E) Phagocytic activity of BMDMs from WT and CebpbΔM mice measured by absorbance (OD 405 nm) using Phagocytosis Assay Kit, where CebpbΔM BMDMs have increased ability to phagocytose Zymosan particles. RAW 264.7 cells serve as a positive control. Values are the mean and SEM (***P = 0.0002, ****P < 0.0001, one-way ANOVA with multiple comparisons). Eight technical replicates are shown for one representative experiment, and the experiment was performed three times (three biological replicates).
Figure S4.
Figure S4.. Differentially expressed genes in CebpbΔM macrophages.
Heatmap depicts the top 100 differentially expressed genes in CebpbΔM macrophages compared with WT, with red indicating higher expression and blue indicating lower expression.
Figure 8.
Figure 8.. CebpbΔM macrophages have the reduced expression of pro-inflammatory cytokines and Notch.
(A) BMDMs from WT and CebpbΔM mice (three mice per group) were treated with vehicle, LPS (4 μg/ml), or IL-4 (20 ng/ml) and IL-13 (20 ng/ml) for 24 h, and qRT-PCR was performed using primers to Il6 (*P = 0.01), Tnfa (****P < 0.0001), and Nos2 (****P < 0.0001). (B, C) BMDMs from WT and CebpbΔM mice (three mice per group) were treated with control (unconditioned) media or HC11 conditioned media for 72 h, and qRT-PCR was performed using primers to Il6 (*P < 0.03), Tnfa, Nos2 (*P = 0.02), Notch2 (*P = 0.04), Notch3 (**P < 0.004), and Cebpb (*P = 0.01). For all data, the mean and SD are represented (one-way ANOVA with multiple comparisons).

References

    1. Davies LC, Jenkins SJ, Allen JE, Taylor PR (2013) Tissue-resident macrophages. Nat Immunol 14: 986–995. 10.1038/ni.2705 - DOI - PMC - PubMed
    1. Chua AC, Hodson LJ, Moldenhauer LM, Robertson SA, Ingman WV (2010) Dual roles for macrophages in ovarian cycle-associated development and remodelling of the mammary gland epithelium. Development 137: 4229–4238. 10.1242/dev.059261 - DOI - PubMed
    1. Gabanyi I, Muller PA, Feighery L, Oliveira TY, Costa-Pinto FA, Mucida D (2016) Neuro-immune interactions drive tissue programming in Intestinal macrophages. Cell 164: 378–391. 10.1016/j.cell.2015.12.023 - DOI - PMC - PubMed
    1. Gouon-Evans V, Rothenberg ME, Pollard JW (2000) Postnatal mammary gland development requires macrophages and eosinophils. Development 127: 2269–2282. 10.1242/dev.127.11.2269 - DOI - PubMed
    1. Gyorki DE, Asselin-Labat ML, van Rooijen N, Lindeman GJ, Visvader JE (2009) Resident macrophages influence stem cell activity in the mammary gland. Breast Cancer Res 11: R62. 10.1186/bcr2353 - DOI - PMC - PubMed

Substances