. 2024 Jul 18;15(1):6057.
doi: 10.1038/s41467-024-50060-2.

Large-scale photonic network with squeezed vacuum states for molecular vibronic spectroscopy

Affiliations

Large-scale photonic network with squeezed vacuum states for molecular vibronic spectroscopy

Hui Hui Zhu et al. Nat Commun. .

Abstract

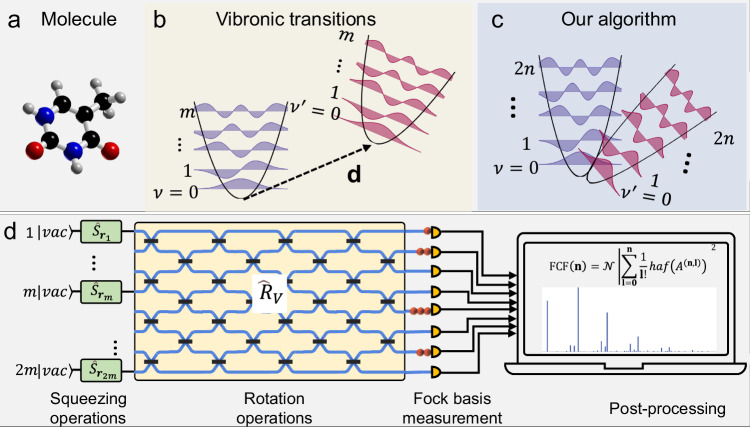
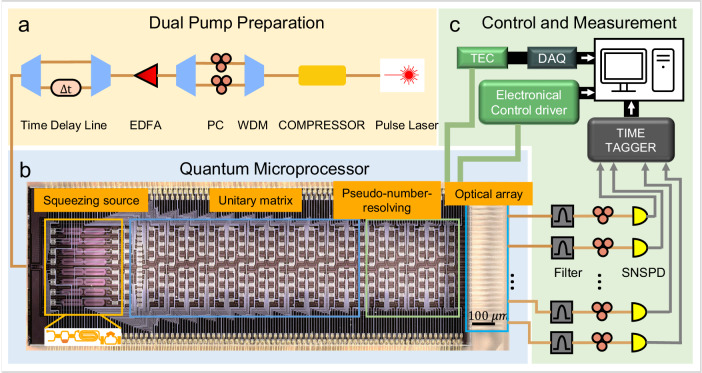
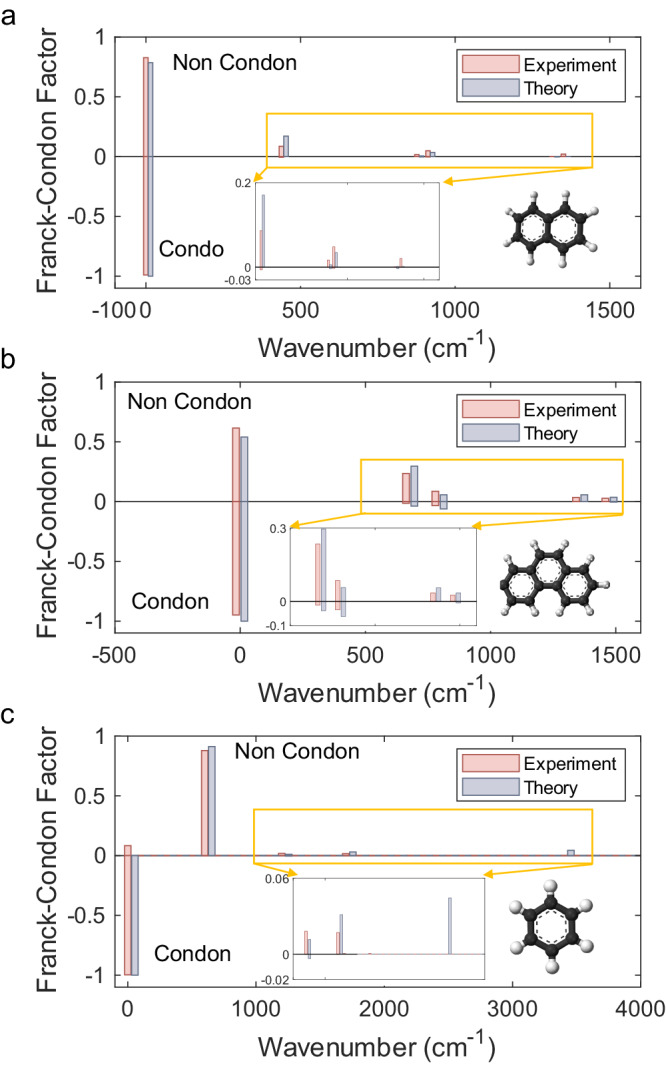
Although molecular vibronic spectra generation is pivotal for chemical analysis, tackling such exponentially complex tasks on classical computers remains inefficient. Quantum simulation, though theoretically promising, faces technological challenges in experimentally extracting vibronic spectra for molecules with multiple modes. Here, we propose a nontrivial algorithm to generate the vibronic spectra using states with zero displacements (squeezed vacuum states) coupled to a linear optical network, offering ease of experimental implementation. We also fabricate an integrated quantum photonic microprocessor chip as a versatile simulation platform containing 16 modes of single-mode squeezed vacuum states and a fully programmable interferometer network. Molecular vibronic spectra of formic acid and thymine under the Condon approximation are simulated using the quantum microprocessor chip with high reconstructed fidelity ( > 92%). Furthermore, vibronic spectra of naphthalene, phenanthrene, and benzene under the non-Condon approximation are also experimentally simulated. Such demonstrations could pave the way for solving complicated quantum chemistry problems involving vibronic spectra and computational tasks beyond the reach of classical computers.


Conflict of interest statement

The authors declare no competing interests.

Figures

Fig. 1
Fig. 1. A squeezed vacuum state and a linear photonic network for molecular vibronic spectroscopy.
a Molecular structure. b A vibronic transition of a molecule includes displacement, squeezing and rotation operations. c In our algorithm, by extending m vibronic modes to 2 m optical modes and applying straightforward rotation and squeezing operations, it is sufficient to reproduce vibronic spectra. d Photonic quantum circuit model, by translating the Doktorov operator to squeezing operators S^r and rotation operator R^V. Output photon sampling distribution followed by post-processing can generate the vibronic spectroscopy of the molecule.
Fig. 2
Fig. 2. Schematic of a quantum microprocessor chip and experimental setup.
a Setup to generate single-mode squeezing using dual pumps from 2-ps laser pulses, consisting of an optical pulse compressor, an erbium-doped fiber amplifier (EDFA), wavelength-division multiplexers (WDM), and a polarization controller (PC). The two pumps at the wavelength of 1546 nm and 1553 nm are selected and combined using WDM and coupled into the chip through a grating coupler. b Photograph of the microprocessor chip. Spiral sources are used to produce a vacuum-squeezed state. Programmable interferometer network is designed to achieve an arbitrary unitary matrix, and on-chip beam splitters are used for pseudo-number-resolving detection. Input single pump light is coupled to the chip by a one-dimensional subwavelength grating coupler. Output photons are coupled by edge couplers to fiber arrays. The scale bar denotes 100 μm. c An overview of off-chip control and measurement devices, including temperature controller (TEC), electrical modulators, output photon detection (Time Tagger), Analog-to-Digital Converter (DAQ), and data processing with a server computer.
Fig. 3
Fig. 3. Vibronic spectra reconstruction.
Franck−Condon profiles are obtained from chip distributions programmed according to the vibronic transitions of formic acid (a, with the structure shown in the inset) and thymine (b, with the structure shown in the inset). Gray bar graphs depict the histogram of energies, whereas red and blue continuous curves show the Lorentzian broadening of the bars.
Fig. 4
Fig. 4. Vibronic spectra with non-Condon effects.
Non-Condon and Franck−Condon profiles are obtained from chip distributions programmed according to the vibronic transitions of naphthalene (a, with structure shown in the inset), phenanthrene (b, with the structure shown in the inset), and benzene (c, with the structure shown in the inset). Red bar graphs depict the histogram of experimental energies, whereas blue bars show the theoretical results. Insets are enlarged parts of small peaks.

References

    1. Sharp TE, Rosenstock HM. Franck–Condon factors for polyatomic molecules. J. Chem. Phys. 1964;41:3453–3463. doi: 10.1063/1.1725748. - DOI
    1. Bromley, T. R., Arrazola, J. M. & Jahangiri, S. Applications of near-term photonic quantum computers: software and algorithms. Quantum Sci. Technol.5, 034010 2020.
    1. Doktorov EV, Malkin IA, Man’ko VI. Dynamical symmetry of vibronic transitions in polyatomic molecules and the Franck–Condon principle. J. Mol. Spectrosc., 1977;64:302–326. doi: 10.1016/0022-2852(77)90269-7. - DOI
    1. Malmqvist P-Å, Forsberg N. Franck–Condon factors for multidimensional harmonic oscillators. Chem. Phys. 1998;228:227–240. doi: 10.1016/S0301-0104(97)00347-9. - DOI
    1. Ruhoff PT, Ratner MA. Algorithm for computing Franck–Condon overlap integrals. Int. J. Quant. Chem. 2000;77:383–392. doi: 10.1002/(SICI)1097-461X(2000)77:1<383::AID-QUA38>3.0.CO;2-0. - DOI

LinkOut - more resources