. 2024 Jul 18;15(1):6043.
doi: 10.1038/s41467-024-50450-6.

Necroptosis enhances 'don't eat me' signal and induces macrophage extracellular traps to promote pancreatic cancer liver metastasis

Affiliations

Necroptosis enhances 'don't eat me' signal and induces macrophage extracellular traps to promote pancreatic cancer liver metastasis

Cheng-Yu Liao et al. Nat Commun. .

Abstract

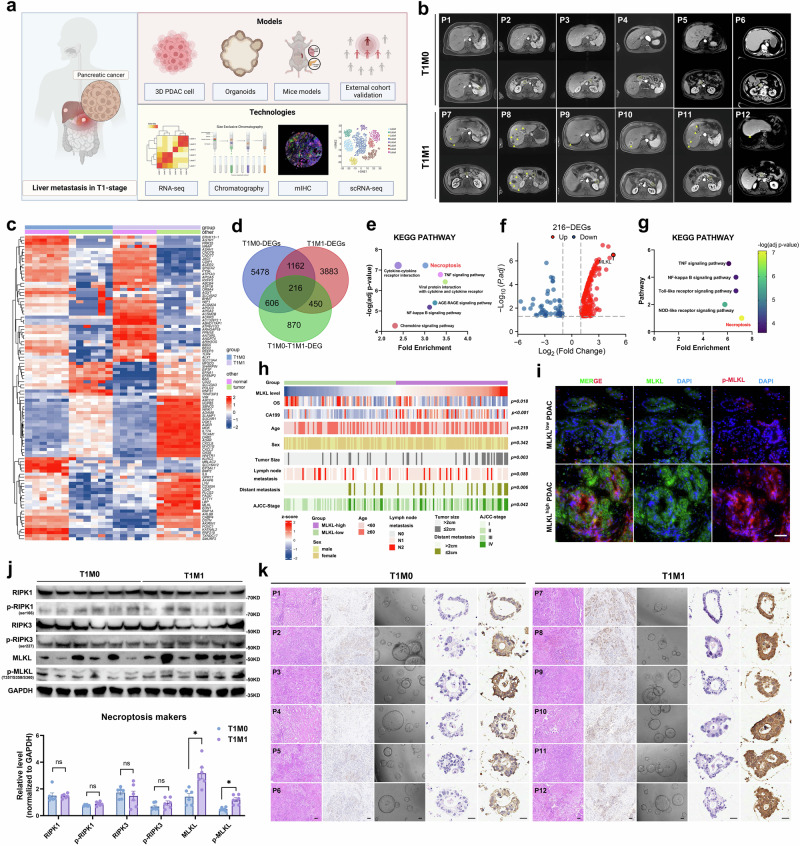
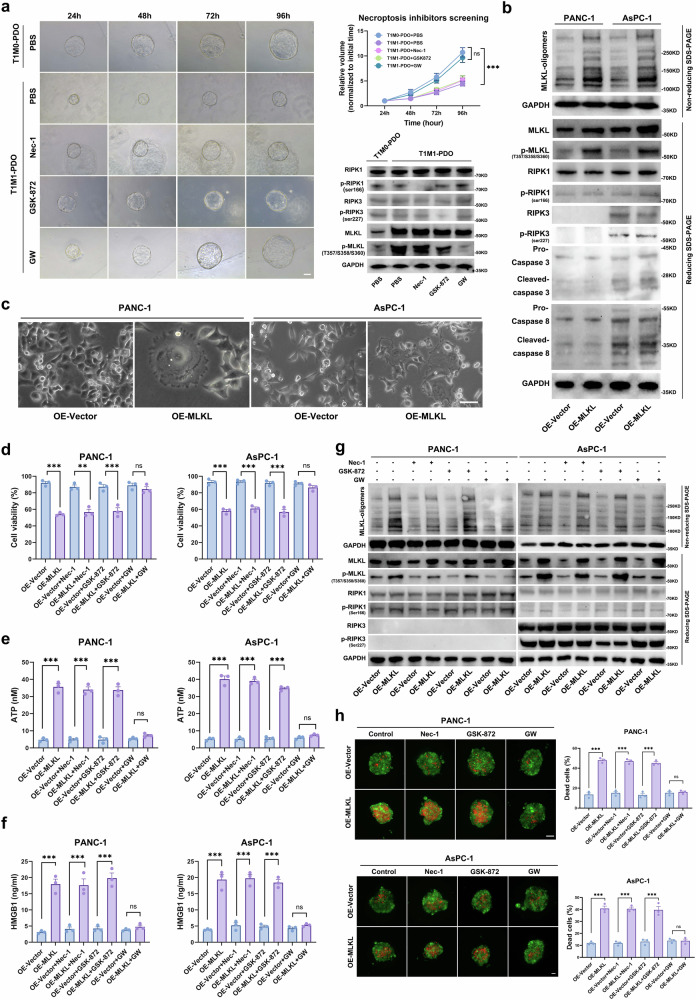
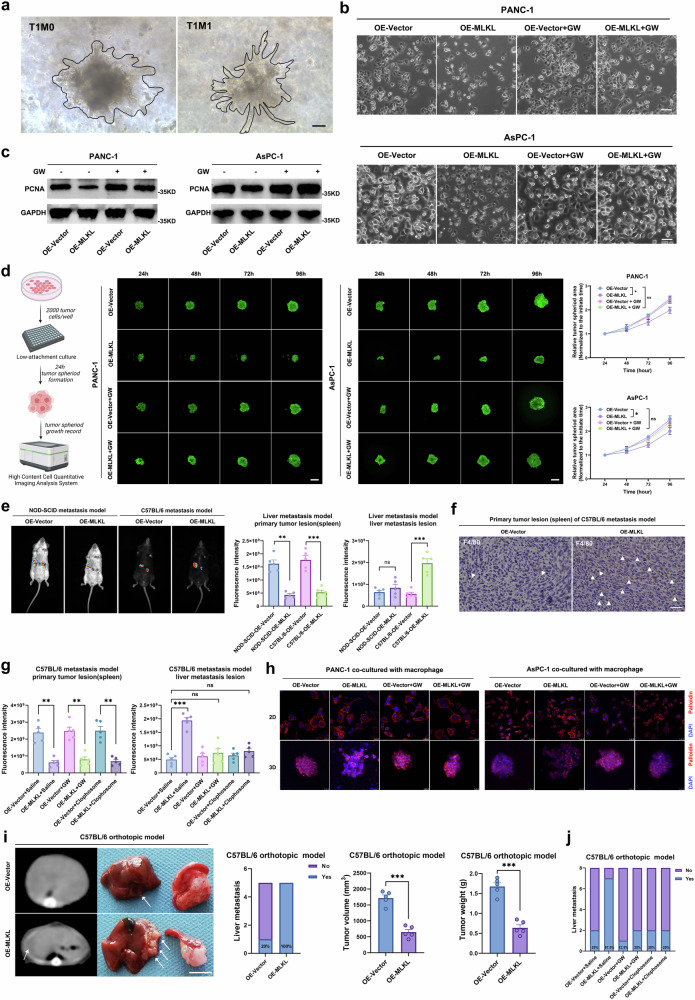
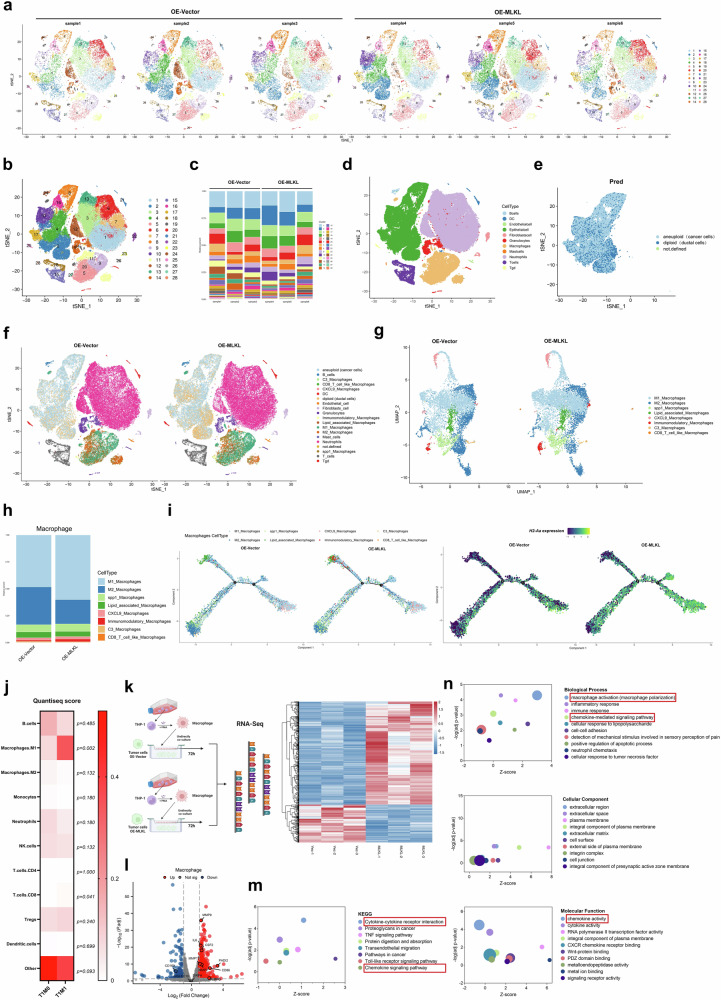
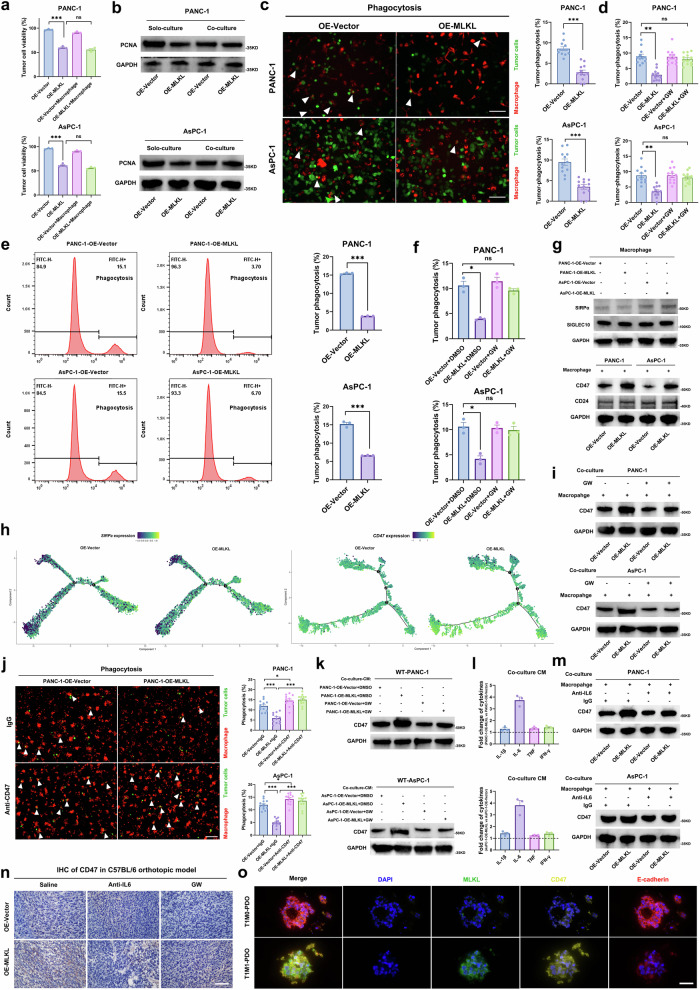
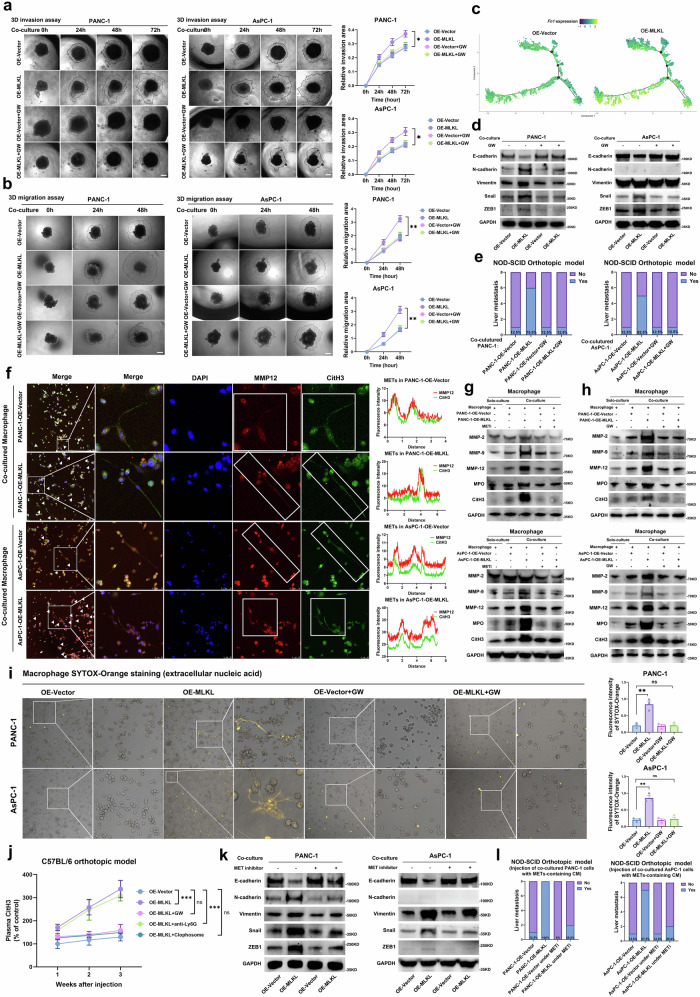
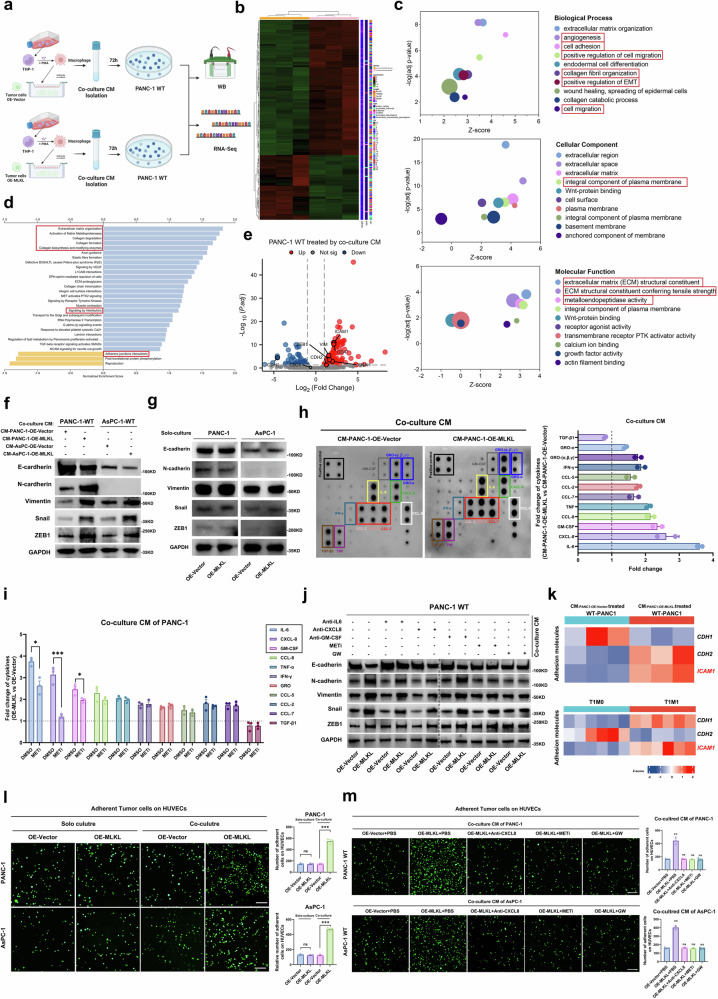
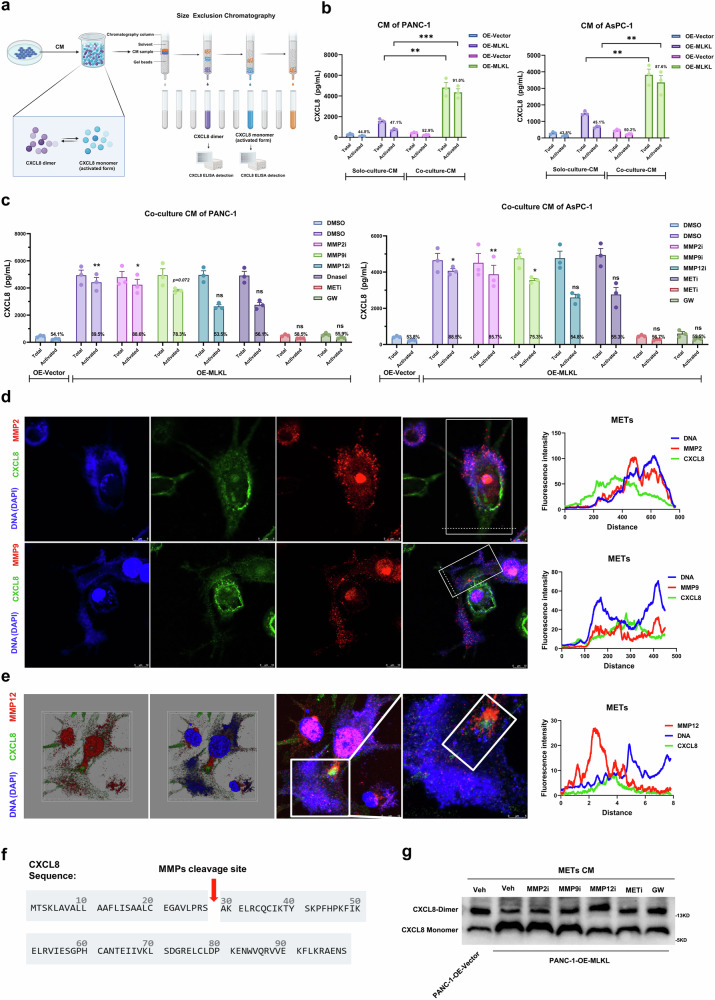
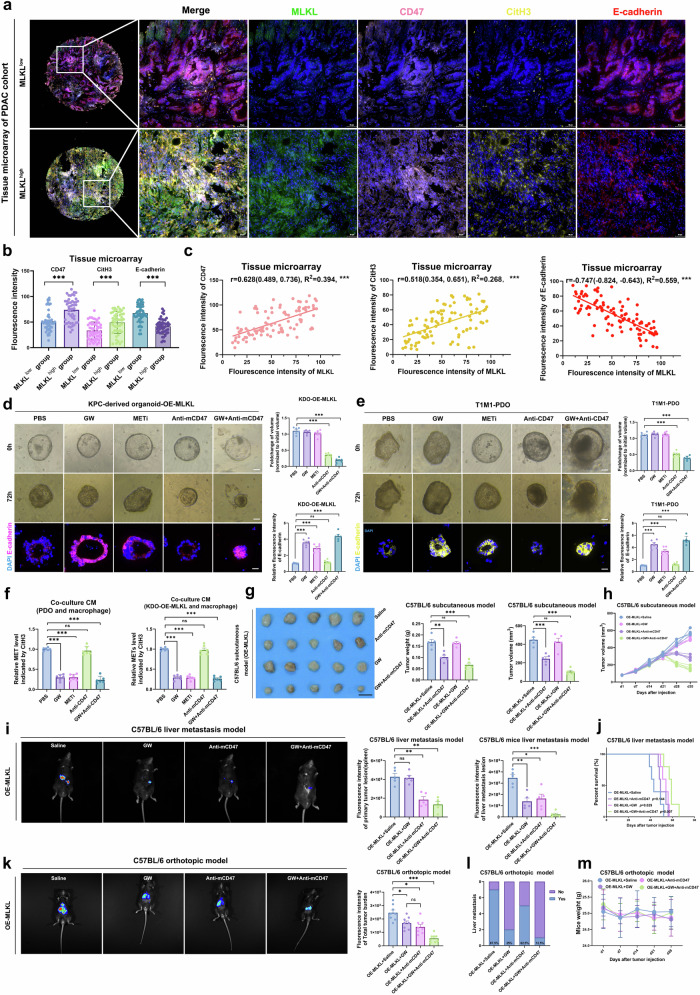
Pancreatic ductal adenocarcinoma (PDAC) is a devastating cancer with dismal prognosis due to distant metastasis, even in the early stage. Using RNA sequencing and multiplex immunofluorescence, here we find elevated expression of mixed lineage kinase domain-like pseudo-kinase (MLKL) and enhanced necroptosis pathway in PDAC from early liver metastasis T-stage (T1M1) patients comparing with non-metastatic (T1M0) patients. Mechanistically, MLKL-driven necroptosis recruits macrophages, enhances the tumor CD47 'don't eat me' signal, and induces macrophage extracellular traps (MET) formation for CXCL8 activation. CXCL8 further initiates epithelial-mesenchymal transition (EMT) and upregulates ICAM-1 expression to promote endothelial adhesion. METs also degrades extracellular matrix, that eventually supports PDAC liver metastasis. Meanwhile, targeting necroptosis and CD47 reduces liver metastasis in vivo. Our study thus reveals that necroptosis facilitates PDAC metastasis by evading immune surveillance, and also suggest that CD47 blockade, combined with MLKL inhibitor GW806742X, may be a promising neoadjuvant immunotherapy for overcoming the T1M1 dilemma and reviving the opportunity for radical surgery.


Conflict of interest statement

The authors declare no competing interests.

Figures

Fig. 1
Fig. 1. Aberrant MLKL elevation-mediated necroptosis is associated with liver metastasis of early T stage PDAC.
a The overall experimental scheme used in this study. b MRI of T1M1 (n = 6) and T1M0 (n = 6) PDAC patients. Yellow arrow: liver metastasis; yellow circle: primary pancreatic tumour. c Matrix diagram of RNA-seq data from T1M0-PDAC (n = 6) and T1M1-PDAC (n = 6) samples. d Venn diagram illustrating the overlap between differentially expressed genes (DEGs) between the tumour and normal groups and the T1M1 and T1M0 PDAC groups. e KEGG pathway enrichment analysis of DEGs between the T1M0 and T1M1 PDAC groups. f Volcano plot of the final 216 DEGs. g KEGG pathway enrichment analysis of the final 216 DEGs. h Heatmap of clinicopathological features, genetic profiles, and survival information among groups with different MLKL expression levels (n = 170) in the cohort from our centre. The two-sided Pearson chi-square test and were used to assess the differences between the two groups; overall survival (OS) probability was compared using log-rank test, two-sided. i Representative images of immuno-stained MLKL and p-MLKL(T357/S358/S360) in the PDCA cohort (n = 20) from our centre; Scale bar: 50 μm. j WB and quantification of necroptosis markers in tumour samples from patients with T1M0-PDAC (n = 6) and T1M1-PDAC (n = 6). k Representative images following H&E staining and IHC staining (MLKL) of T1M0 and T1M1 PDAC primary tumour organoids. Organoids were constructed from primary tumours that performed RNA-seq of T1M1 and T1M1 PDAC patients who underwent MRI. n = 6 biologically independent samples for each group, Scale bar: 50 μm. Unless specified otherwise, the data are presented as means ± SEM (error bar) and compared using the two-sided Student’s t test; *P < 0.05; **P < 0.01; and ***P < 0.001; ns, no significance. a Created with BioRender.com released under a Creative Commons Attribution-NonCommercial-NoDerivs 4.0 International license (https://creativecommons.org/licenses/by-nc-nd/4.0/deed.en). Source data are provided as a Source Data file.
Fig. 2
Fig. 2. Necroptosis mediated by an aberrant elevation of MLKL is RIPK3-independent.
a Representative images of T1M1 PDAC PDOs and T1M0 PDAC PDOs at 24 h and 96 h after treatment with PBS (control) or different necroptosis inhibitors. The inhibitors Nec-1 (50 µM, a RIPK1 inhibitor), GSK-872 (3 µM, a RIPK3 inhibitor), and GW (1 µM, an MLKL inhibitor) were applied, and a diagram shows construction of the PDOs used for screening of the necroptosis inhibitors. Changes in the relative volume of T1M1 PDAC PDOs and T1M0 PDAC PDOs that received different treatments and the results of WB analysis of necroptosis markers in PDOs treated with necroptosis inhibitors are shown; n = 6 biologically independent samples for each group, Scale bar: 50 μm. b WB analysis of necroptosis and apoptosis markers; n = 3 biologically independent samples. c Cell morphology. Scale bar: 25 μm. d Cell viability assay at 72 h after MLKL transfection; n = 3 biologically independent samples. e ATP levels in the supernatant 72 h after MLKL transfection; n = 3 biologically independent samples. f HMGB1 levels in the supernatant 72 h after MLKL transfection, n = 3 biologically independent samples. g WB analysis of necroptosis markers after 48 h treatment with different necroptosis inhibitors. The inhibitors used were Nec-1 (50 µM, a RIPK1 inhibitor), GSK-872 (3 µM, a RIPK3 inhibitor), and GW (1 µM, an MLKL inhibitor); n = 3 biologically independent samples. h The necrosis of 3D tumour spheroids based on propidium iodide staining (red) and quantification of the data; n = 3 biologically independent samples; Scale bar: 100 μm. Unless specified otherwise, the data are presented as means ± SEM (error bar) and compared using the two-sided Student’s t test; *P < 0.05; **P < 0.01; and ***P < 0.001; ns, no significance. Source data are provided as a Source Data file.
Fig. 3
Fig. 3. MLKL-driven necroptosis leads to immune-dependent promotion of PDAC liver metastasis despite suppression of cell proliferation.
a Representative morphology of tumour cells from T1M1 and T1M0 PDAC seeded in organoids Matrigel. n = 6 each group; Scale bar: 25 μm. b Cell morphology; n = 3 biologically independent samples. Scale bar: 25 μm. c WB analysis of PCNA in cells untreated/treated with GW (1 µM) for 48 h; n = 3 biologically independent samples. d Diagram and the growth of 3D tumour spheroid formation assay. Quantified growth curve was evaluated by the tumour volume normalized to the initial volume; n = 3 biologically independent samples; Scale bar: 100 μm. e Bioluminescence imaging and quantification of liver metastasis in representative NOD-SCID and C57B/L6 mice 3 weeks after the injection in liver metastasis model; n = 5 mice per group. f Representative F4/80 IHC images; Triangles indicate F4/80-positive macrophages; Scale bar: 50 μm; n = 5 mice per group. g Bioluminescence of liver metastases and primary spleen nodes of mice received different treatments: saline, GW (100 µM in 50 µl, iv. 3×/week), and depleted of macrophages (clodronate liposomes, 200 µl iv.) three weeks after the injection in liver metastasis model; n = 5 mice per group. h Immunostaining of F-actin (Palloidin, red) and nuclei (DAPI, blue) in 2D tumour cells and 3D tumour spheroids after indirect co-culture with macrophages; n = 3 biologically independent samples; Scale bar: 25 μm. i Micro-CT, gross morphology, and incidence of liver metastases, primary tumour volume and weight quantification in the orthotopic model; White arrow indicates the liver metastasis; The mice were euthanized at 4 weeks after injection; n = 5 mice per group; Scale bar: 5 mm. j Incidence of liver metastasis in orthotopic model after different treatments: saline, GW (100 µM in 50 µl, iv. 3×/week), or macrophage depletion (clodronate liposomes, 200 µl, iv.); n = 8 mice per group; mice were euthanized at 4 weeks after injection. All data are presented as means ± SEM (error bar) and compared using the two-sided Student’s t test; *P < 0.05; **P < 0.01; and ***P < 0.001; ns, no significance. d Created with BioRender.com released under a Creative Commons Attribution-NonCommercial-NoDerivs 4.0 International license (https://creativecommons.org/licenses/by-nc-nd/4.0/deed.en). Source data are provided as a Source Data file.
Fig. 4
Fig. 4. MLKL-driven necroptosis promotes crosstalk between cancer cells and macrophages, leading to macrophage infiltration and activation.
a t-SNE plots of tumour samples from the C57BL/6 orthotopic model mice were generated via scRNA-seq (n = 3 per group). The mice were euthanized 4 weeks after injection. b t-SNE plots of the 28 identified cluster cell populations obtained from the scRNA-seq data. c The proportions of the 28 identified clusters in each sample. d Eleven cell populations were obtained by manual merging in a t-SNE plot on the basis of corresponding marker gene expression. e The epithelial cells were defined into cancer cells (aneuploid) and pancreatic duct cells (diploid) according to the CNV analysis. f tSNE plots from scRNA-seq analysis of OE-vector tumours and OE-MLKL PDAC tumours in C57BL/6 orthotopic model mice and the proportions of the cell types. Aneuploid, cancer cells. g UMAP plots from scRNA-seq analysis of OE-vector tumours and OE-MLKL PDAC tumours in C57BL/6 orthotopic model mice and the proportions of the cell types. h The proportions of different defined macrophage types in the macrophage population. i The single-cell trajectory of macrophages coloured by original cluster identity and the pseudotime trajectory of macrophages. The expression of H2-Aa was projected onto single-cell trajectories. Gene expression values are scaled and log-normalized. j Tumour-infiltrating immune cell score matrix on the basis of T1M0-PDAC (n = 6) and T1M1-PDAC (n = 6) RNA-seq data generated via the QuanTIseq method. The mean of QuanTIseq score in the two groups were shown in the heatmap and compared with two-sided Mann–Whitney U test. k Workflow of the macrophages used for RNA-seq and heatmap showing the DEGs in macrophages co-cultured with PANC-1-OE-Vector cells and PANC-1-OE-MLKL cells for 72 h, after which RNA-seq was performed (n = 3 for each group). l Volcano plot of the DEGs. m KEGG pathway enrichment analysis of the DEGs. n GO enrichment analysis of the DEGs. k Created with BioRender.com released under a Creative Commons Attribution-NonCommercial-NoDerivs 4.0 International license (https://creativecommons.org/licenses/by-nc-nd/4.0/deed.en). Source data are provided as a Source Data file.
Fig. 5
Fig. 5. MLKL-driven necroptosis induces phagocytosis resistance by enhancing tumour CD47 ‘don’t eat me’ signal.
a Cell viability assay of tumour cells cultured alone or co-cultured with macrophages. b WB of PCNA in tumour cells cultured alone or co-cultured with macrophages for 72 h. c Representative immunofluorescence images and quantification of tumour cell (green) phagocytosis by DiI-labelled macrophages (red) under direct co-culture. Arrows indicate phagocytic events; Scale bar: 50 μm. d Phagocytosis events based on immunofluorescence staining of tumour cells treated with DMSO or GW (1 µM). e Phagocytosis events based on flow cytometry. f Phagocytosis events in tumour cells treated with DMSO or GW (1 µM) determined via flow cytometry. g WB of SIRPα and SIGLEC10 on indirectly co-cultured (72 h) macrophages in the upper layer and CD47/CD24 on tumour cells in the lower layer. h Expression of CD47 in cancer cells and SIRPα in macrophages projected onto the single-cell trajectories. i WB of CD47 in tumour cells co-cultured with macrophages and treated/untreated with GW. j Phagocytosis events were detected after treatment with IgG or anti-CD47; Arrows indicate phagocytosis events; Scale bar: 50 μm. k WB of CD47 in wild-type tumour cells treated with different co-culture CMs. l The foldchange of IL-1β, IL-6, TNF and IFN-γ in CMs derived from co-culture of OE-MLKL cells and control cells with macrophages through ELISA analysis. m WB of CD47 in tumour cells neutralised with IgG (200 µg) and anti-IL6 (200 µg) under co-culture. n CD47 IHC staining of primary tumours from C57BL/6 orthotopic model received different treatments: saline, anti-mouse IL6 (200 µg, iv., 3×/week), or GW (100 µM in 50 µl, iv., 3×/week); mice were euthanized 4 weeks after injection; n = 5 mice for each group; Scale bar: 50 μm. o Representative mIFS of T1M1-PDAC PDOs (n = 6) and T1M0-PDAC PDOs (n = 6); Scale bar: 50 μm. n = 3 biologically independent samples in (ag), (im). Unless specified otherwise, the data are presented as means ± SEM (error bar) and compared using the two-sided Student’s t test; *P < 0.05; **P < 0.01; and ***P < 0.001; ns, no significance. Source data are provided as a Source Data file.
Fig. 6
Fig. 6. MLKL-driven necroptosis induces METs formation to promote tumour metastasis.
a 3D tumour spheroid-based invasion of co-cultured tumour cells; Scale bar: 100 μm. b 3D tumour spheroid-based migration of co-cultured tumour cells; Scale bar: 100 μm. c Expression of Fn1 in cancer cells projected onto the single-cell trajectories. d WB of EMT markers in indirectly co-cultured tumour cells treated with or without GW. e Incidence of liver metastasis in NOD-SCID orthotopic model. One million co-cultured tumour cells treated with saline or GW were injected, and mice were further treated with or without GW (100 µM in 50 μl, iv., 3×/week); mice were euthanized 4 weeks after injection; n = 8 mice in each group. f Representative immunofluorescence staining of CitH3 and MMP12 in macrophages indirectly co-cultured with tumour cells. g WB of MET markers in solo-cultured macrophages and co-cultured with macrophages treated with DMSO or MET inhibitor (Cl-amidine, 25 µg/ml). Macrophages were collected together with the CM as the sample. h The effect of GW treatment on MET-related protein levels was determined by WB analysis. i After indirectly coculturing with tumour cells for 72 h under different treatments, the macrophages were stained for extracellular nucleic acids with SYTOX-Orange (0.6 µM); Scale bar: 100 µm. j ELISA analysis of plasma CitH3 in C57BL/6 orthotopic model mice received different treatments: GW (100 µM in 50 µl, iv., 3×/week), anti-Ly6G (100 µg, iv., 3×/week), or macrophage depletion (clodronate liposomes, 200 µl, iv.); n = 3 mice for each group. k WB of EMT markers in co-cultured tumour cells treated with DMSO or MET inhibitor (Cl-amidine, 25 µg/ml). l Incidence of liver metastasis in NOD-SCID orthotopic model. One million tumour cells co-cultured under saline or MET inhibitor (Cl-amidine, 50 mg/kg) and the corresponding concentrated supernatant were injected. n = 8 mice in each group. mice were euthanized 4 weeks after injection. n = 3 biologically independent samples in (ac, fh, j, l). Unless specified otherwise, the data are presented as means ± SEM (error bar) and compared using the two-sided Student’s t test; *P < 0.05; **P < 0.01; and ***P < 0.001; ns, no significance. Source data are provided as a Source Data file.
Fig. 7
Fig. 7. METs promote metastatic capacity through the CXCL8/CXCR pathway, promoting the EMT and endothelial adhesion capacity of tumour cells.
a Workflow showing the treatment of wild-type PANC-1 cells for subsequent WB analysis and RNA-seq. b Heatmap showing the DEGs in PANC-1 cells treated with different co-culture CMs (n = 3 in each group). c GO analysis of DEGs. d KEGG pathway analysis of DEGs. e Volcano plot of DEGs. f WB of EMT markers in wild-type PANC-1 and AsPC-1 cells treated with different co-culture CMs; n = 3 biologically independent samples. g WB of EMT markers in tumour cells culture alone; n = 3 biologically independent samples. h Representative human cytokine antibody array and the corresponding quantitation of co-culture CM; n = 3 biologically independent samples. i ELISA of cytokines of CM in co-culture system treated with DMSO or MET inhibitor (Cl-amidine 25 µg/ml); n = 3 biologically independent samples. j WB of EMT markers in wild-type tumour cells treated with different CMs collected following co-culture system (anti-IL6, 200 µg; anti-GM-CSF, 200 µg; anti-CXCL8, 200 µg; MET inhibitor, Cl-amidine, 25 µg/ml; GW, 1 µM) for 48 h; n = 3 biologically independent samples. k Expression matrix of adhesion molecules in wild-type tumour cells that received different CMs (n = 3 each group), and in T1M0-PDAC (n = 6) and T1M1-PDAC (n = 6) according to RNA-seq data. l GFP-labelled tumour cells co-cultured with macrophages for 48 h were subjected to a HUVEC adhesion assay. Adherent tumour cells are indicated in green; n = 3 biologically independent samples; Scale bar:100 μm. m GFP-labelled wild-type tumour cells received different CMs collected from co-culture system under different treatments (anti-CXCL8, 200 µg; MET inhibitor, Cl-amidine, 25 µg/ml; GW, 1 µM) for 48 h h and were subjected to a HUVEC adhesion assay. Adherent tumour cells are indicated in green; Adherent tumour cells in each group were compared with those in the OE-Vector+PBS group; n = 3 biologically independent samples; Scale bar:100 μm. Unless specified otherwise, the data are presented as means ± SEM (error bar) and compared using the two-sided Student’s t test; *P < 0.05; **P < 0.01; ***P < 0.001; ns, no significance. a Created with BioRender.com released under a Creative Commons Attribution-NonCommercial-NoDerivs 4.0 International license (https://creativecommons.org/licenses/by-nc-nd/4.0/deed.en). Source data are provided as a Source Data file.
Fig. 8
Fig. 8. METs trap CXCL8 and cleave CXCL8 into activated CXCL8-monomer.
a Workflow of size exclusion chromatography tandem ELISA-based detection of the CXCL8 monomer and dimer. b ELISA to quantify total and activated CXCL8 (monomer) secreted in the indicated CM (n = 3 each group); the CXCL8 level was compared by using two-sided Student’s t test; the mean percentage of activated CXCL8 (monomer) in each group was indicated; n = 3 biologically independent samples. c Quantification of total and active CXCL8 (monomer) secreted in the indicated CM after different treatments were applied (n = 3); the mean percentage of activated CXCL8 (monomer) was indicated and compared with the DMSO-treated ones using the two-sided Student’s t test; n = 3 biologically independent samples. d Cellular images and colocalization of CXCL8 (green), MMP2/MMP9 (red) and the DNA scaffold (blue) of METs; n = 3 biologically independent samples. e Cellular images and colocalization of METs with trapped CXCL8 (green) and MMP12 (red) in the DNA scaffold (blue); n = 3 biologically independent samples. f The amino acid sequence of CXCL8 and the cleavage site utilized by MMPs. g WB analysis of the CXCL8 dimer and monomer from the MET-containing CM following different treatments, 20% nonreducing SDS‒PAGE was used to separate the proteins; n = 3 biologically independent samples. Unless specified otherwise, the data are presented as means ± SEM (error bar) and compared using the two-sided Student’s t test; *P < 0.05; **P < 0.01; and ***P < 0.001; ns, no significance. a Created with BioRender.com released under a Creative Commons Attribution-NonCommercial-NoDerivs 4.0 International license (https://creativecommons.org/licenses/by-nc-nd/4.0/deed.en). Source data are provided as a Source Data file.
Fig. 9
Fig. 9. GW combined with anti-CD47 suppresses the progression and metastasis of T1M1-PDAC.
ac mIFS, quantification and correlation analysis of E-cadherin, MLKL, CD47 and CitH3 in external PDAC array (n = 96); Correlation analysis was done through the Pearson correlation coefficient (r). r was represented with 95% confidence intervals; effect sizes: R2; degrees of freedom: 94, two sided; ***P < 0.001; Scale bar: 50 μm. d, e Representative images of KDOs and T1M1-PDOs received different treatments and quantitation of organoid volume and E-cadherin fluorescence; n = 6 biologically independent samples; Scale bar: 50 μm. f Quantitation of METs (CitH3) by ELISA in KDO CM (n = 6) and T1M1-PDAC PDO CM (n = 6). g Tumours gross morphology, weight and volume of C57BL/6 mice received different treatments: saline, GW (100 µM in 50 µl, iv., 3×/week), anti-mCD47 (400 µg, ip., 3×/week) or both since day 21 after injection (106 KPC OE-MLKL cells); Tumours were harvested at five weeks after injection (5 mice per group). h Tumour volume curve of C57BL/6 mice that received different treatments since day 21 after injection (106 KPC OE-MLKL cells); (5 mice per group). i Bioluminescence of liver metastases and spleen nodes of C57BL/6 liver metastasis model received different treatments: saline, GW (100 µM in 50 µl, iv., 3×/week), anti-mCD47 (400 µg, ip., 3×/week) or both since day 7 after injection (106 KPC OE-MLKL cells). Images were collected three weeks after injection; 5 mice per group. j Kaplan–Meier survival curves of C57BL/6 liver metastasis model received different treatments: saline, GW (100 µM in 50 µl, iv., 3×/week), anti-mCD47 (400 µg, ip., 3×/week) or both since day 7 after injection (106 KPC OE-MLKL cells), 5 mice per group; log-rank test. k Bioluminescence of total tumour burden in C57BL/6 orthotopic model received different treatments: saline, GW (100 µM in 50 µl, iv., 3×/week), anti-mCD47 (400 µg, ip., 3×/week) or both since day 7 after injection (106 KPC OE-MLKL cells); Images were collected at four weeks after injection; (8 mice per group). l, m Incidence of liver metastasis and weight in orthotopic model (8 mice per group) received different treatments; Mice were euthanized four weeks after injection. Unless specified otherwise, the data are presented as means ± SEM and compared using the two-sided Student’s t test; *P < 0.05; **P < 0.01; and ***P < 0.001; ns, no significance. Source data are provided as a Source Data file.

References

    1. Siegel RL, Miller KD, Fuchs HE, Jemal A. Cancer Statistics, 2021. CA Cancer J. Clin. 2021;71:7–33. doi: 10.3322/caac.21654. - DOI - PubMed
    1. Kwon W, et al. Is the new T1 category as defined in the eighth edition of the AJCC pancreatic cancer staging system an improvement? J. Gastrointest. Surg. 2020;24:262–269. doi: 10.1007/s11605-019-04464-x. - DOI - PubMed
    1. Hu Y, Yu X, Xu G, Liu S. Metastasis: an early event in cancer progression. J. Cancer Res. Clin. Oncol. 2017;143:745–757. doi: 10.1007/s00432-016-2279-0. - DOI - PMC - PubMed
    1. Roth W. [Cell death in malignant tumors. Relevance of cell death regulation for metastasis] Pathologe. 2015;36:181–184. doi: 10.1007/s00292-015-0080-5. - DOI - PubMed
    1. Pasparakis M, Vandenabeele P. Necroptosis and its role in inflammation. Nature. 2015;517:311–320. doi: 10.1038/nature14191. - DOI - PubMed

MeSH terms