. 2024 Jul 18;15(1):6069.
doi: 10.1038/s41467-024-50137-y.

Timing of whole genome duplication is associated with tumor-specific MHC-II depletion in serous ovarian cancer

Collaborators, Affiliations

Timing of whole genome duplication is associated with tumor-specific MHC-II depletion in serous ovarian cancer

Nikki L Burdett et al. Nat Commun. .

Abstract

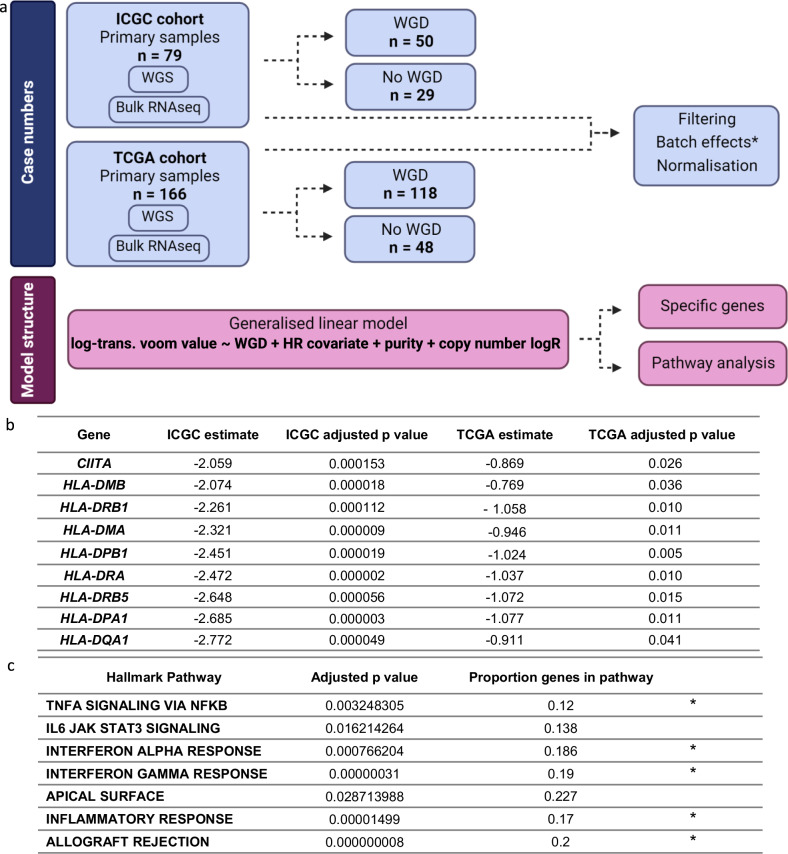
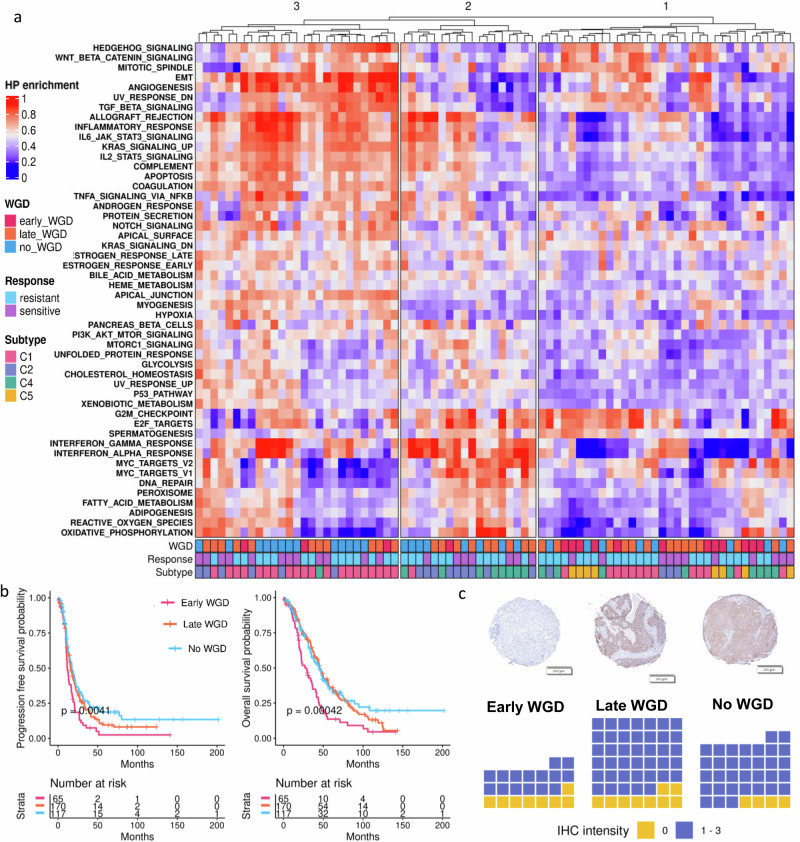
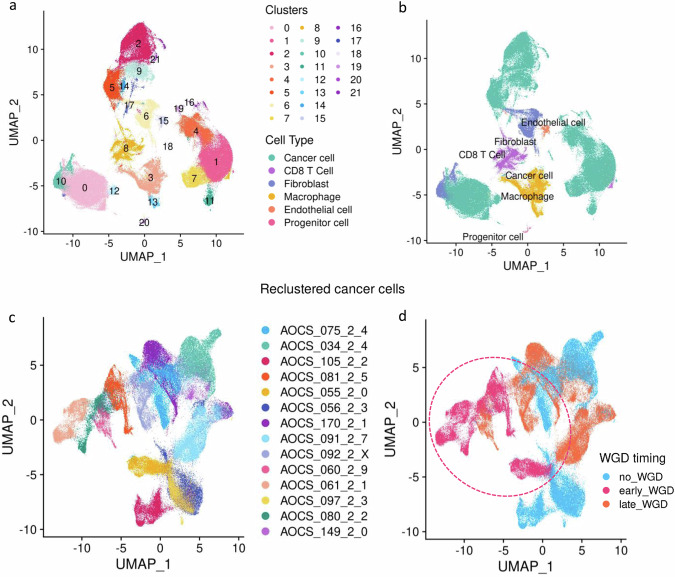
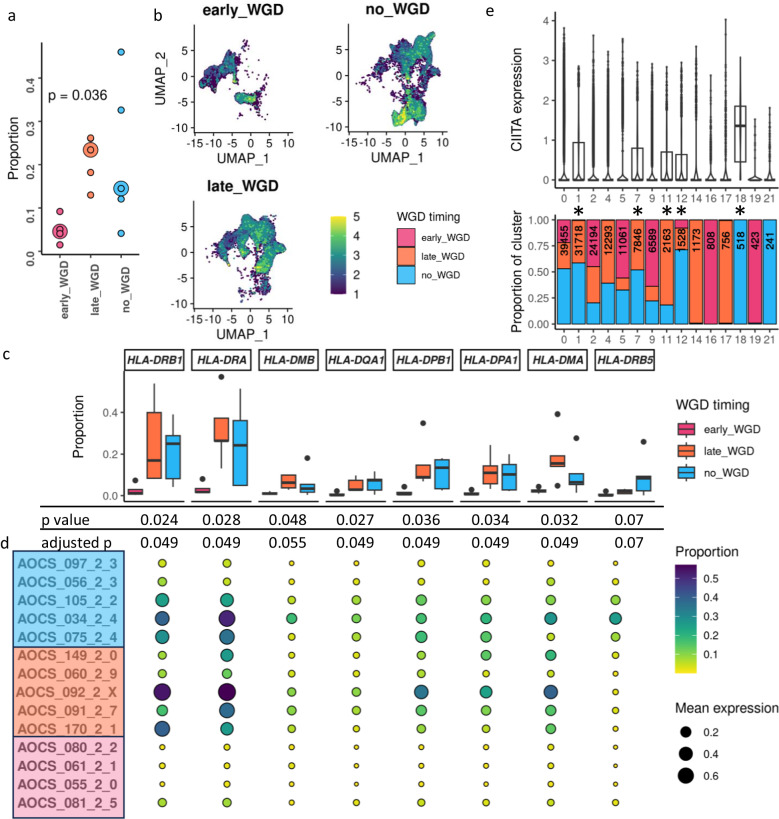
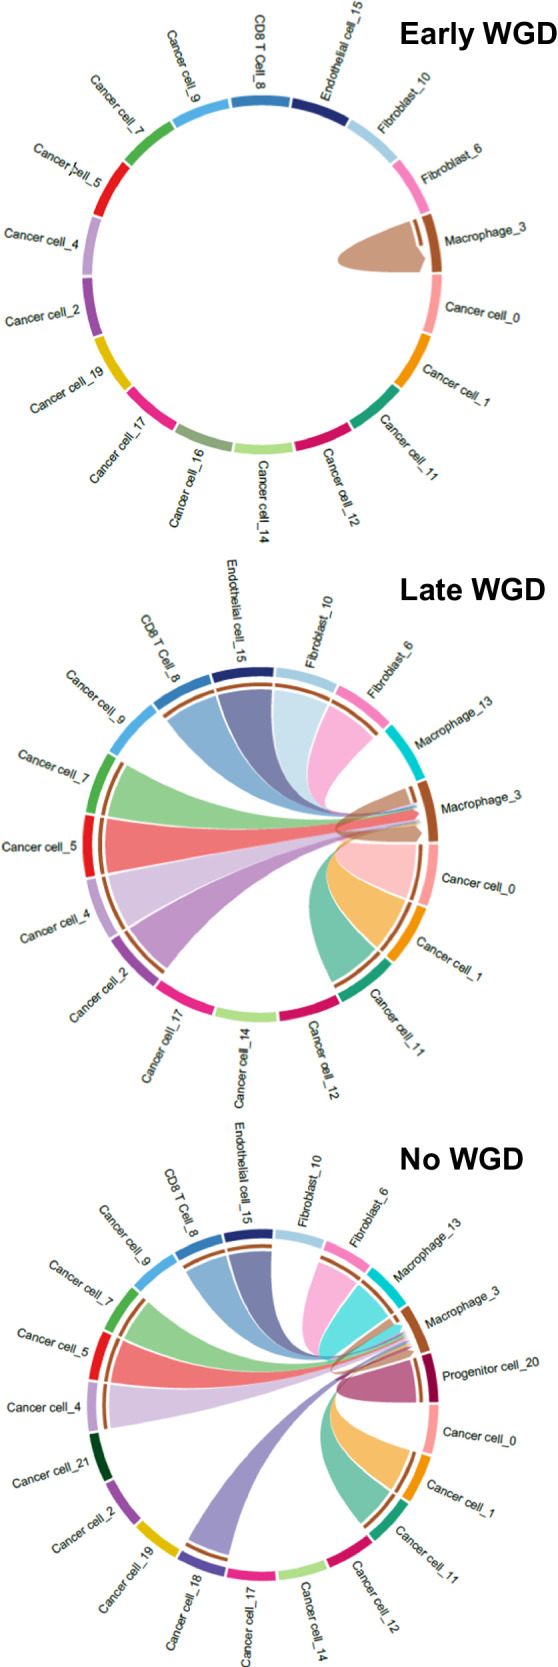
Whole genome duplication is frequently observed in cancer, and its prevalence in our prior analysis of end-stage, homologous recombination deficient high grade serous ovarian cancer (almost 80% of samples) supports the notion that whole genome duplication provides a fitness advantage under the selection pressure of therapy. Here, we therefore aim to identify potential therapeutic vulnerabilities in primary high grade serous ovarian cancer with whole genome duplication by assessing differentially expressed genes and pathways in 79 samples. We observe that MHC-II expression is lowest in tumors which have acquired whole genome duplication early in tumor evolution, and further demonstrate that reduced MHC-II expression occurs in subsets of tumor cells rather than in canonical antigen-presenting cells. Early whole genome duplication is also associated with worse patient survival outcomes. Our results suggest an association between the timing of whole genome duplication, MHC-II expression and clinical outcome in high grade serous ovarian cancer that warrants further investigation for therapeutic targeting.


Conflict of interest statement

D.D.L.B. reports research support grants from Roche-Genentech, AstraZeneca, and personal consulting fees from Exo Therapeutics, none of which are related to this work. E.L.C reports research grant funding from AstraZeneca which is not related to this work. The remaining authors declare no potential conflicts of interest.

Figures

Fig. 1
Fig. 1. Differential gene expression analysis workflow and key results.
a Schematic demonstrating (top) case numbers for the International Cancer Genome Consortium (ICGC) discovery and The Cancer Genome Atlas (TCGA) validation cohort and workflow, and (bottom) the differential gene expression (DGE) generalised linear model structure. *The TCGA validation cohort was processed in the same manner, however batch correction was not possible since batch information is not given. Whole genome duplication (WGD), homologous recombination deficiency (HRD). Created with BioRender.com. b Key DGE results derived from generalised linear model for CIITA and MHC-II related genes with significantly lower expression in both the discovery and validation cohorts in WGD samples. c Overrepresented pathways derived by integrating discovery and validation DGE results through ActivePathways (ranked hypergeometric test) using the differentially expressed geness with significantly lower expression in WGD samples. Asterisks denote pathways involved in immune response. Source data are provided as a Source Data file and Supplementary Table 2. P values are adjusted for multiple comparisons.
Fig. 2
Fig. 2. Differences in gene expression and clinical outcomes by timing of WGD.
a Hierarchical clustering of Hallmark pathway enrichment scores in the discovery ICGC cohort. n = 79. Heatmap is annotated by timing of whole genome duplication (WGD), clinical response to first line therapy and molecular subtype (C1,C2,C4,C5). b Two-sided Kaplan–Meier analysis of overall survival (top) and progression free survival (bottom) by presence and timing of WGD in 352 patients (ICGC and TCGA cohorts combined). c Top: Representative image of core stained with anti-HLA DR + DP + DQ for each WGD category; scale bar is 200 μm. Bottom: Waffle plots depicting immunohistochemistry (IHC) results, coloured by zero (yellow) versus any (lilac) staining with anti-HLA DR + DP + DQ, separated by WGD status. Early WGD n = 23 cores; Late WGD n = 49 cores; No WGD n = 37 cores. Source data are provided as a Source Data file.
Fig. 3
Fig. 3. Single nuclei RNA sequencing.
a UMAP plots of all cells coloured by Seurat clusters. b UMAP plots of all cells coloured by cell types. c UMAP of reclustered cancer cells coloured by patient. d UMAP of reclustered cancer cells coloured by whole genome duplication (WGD) timing (inferred per patient from bulk WGS). Ellipse highlights early WGD clustering. For a and b: Early WGD n = 4 patients, 33,965 nuclei; Late WGD n = 5 patients, 63,156 nuclei; No WGD n = 5 patients, 80,680 nuclei. c, d Early WGD n = 4 patients, 31,479 nuclei; Late WGD n = 5 patients, 48,685 nuclei; No WGD n = 5 patients, 60,602 nuclei.
Fig. 4
Fig. 4. CIITA and MHC-II gene expression in snRNAseq.
a Proportion of cancer cells expressing CIITA. Each small dot represents an individual patient. Large dot represents median for that category. Early WGD n = 4 patients; Late WGD n = 5 patients; No WGD n = 5 patients. Large dot represents median for that category. p = 0.036, Kruskal–Wallis test. b Feature UMAP plots of CIITA expression within cancer cells only, split by whole genome duplication (WGD) status. Cells are visualised in each plot from lowest to highest expression and numerical expression depicted as a relative scale to enable visualisation. c Boxplots summarising the proportion of cancer cells per patient expressing each MHC-II gene that was significant in the bulk DGE analysis. P values (Kruskal–Wallis test) and adjusted p values are depicted below. Early WGD n = 4 patients, 31,479 nuclei; Late WGD n = 5 patients, 48,685 nuclei; No WGD n = 5 patients, 60,602 nuclei. d Proportion of cancer cells expressing each gene shown for each patient individually, grouped by WGD timing. Mean expression denoted by size of circle (see legend). e Violin plots overlaying boxplots of CIITA expression in cancer cells by original Seurat cluster (top), annotated by proportion of cells from each WGD status category (bottom). Asterisks denote clusters designated to have substantial expression. For all boxplots: Left and right whiskers terminate at the minimum and maximum values no further than 1.5× interquartile range; centre line represents median (50th percentile); left and right boundaries of box represent the first (25th percentile) and third (75th percentile) quartiles, respectively; outlying values are plotted as individual points beyond whiskers. Source data are provided as a Source Data file.
Fig. 5
Fig. 5. Ligand-receptor pair communication predictions between cell clusters.
Circle plots visualising the presence or absence of statistically significant interactions between and within cell groups for MHC-II (KEGG pathway hsa04514). The whole genome duplication (WGD) subgroups (early, late and no WGD) are individually depicted and not directly compared. Source data are provided in Supplementary Table 10.

References

    1. Bielski CM, et al. Genome doubling shapes the evolution and prognosis of advanced cancers. Nat. Genet. 2018;50:1189–1195. doi: 10.1038/s41588-018-0165-1. - DOI - PMC - PubMed
    1. Gerstung M, et al. The evolutionary history of 2,658 cancers. Nature. 2020;578:122–128. doi: 10.1038/s41586-019-1907-7. - DOI - PMC - PubMed
    1. Quinton RJ, et al. Whole-genome doubling confers unique genetic vulnerabilities on tumour cells. Nature. 2021;590:492–497. doi: 10.1038/s41586-020-03133-3. - DOI - PMC - PubMed
    1. Priestley P, et al. Pan-cancer whole-genome analyses of metastatic solid tumours. Nature. 2019;575:210–216. doi: 10.1038/s41586-019-1689-y. - DOI - PMC - PubMed
    1. Carter SL, et al. Absolute quantification of somatic DNA alterations in human cancer. Nat. Biotechnol. 2012;30:413–421. doi: 10.1038/nbt.2203. - DOI - PMC - PubMed

MeSH terms

Substances