. 2024 Jul 18;15(1):6066.
doi: 10.1038/s41467-024-50365-2.

Symmetric and asymmetric DNA N6-adenine methylation regulates different biological responses in Mucorales

Affiliations

Symmetric and asymmetric DNA N6-adenine methylation regulates different biological responses in Mucorales

Carlos Lax et al. Nat Commun. .

Abstract

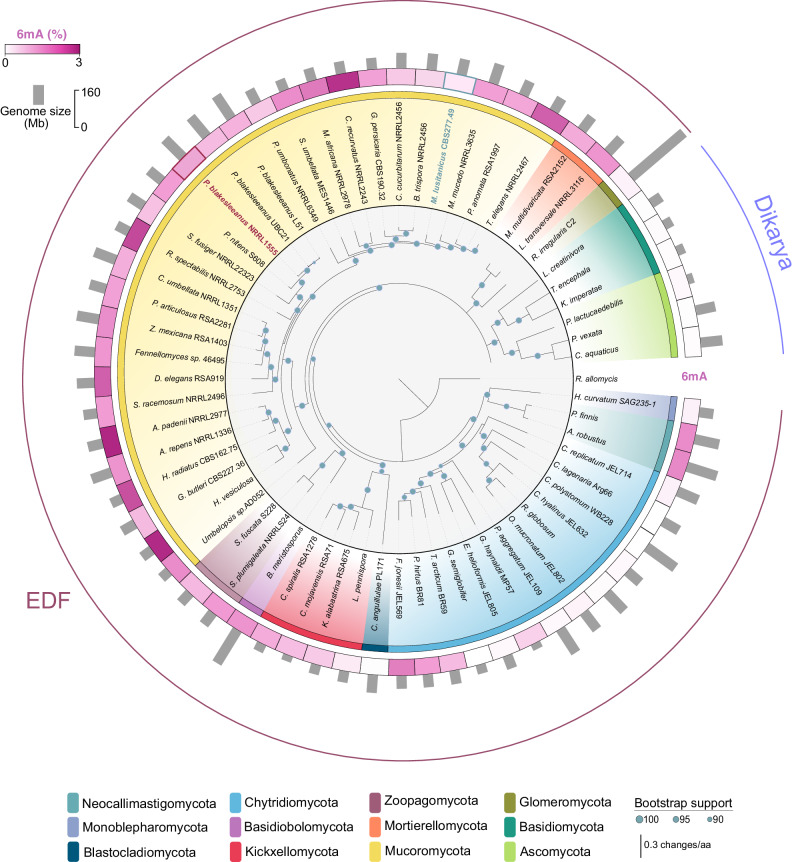
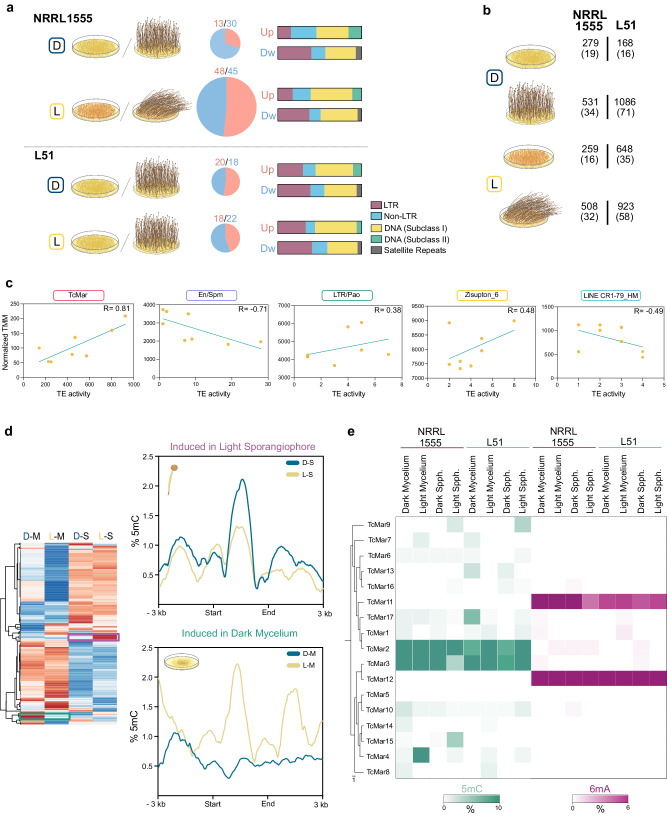
DNA N6-adenine methylation (6mA) has recently gained importance as an epigenetic modification in eukaryotes. Its function in lineages with high levels, such as early-diverging fungi (EDF), is of particular interest. Here, we investigated the biological significance and evolutionary implications of 6mA in EDF, which exhibit divergent evolutionary patterns in 6mA usage. The analysis of two Mucorales species displaying extreme 6mA usage reveals that species with high 6mA levels show symmetric methylation enriched in highly expressed genes. In contrast, species with low 6mA levels show mostly asymmetric 6mA. Interestingly, transcriptomic regulation throughout development and in response to environmental cues is associated with changes in the 6mA landscape. Furthermore, we identify an EDF-specific methyltransferase, likely originated from endosymbiotic bacteria, as responsible for asymmetric methylation, while an MTA-70 methylation complex performs symmetric methylation. The distinct phenotypes observed in the corresponding mutants reinforced the critical role of both types of 6mA in EDF.


Conflict of interest statement

The authors declare that they have not competing interests.

Figures

Fig. 1
Fig. 1. 6mA level variation in the fungal kingdom.
The genomic levels of 6mA (% of methylated adenines) vary dramatically between the different fungal phyla. Also, marked differences are found between species belonging to the same phylum. The inner species tree shows the phylogenetic relationship between 62 fungal representatives for the different fungal phyla indicated in the legend below. 6mA level (%) and total genome size for each representative are shown. (*) Rhizophagus irregularis C2 genome size is 159.8 Mb. Source data are provided as a Source Data file.
Fig. 2
Fig. 2. Epigenetic DNA modifications in the Mucor and Phycomyces genomes.
a View of scaffolds 1–4 from both Mucor (right) and Phycomyces (left), including gene density tracks (blue), repeats density (orange), 6mA level (pink-purple), and 5mC level (green). b Enrichment of 6mA (top) and 5mC (bottom) over genomic features. Results are indicated as log2FC of the enrichment. c Inverted agarose gel image of the result of untreated (Control) and genomic DNA of Mucor (M) and Phycomyces (P) digested with DpnI (cleaves methylated GATC sites), DpnII (cleaves unmethylated GATC sites). This experiment was repeated three times with similar results. d HPLC-MS/MS and SMRT quantification of the total 6mA content in the indicated Mucor and Phycomyces strains. Three biological replicates for each strain were analyzed by HPLC-MS/MS. Data is represented as mean +/- SD. e Methylation ratio for 6mA sites in Mucor and Phycomyces. The ratio was computed as the total methylated reads/total reads for each site. Box bounds represent 25th to 75th percentile with a line at median. Whiskers are drawn from 10th to 90th percentile. (n = 108435 sites for Mucor and 355843 for Phycomyces) f Density plots indicating the methylation ratio for each site in the Watson (Y-axis) and Crick (X-axis) strands. Notably, by looking at the top right corner, only a few sites in Mucor (left) are symmetric (both strands methylated), whereas this proportion is the opposite for Phycomyces (right). g 6mA motif and nucleotide frequency in each position for methylated sites in Mucor (left) and Phycomyces (right). Source data are provided as a Source Data file.
Fig. 3
Fig. 3. Distribution and roles of DNA modifications.
a 6mA marks are frequently clustered in the Phycomyces genome (top) and scattered in the Mucor genome (bottom). A snapshot of scaffold 4 (Phycomyces) and scaffold 1 (Mucor) depicts each case. b Distance between adjacent 6mA sites in the Phycomyces (top) and Mucor (bottom) genomes. c 6mA frequency profile over Phycomyces (purple) and Mucor (blue) genes. All genes were scaled to 1.5 kb, divided into equally sized bins and extended 0.5 kb upstream and downstream. 6mA frequency was calculated for each bin. d Association between the expression level (FPKM) and 6mA content of Phycomyces (top) and Mucor (bottom) genes. Number of MACs and 6mA sites were calculated in a window of −150 bp +400 bp from TSS. The log2 FPKM values for each group of genes were plotted using violin plots. Inner lines indicate the media and the interquartile range. e Weighted 5mC level at Phycomyces DNA transposons (Class II, left) and RNA transposons (Class I, right), distinguishing between LTR retrotransposons (LTR) and non-LTR retrotransposons (Non-LTR). Transposons were scaled to 3 kb and extended 3 kb upstream and downstream the start and end of each element, respectively. Methylation levels are provided for CG, CHG, and CHH contexts and computed on each bin. f Weighted methylation level at highly expressed genes and poorly expressed genes. Genes were divided and ranked into fourth quartiles depending on their expression level (FPKM). Genes were scaled to 3 kb and extended 3 kb upstream and downstream the TSS and TTS, respectively. Methylation levels for each context (CG, CHG and CHH) are plotted for the first quartile (High expression) and the fourth (Low expression). Source data are provided as a Source Data file.
Fig. 4
Fig. 4. DNA modification in basal fungi development and light sensing.
a Genomic 6mA and 5mC levels for each developmental stage and growth condition. Mucor: Yeast, 2 h germination from yeast (Germ 2 h), Nitrogen-rich media ( + N), nitrogen-depleted media (-N) and mycelium (M) in dark and under light exposure. Phycomyces: Mycelium (M) and Sporangiophore (S) growing in dark (D) and under light exposure (L). Samples above and below the dotted line correspond to Mucor and Phycomyces, respectively. b Number of DEGs (P < 0.05) that are upregulated (red) and downregulated (blue) for each comparison. From left to right: 2 h germination vs yeast (2 h/Y) for Mucor, nitrogen depleted media vs nitrogen rich media (-N/ + N) for Mucor, mycelium (M) growing in light vs mycelium growing in the dark for Mucor (L/D), sporangiophore (S) vs mycelium for Phycomyces, mycelium growing in light vs mycelium growing in the dark (L/D) for Phycomyces and sporangiophore (S) growing in light vs sporangiophore growing in the dark (L/D) for Phycomyces. c Boxplots of the number of 6mA and 5mC sites detected for the top 400 higher (boxes with red borders) and top lower (boxes with blue borders) expressed genes for each condition analyzed. Samples above and below the dotted line correspond to Mucor and Phycomyces, respectively. Box bounds represent 25th to 75th percentile with a line at median. Whiskers are drawn from 10th to 90th percentile. d 6mA distribution over the top 400 more highly expressed genes (red) and lower expressed genes in Phycomyces. e The proportion of genes (Phycomyces) containing a MAC (purple) of the top 400 genes with lower expression level (left for each sample, blue dot) and the top genes with higher expression levels (right for each sample, red dot). f 6mA and 5mC ratio over the upregulated genes (red) and the downregulated genes (blue) in the comparison indicated below the graph, which are the same as those in b, except for the Phycomyces S/M comparisons where DEGs in dark and light were analyzed independently. A ratio >1 indicates more methylated sites in treatment vs control. Samples on the left and on the right the dotted line correspond to Mucor and Phycomyces, respectively. The mean methylation ratio is indicated with a black line. A two-tailed Welch’s test was performed for each comparison (P-val 2 h/Y = ns (6mA), ns (5mC); P-val -N/ + N = ns (6mA), ns (5mC); P-val L/D = ns (6mA), ns (5mC); P-val L/D = 0.0017 (6mA), 0.0264 (5mC); P-val L/D = 0.0014 (6mA), 0.0306 (5mC); P-val S/M < 0.0001 (6mA), 0.0019 (5mC); P-val S/M < 0.0001 (6mA), <0.0001 (5mC)), ns = not significant. (n = 2697, 2061, 1400, 1207, 153, 75, 69, 108, 63, 21, 716, 507, 531, and 348 for 6mA sites ratio from left to right comparisons and n = 3151, 2548, 935, 872, 226, 95, 221, 138, 144, 25, 2208, 1601, 1774, and 1330 for 5mC sites ratio from left to right comparisons). g Genome snapshot depicting MAC loss/gain (indicated with purple boxes) for DEGs in the different developmental stages (mycelium and sporangiophore) and environmental conditions (dark and light) in Phycomyces genes (accession numbers are indicated above each gene). Yellow graphs represent the read counts (FKPM). Purple vertical bar, 6mA; purple horizontal bar, MAC. Scale (black bar) = 500 bp. Source data are provided as a Source Data file.
Fig. 5
Fig. 5. Epigenetic regulation of transposable elements of Phycomyces during the different growth conditions.
a Proportion of upregulated (red) and downregulated (blue) TEs in sporangiophore (treatment) and mycelium (control) under dark (D) and light (L) conditions for the indicated strains are shown in pie charts, along with the number of differentially expressed TEs. Proportion of each TE/Repeat class upregulated (red, Up) and downregulated (blue, Dw) is depicted in bar charts. b Number of novel insertions detected in each growth condition. The number of different TEs implicated in these insertions is indicated in brackets. c Correlation in all assayed conditions between expression level (average TMM) and number of insertions. Pearson’s correlation coefficient (R) was computed for each comparison (top right corner of each plot). d Hierarchical clustering of TE expression for the wild-type strain NRRL1555 in dark-mycelium (D-M), light-mycelium (L-M), dark-sporangiophore (D-S), and light-sporangiophore (L-S). At the right, the weighted methylation level for TEs most induced in L-S and D-M (purple and green boxes in left graph) are shown. Transposons were scaled to 3 kb and extended 3 kb upstream and downstream the start and end of each element, respectively. e Methylation levels (5mC in green and 6mA in red) in the wild-type strain NRRL1555 and blind mutant L51 for the seventeen TcMar transposon copies detected in the NRRL1555 reference genome. Source data are provided as a Source Data file.
Fig. 6
Fig. 6. The methylation machinery involved in dual 6mA distribution in early-diverging fungi.
a Schematic diagrams for the candidate proteins of Mucor characterized in this study. PFAM domain and amino acid length are indicated for each protein. b 6mA levels measured by HPLC/MS for the wild-type strain (MU636) and the knock-out mutants in metA, metB, metC, mta1, p1, dmt1 and the double mutant in metA and metB genes. Different letters indicate statistically significant differences, while the identical letters denote no significant differences, calculated using one-way ANOVA (P < 0.001, Tukey test, Supplementary data 7). Four biological replicates were analyzed for each strain. Data is represented as mean +/- SD. c 6mA levels detected with PacBio for the wild-type strain and metAΔ, metBΔ, and metAΔ/metBΔ mutants growing in the dark (D), light (L), nitrogen-rich media (N) or nitrogen-depleted media (-N). At the right, the percent of symmetric 6mA sites for each strain and condition is indicated. d Motifs for 6mA sites in the wild-type strain (MU636) and in the metAΔ, metBΔ, and metAΔ/metBΔ mutant strains. Data from all strains growing in the same conditions (nitrogen-rich media) was used. e Growth of 10.000, 1000, 100, and 10 spores growing with and without hydroxyurea (2 mg/L) at 48 h post-inoculation. A reduced growth was observed in the metBΔ mutant strain. f Differential methylation sites for all DEGs in the ΔmetB compared to the wild-type strain. The x-axis indicates the log2FC for each gene and the y-axis the difference in the number of 6mA sites. g Schematic representation of the methylation complex involved in symmetric 6mA methylation in Mucor. h 6mA levels were measured by HPLC/MS for the wild-type strain (MU636) and the knock-out mutants in mta1 (MU1335) and p1 (MU1357) in the light (L). At the right, the percent of symmetric 6mA sites for each strain and condition is indicated, no symmetric sites were detected in the MU1335 and MU1357 mutants. i Motifs of 6mA sites for the wild type (MU636), mta1Δ, and p1Δ strains. All motifs were calculated from data derived from all three strains growing under light conditions. j Expression of genes that had lost symmetric 6mA cluster in the mta1Δ (top chart) or p1Δ (bottom chart) strains in comparison to the control strain MU636. Not DE, not differentially expressed; Up, upregulated in the mutant; Down, downregulated in the mutant. k Diagram of the experimental procedure followed for complementation of the MU1335 strain. One strain was complemented with the wild-type version of the mta1 (carRP::mta1) and another strain was generated by using a mutated version of mta1 (carRP::mta1(APPW)). Both complemented strains display a white color as a result of carRP locus disruption, which is used for mutant screening. l Images showing colony growth for MU636, the mta1 knockout mutant MU1335, and representative complemented strains. m Colony diameter (cm) measured at 24, 48, 72, and 96 h post-inoculation for each strain as indicated in the colored legend. Measures were taken from four biological replicates. Source data are provided as a Source Data file.
Fig. 7
Fig. 7. Phylogenetic analyses of MetB homologs.
a Maximum likelihood phylogenetic tree of fungal and bacterial N6_Mtase homologs. Fungal clades are marked in color. Red square denotes a Batrachochytrium dendrobatidis sequence (EGF76048.1) found in a Bacillus-like clade, which is likely a bacterial contaminant since its sequence comes from an unplaced genomic scaffold encoding other bacterial sequences. In consequence, this sequence was removed from tree reconciliation. b Species tree showing the occurrence of N6_Mtase homologs from clade 1 and clade 2 with potential HGT events marked as dots.

Similar articles

Cited by

References

    1. Strassert JFH, Monaghan MT. Phylogenomic insights into the early diversification of fungi. Curr. Biol. 2022;32:3628–3635.e3. doi: 10.1016/j.cub.2022.06.057. - DOI - PubMed
    1. Voigt K, et al. Early-diverging fungal phyla: taxonomy, species concept, ecology, distribution, anthropogenic impact, and novel phylogenetic proposals. Fungal Divers. 2021;109:59–98. doi: 10.1007/s13225-021-00480-y. - DOI - PMC - PubMed
    1. Wijayawardene N. Outline of Fungi and fungus-like taxa. Mycosphere. 2020;11:1060–1456. doi: 10.5943/mycosphere/11/1/8. - DOI
    1. Galindo LJ, López-García P, Torruella G, Karpov S, Moreira D. Phylogenomics of a new fungal phylum reveals multiple waves of reductive evolution across Holomycota. Nat. Commun. 2021;12:4973. doi: 10.1038/s41467-021-25308-w. - DOI - PMC - PubMed
    1. Berbee, M. L. & Taylor, J. W. The mycota VIIA. In Systematics and Evolution. 229–245 (Springer, Berlin, Heidelberg, 2001)