. 2024 Jul 18;15(1):6067.
doi: 10.1038/s41467-024-50341-w.

Sphinganine recruits TLR4 adaptors in macrophages and promotes inflammation in murine models of sepsis and melanoma

Affiliations

Sphinganine recruits TLR4 adaptors in macrophages and promotes inflammation in murine models of sepsis and melanoma

Marvin Hering et al. Nat Commun. .

Abstract

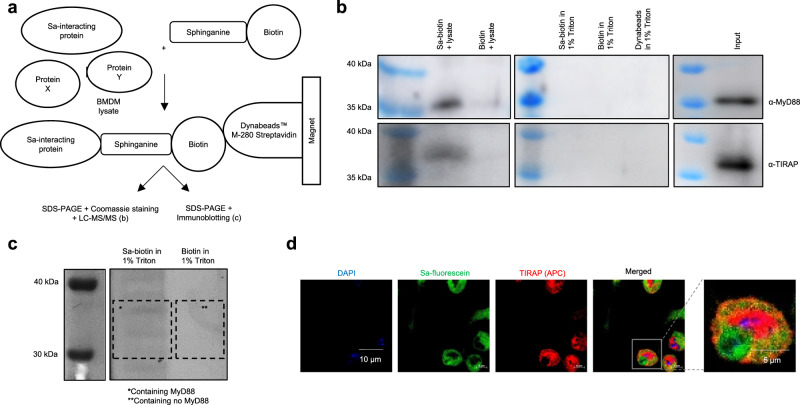
After recognizing its ligand lipopolysaccharide, Toll-like receptor 4 (TLR4) recruits adaptor proteins to the cell membrane, thereby initiating downstream signaling and triggering inflammation. Whether this recruitment of adaptor proteins is dependent solely on protein-protein interactions is unknown. Here, we report that the sphingolipid sphinganine physically interacts with the adaptor proteins MyD88 and TIRAP and promotes MyD88 recruitment in macrophages. Myeloid cell-specific deficiency in serine palmitoyltransferase long chain base subunit 2, which encodes the key enzyme catalyzing sphingolipid biosynthesis, decreases the membrane recruitment of MyD88 and inhibits inflammatory responses in in vitro bone marrow-derived macrophage and in vivo sepsis models. In a melanoma mouse model, serine palmitoyltransferase long chain base subunit 2 deficiency decreases anti-tumor myeloid cell responses and increases tumor growth. Therefore, sphinganine biosynthesis is required for the initiation of TLR4 signal transduction and serves as a checkpoint for macrophage pattern recognition in sepsis and melanoma mouse models.


Conflict of interest statement

G.C. receives research funding from Bayer AG and Boehringer Ingelheim, which has no direct relevance to the findings presented in this study. The remaining authors declare no competing interests.

Figures

Fig. 1
Fig. 1. LPS increases sphingolipids via induction of Sptlc2 expression in M1-like macrophages.
a Experimental design in (b, c, e, f), and Figs. 2–4. b Heat map shows concentration z scores of targeted metabolomics analysis (n = 6 biological replicates). More information in Supplementary Data 1. c Bar graphs showing RNA sequencing analysis of Sptlc1-2, Asah1-2, Gba, Gba2, Smpd1-4, Sgpp1 and Galc in mouse BMDM after PBS or LPS treatment (n = 4 biological replicates). Original RNA sequencing dataset GSE140610 was previously published. Cpm, counts per million. d Sphingolipid biosynthetic pathway. e Representative flow cytometry plots displaying the expression of CD38 and Egr2 in BMDM (live CD45 + CD11b + F4/80+ cells) under M0-like, M1-like or M2-like stimuli. Histograms and bar graphs show the Sptlc2 and ceramide mean fluorescence intensity (MFI) of M0-like, M1-like, and M2-like BMDM (n = 3 biological replicates). Gating in Supplementary Fig. 1a; independent experiment in Supplementary Fig. 1b. f Immunoblot analysis of Sptlc2 protein expression in BMDM from WT or Lyz2-cre mice after 20 h of treatment with PBS or LPS. Grp94 served as a loading control. Quantification was performed in FIJI. Independent experiments in Supplementary Fig. 1e. g Histograms and bar graphs showing the expression of Sptlc2 in intraperitoneal and splenic macrophages (live CD45 + CD11b + CD3-B220-NK1.1-Ly6G-F4/80+ cells) from WT mice 3 h after PBS or LPS injection, and from WT or Lyz2-cre mice 3 h after LPS injection (n = 6 biological replicates). Data are presented as mean ± SD (c, e, g) and are pooled from two independent experiments (b, g). Statistical comparisons were performed with two-tailed unpaired Student’s t-tests (c: all except Sptlc2 and Smpd1 and g: all except graph bottom left; data points were normally distributed), one-way analysis of variance (ANOVA) tests (e; for simultaneous comparisons of more than two groups), and two-tailed Mann-Whitney U tests (c: Sptlc2 and Smpd1 and g: graph bottom left; data points were not normally distributed). 9-week-old female and male (b, eg) C57BL/6 mice were used. a Created with BioRender.com released under a Creative Commons Attribution-NonCommercial-NoDerivs 4.0 International license. Source data are provided as a Source Data file.
Fig. 2
Fig. 2. Sptlc2 deficiency decreases M1-like macrophage growth and this effect is reversed by sphinganine.
a Photographs of polarized WT or Lyz2-cre BMDM. Bar graphs show culture medium pH (n = 6 biological replicates). Independent experiment in Supplementary Fig. 2a. b Images and line graph illustrating confluency of PBS and LPS-treated WT or Lyz2-cre BMDM (n = 4 biological replicates; more information in Supplementary Fig. 2b, c). c Scanning electron microscopy images of WT or Lyz2-cre BMDM after DMSO or sphinganine and PBS or LPS treatment. Independent experiments in Supplementary Fig. 2d. d Line graphs showing changes in the oxygen consumption rate (OCR) (M1 WT: n = 10; M2 WT: n = 6; M1 Lyz2-cre: n = 10; M2 Lyz2-cre: n = 9 biological replicates), and the extracellular acidification rate (ECAR) of polarized WT or Lyz2-cre BMDM (M1 WT: n = 7; M2 WT: n = 8; M1 Lyz2-cre: n = 7; M2 Lyz2-cre: n = 11 biological replicates). Bar graphs show normalized basal OCR, maximal OCR, and spare respiratory capacity (SRC) (WT: n = 6; Lyz2-cre: n = 9 biological replicates) and basal ECAR, glycolytic capacity and glycolytic reserve (n = 7 biological replicates). Independent experiment in Supplementary Fig. 2e. OM oligomycin, FCCP carbonyl cyanide-p-trifluoromethoxyphenylhydrazone, AA antimycin A, Rot rotenone, 2-DG 2-deoxyglucose, Glu glucose. e Experimental design for metabolomics analysis in (f). f Heat map showing concentration of endogenous and stable isotope labeled (SIL) sphingolipids in LPS-polarized WT or Lyz2-cre BMDM (n = 6 biological replicates). g Dot plots and bar graph showing percentages of FSC-Ahigh, SSC-Ahigh WT or Lyz2-cre LPS-activated BMDM after sphingolipid supplementation (n = 3 biological replicates). Independent experiments in Supplementary Fig. 2h. Data are presented as mean ± SD (a, d, g) and pooled from 2 independent experiments (f). Statistical comparisons were performed with one-way ANOVA tests (a, g; for simultaneous comparisons of more than two groups), two-tailed unpaired Student’s t-tests (d: all except glycolytic reserve; data points were normally distributed), and two-tailed Mann-Whitney U tests (d: glycolytic reserve; data points not normally distributed). 11-week-old female and male (ad, f, g) C57BL/6 mice were used. Source data are provided as Source Data file. So sphingosine, Sa-1P sphinganine-1-phosphate, So-1P sphingosine-1-phosphate, Cer ceramide, HexCer hexosylceramide, NS non-hydroxy-fatty acid sphingosine, NdS non-hydroxy-fatty acid dihydro-sphingosine.
Fig. 3
Fig. 3. Deficiency in Sptlc2 mitigates the M1-like macrophage phenotype by preventing co-localization of TLR4 and MyD88 at the cell membrane and downstream NF-κB signaling.
a Histograms and bar graphs showing percentages of CD38+ and Egr2+ BMDM among all BMDM after M1- or M2-like activation, respectively (n = 3 biological replicates). Independent experiments in Supplementary Fig. 3a. b Immunoblot analysis of WT or Lyz2-cre BMDM after PBS or LPS stimulation. Independent experiments in Supplementary Fig. 3c. c Histograms and bar graph showing percentages of MyD88-expressing BMDM after PBS or LPS stimulation (n = 3 biological replicates). Results are pooled from 3 independent experiments with each 1 pair of mice; each point represents results from individual experiment. Independent experiment in Supplementary Fig. 3d. d Confocal fluorescence microscopy images, showing MyD88 and TLR4 in WT or Lyz2-cre BMDM after PBS or LPS stimulation. Independent experiments in Supplementary Fig. 3g. e Illustration of the experimental design in (fi). Myris, myristoylation f Confocal fluorescence microcopy showing MyD88 and TLR4 in PBS-/LPS-treated WT or Lyz2-cre BMDM transduced with MigR1-GFP or MigR1-GFP-MyrisMyD88. Cell sizes were visualized in bar graphs (WT MigR1-GFP: n = 4; Lyz2-cre MigR1-GFP: n = 6; MigR1-GFP-MyrisMyD88: n = 3 biological replicates). Bar graph data are pooled from 3 individual experiments (more images in Supplementary Fig. 3h). g Representative flow cytometry dot plots, showing transduction efficiency in LPS-activated WT or Lyz2-cre BMDM. More data in Supplementary Fig. 3i. h Flow cytometry dot plots and bar graphs, showing percentages of FSC-Ahigh, SSC-Ahigh GFP + LPS-stimulated BMDM (n = 3 biological replicates). Independent experiment in Supplementary Fig. 3j. i Dot plots and bar graphs showing percentages of GFP + CD38 + LPS-stimulated BMDM (n = 3 biological replicates). Independent experiment in Supplementary Fig. 3k. Data are presented as mean ± SD (a, c, f, h, i). Statistical comparisons were performed with two-tailed unpaired Student’s t-tests (a, f; data points were normally distributed) and one-way ANOVA tests (c, h, i; for simultaneous comparisons of more than two groups). 9-week-old female and male (ad, fi) C57BL/6 mice were used. e Created with BioRender.com released under a Creative Commons Attribution-NonCommercial-NoDerivs 4.0 International license. Source data are provided as a Source Data file.
Fig. 4
Fig. 4. Sphinganine physically interacts with the TLR4 adaptors TIRAP and MyD88.
a Experimental design in (b, c). Sphinganine (Sa)-interacting proteins were pulled down from WT BMDM lysate with sphinganine-biotin coupled to Streptavidin-Dynabeads with a magnet and identified through non-biased Coomassie staining (b) and an LC-MS/MS approach, and validated with a biased immunoblotting approach (c). b Proteins in the indicated Coomassie gel regions were identified by LC-MS/MS; MyD88 was only pulled down by sphinganine-biotin, but not control-biotin (see respective boxes; n = 1). Additional information is provided in Supplementary Data 2. Independent experiment in Supplementary Fig. 4a. c Immunoblot analysis of TIRAP and MyD88 after sphinganine-biotin and biotin control pulldown. Sphinganine-biotin, biotin, and Dynabeads in lysis buffer (1% Triton X-100 in PBS) served as controls for the pulldown, and input samples validated the correct localization of the respective proteins on the membrane. Independent experiment in Supplementary Fig. 4c. d Confocal fluorescence microscopy images showing subcellular co-localization of supplemented sphinganine (Sa)-fluorescein and TIRAP in WT BMDM after PBS. Data are representative from four mice from three independent experiments (d); independent experiments in Supplementary Fig. 4e. 9-week-old female (bd) C57BL/6 mice were used. Source data are provided as a Source Data file.
Fig. 5
Fig. 5. Sptlc2 deficiency mitigates LPS-induced sepsis symptoms and M1-like macrophage phenotype and cytokine production.
a Bar graph showing RNA sequencing analysis of Sptlc2 in CD14+ monocytes from healthy volunteers without sepsis and intensive care unit (ICU) patients with sepsis (healthy: n = 5; ICU with or without sepsis: n = 4 biological replicates). Original RNA sequencing dataset GSE139913 was previously published. b, c Representative images of WT or Lyz2-cre mice after LPS injection, and bar graphs illustrating the percentages of WT or Lyz2-cre mice with loss of movement and hunched posture (PBS: n = 3, LPS: n = 12 biological replicates). Independent experiment in Supplementary Fig. 5b, c. d Dot plots showing gating strategy used in (e, f). e Bar graph showing WT or Lyz2-cre macrophage counts after LPS injection (n = 6 biological replicates). Independent experiment in Supplementary Fig. 5g. f Bar graph showing percentages of Arg-1+ macrophages 6 h after LPS injection (n = 6 biological replicates). Independent experiment in Supplementary Fig. 5i. g Bar graphs, showing plasma IL-12/IL-23 p40 and IL-12 p70 levels 3 h after PBS or LPS injection (n = 6 biological replicates; PBS IL-12 p70 below detection limit labeled n.d. not determined). Independent experiment in Supplementary Fig. 5j. h Bar graph showing pixel density of cytokine dots in Lyz2-cre plasma normalized to WT plasma. Black dashed line separates up- and down-regulated cytokines in Lyz2-cre mice; 3 h after LPS injection; (n = 6 biological replicates). Results are pooled from 2 independent experiments with each 3 pairs of mice. i Bar graph showing normalized IL-12 p70 and IL-6 levels in BMDM medium from 4 h LPS-/IFNγ-activated WT or Lyz2-cre BMDM, overexpressing MigR1-GFP or MigR1-GFP-MyrisMyD88 (n = 3). Independent experiment in Supplementary Fig. 5m. Data are presented as mean ± SD (a, ei). Statistical comparisons were performed with one-way ANOVA tests (a, g; for simultaneous comparisons of more than two groups), two-tailed unpaired Student’s t-tests (e, f, h: all except IL-4, G-CSF, Eotaxin and (i); data points were normally distributed) and Mann-Whitney U tests (h: IL-4, G-CSF, Eotaxin; data points were not normally distributed). 8-week-old female and male C57BL/6 mice were used (bi). Source data are provided as a Source Data file.
Fig. 6
Fig. 6. Sptlc2-derived sphinganine is induced by LPS and recruits TLR4 adaptors in macrophages to promote inflammatory responses.
Illustration of the role of Sptlc2-derived sphinganine onto LPS-induced TLR4 signaling in macrophages. LPS induces Sptlc2-mediated sphinganine production and sphinganine interacts physically with TIRAP and MyD88 to recruit MyD88 to TLR4 in the macrophage membrane. This induces downstream signaling and results in M1-like activation-associated morphologic changes and cytokine release, mediating a strengthened acute inflammatory response. In absence of Sptlc2, MyD88 is not recruited to the membrane, preventing activation of downstream signaling. Figure 6 created with BioRender.com released under a Creative Commons Attribution-NonCommercial-NoDerivs 4.0 International license.
Fig. 7
Fig. 7. Sptlc2 deficiency increases B16-F10 tumor growth and weakens anti-tumor myeloid cell activity.
a Immunoblot analysis of LPS (O55:B5) in tumor, skin, and spleen lysates of B16-F10 tumor-bearing WT mice; LPS O55:B5 was used as a loading control (left). Scatter dot plot, showing LPS (O111:B4) concentrations in tumor, spleen, and skin tissues of B16-F10 tumor-bearing mice, measured with limulus amebocyte lysate assays (right) (n = 4 biological replicates). Independent experiments in Supplementary Fig. 7c. b Representative flow cytometry histograms and graph, showing normalized Sptlc2 MFI of macrophages from spleen or tumor tissues of the same mice (n = 10 biological replicates). Independent experiment in Supplementary Fig. 7e. c Line graphs, showing B16-F10 melanoma growth in WT or Lyz2-cre littermate mice over time after subcutaneous injection of 2 × 105 B16-F10 melanoma cells (left). Bar graph, showing the area under the curve (AUC) of the tumor growth plots (n = 22 biological replicates). d Bar graph, showing the tumor weights of WT or Lyz2-cre mice at the endpoint on day 19 (n = 22). e Flow cytometry dot plots, showing the gating strategy used in (f) to identify monocytes (live CD45 + CD11b + NK1.1-CD3-B220-Ly6G-Ly6C + F4/80- cells) and macrophages (TAMs1: live CD45 + CD11b + NK1.1-CD3-B220-Ly6G-Ly6C + F4/80+ cells; TAMs2: live CD45 + CD11b + NK1.1-CD3-B220-Ly6G-Ly6C-F4/80+ cells). f Bar graphs, showing Sptlc2, Ki-67 and MHCII expression levels in WT or Lyz2-cre monocytes, TAMs1 and TAMs2, and their percentages among of all live CD45 + B220-CD3-NK1.1-CD11b + Ly6G- cells from the tumor (n = 11 biological replicates). The data are pooled from two (f) or three (c, d) independent experiments, and are presented as mean ± SD (a, c, d, f); symbols with connecting lines highlight paired samples (b). Tumor growth curves were evaluated longitudinally, and the AUC was calculated for each tumor growth curve (c). Statistical comparisons were performed with one-way ANOVA tests (a; for simultaneous comparisons of more than two groups), two-tailed paired (b) or unpaired Student’s t-tests (d, f; data points were normally distributed), and two-tailed Mann-Whitney U tests (c; data points were not normally distributed). 8-week-old female and male C57BL/6 mice were used (af). Source data are provided as a Source Data file.

References

    1. Kuzmich NN, et al. TLR4 signaling pathway modulators as potential therapeutics in inflammation and sepsis. Vaccines. 2017;5:34. doi: 10.3390/vaccines5040034. - DOI - PMC - PubMed
    1. Capelluto DG. Tollip: a multitasking protein in innate immunity and protein trafficking. Microbes Infect. 2012;14:140–147. doi: 10.1016/j.micinf.2011.08.018. - DOI - PubMed
    1. Liu T, Zhang L, Joo D, Sun SC. NF-kappaB signaling in inflammation. Signal Transduct. Target Ther. 2017;2:17023. doi: 10.1038/sigtrans.2017.23. - DOI - PMC - PubMed
    1. Shi H, et al. TLR4 links innate immunity and fatty acid-induced insulin resistance. J. Clin. Investig. 2006;116:3015–3025. doi: 10.1172/JCI28898. - DOI - PMC - PubMed
    1. Nikolaeva S, et al. GM1 and GD1a gangliosides modulate toxic and inflammatory effects of E. coli lipopolysaccharide by preventing TLR4 translocation into lipid rafts. Biochim. Biophys. Acta. 2015;1851:239–247. doi: 10.1016/j.bbalip.2014.12.004. - DOI - PubMed

MeSH terms

LinkOut - more resources