. 2024 Jul 18;15(1):6056.
doi: 10.1038/s41467-024-50346-5.

Upland Yedoma taliks are an unpredicted source of atmospheric methane

Affiliations

Upland Yedoma taliks are an unpredicted source of atmospheric methane

K M Walter Anthony et al. Nat Commun. .

Abstract

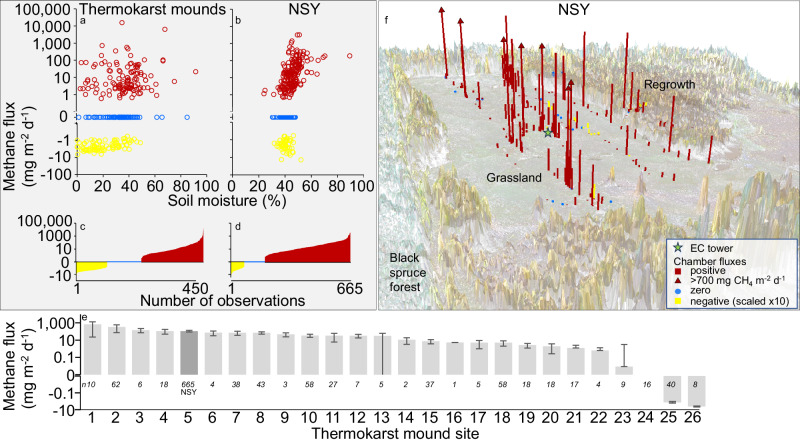
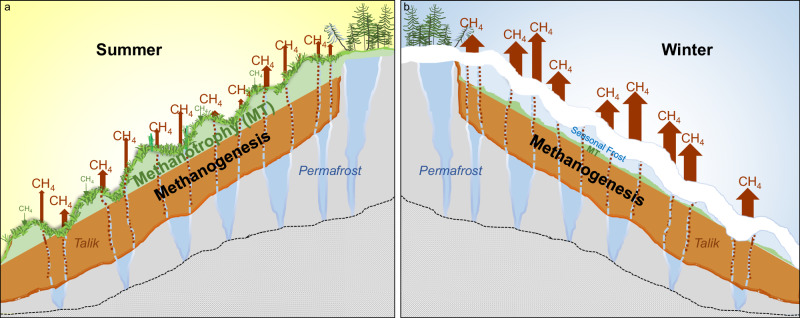
Landscape drying associated with permafrost thaw is expected to enhance microbial methane oxidation in arctic soils. Here we show that ice-rich, Yedoma permafrost deposits, comprising a disproportionately large fraction of pan-arctic soil carbon, present an alternate trajectory. Field and laboratory observations indicate that talik (perennially thawed soils in permafrost) development in unsaturated Yedoma uplands leads to unexpectedly large methane emissions (35-78 mg m-2 d-1 summer, 150-180 mg m-2 d-1 winter). Upland Yedoma talik emissions were nearly three times higher annually than northern-wetland emissions on an areal basis. Approximately 70% emissions occurred in winter, when surface-soil freezing abated methanotrophy, enhancing methane escape from the talik. Remote sensing and numerical modeling indicate the potential for widespread upland talik formation across the pan-arctic Yedoma domain during the 21st and 22nd centuries. Contrary to current climate model predictions, these findings imply a positive and much larger permafrost-methane-climate feedback for upland Yedoma.


Conflict of interest statement

The authors declare no competing interests.

Figures

Fig. 1
Fig. 1. Upland thermokarst mounds in the pan-arctic Yedoma domain.
a Map showing select locations where thermokarst mounds (thaw features) have been observed in remote sensing optical satellite imagery and/or ground truth (yellow dots; Table S2) and in our Alaska fieldwork (blue dots; Fig. S1). Examples of thermokarst mounds in satellite imagery are shown for (b) Kotelny Island, Northeast Siberia (* in a) and c Tabaga, Central Yakutia (** in a). Panels df are photos of thermokarst mounds in interior Alaska spruce forest (d), deciduous forest (e), and grassland (f) ecosystems. g High-resolution thermokarst-mound topography below forest canopy as reconstructed from airborne LiDAR data from central Alaska. Mound spacing is typically ≤15 m, following Pleistocene ice-wedge polygon patterns; vertical thermokarst-mound relief can vary from less than one meter to five meters. Yedoma extent (pink) in a is from Strauss et al. and background topography and bathymetry data is based on NOAA National Geophysical Data Center. In (g), the Alaska Division of Geological and Geophysical Surveys granted permission to use the elevation data, which is in the public domain.
Fig. 2
Fig. 2. Chronological images and field photos of the North Star Yedoma (NSY) study site.
a 1949 single-band airborne optical image available through USGS Earth Explorer (https://pubs.usgs.gov/gip/AerialPhotos_SatImages/aerial.html). b 1996 image showing widespread thermokarst-mound formation. c 2020 image showing deciduous forest succession in the western regrowth section and grass in the eastern section. The timing of the initial disturbance (sometime between August 1976 and August 1978) was determined by comparing Landsat false color composites that indicated disturbance to vegetation within this time frame. Locations of the eddy-covariance tower (EC; 80% footprint white dotted line), geophysical observations (Lines A and D), and boreholes (BH) are shown in (c). df Ground photos of the EC tower in the study field (d), soil pit (e), and lowest portion of the 7-m-long soil core (f). Panels (e) and (f) show dry soil conditions near the ground surface [22–26% volumetric water content (VWC)], the base of the talik (26–30% VWC), and top of permafrost (21–26% VWC).
Fig. 3
Fig. 3. Plot-scale methane fluxes and soil moisture at 25 upland thermokarst-mound study sites with boreal forest, grassland, and tundra vegetation and NSY, our intensive thermokarst-mound study site.
a, b Methane fluxes in relation to surface (12-cm) soil moisture. c, d Summary of all chamber-flux measurements in thermokarst-mound uplands. e Thermokarst-mound methane fluxes at specific sites for biological replicates, the sample size of which is indicated by n (gray bars: mean, SEM) (Table S1). f Plot-scale mean methane emissions <700 mg m−2 d−1 at NSY [Emissions ≥700 mg m−2 d−1 are indicated with arrows and negative (uptake) emissions are multiplied by 10 for visualization].
Fig. 4
Fig. 4. Geophysically derived water content with observed fluxes and predicted flux classes at NSY in September 2021.
Electrical Resistivity Tomography (ERT) transects transformed to VWC estimates for the NSY E–W transect A (a) and N–S transect D (b) profiles are shown together with observed methane (CH4) fluxes within 5 m (transparency scaled by distance from ERT line) and predicted flux classifications (purple ribbon plot) at continuous locations along each profile.
Fig. 5
Fig. 5. Physical, geochemical, and microbiological properties of the NSY soil profile.
a, summer (BH1) and b, winter (BH6) cores. In the winter core, the surface frost layer was ~50 cm thick, and the top of permafrost was observed at 700 cm belowground. Error bars for CH4 and CO2 concentrations and their δ13C values are the standard deviation (SD) of two technical replicates. Data for mcrA and pmoA absolute gene expression are presented as mean ± SEM of three technical replicates. Source data are provided as a Source Data file.
Fig. 6
Fig. 6. Surface and belowground methane fluxes from soil pits and boreholes.
a Fluxes from ~30-cm diameter soil pits dug with a spade at different thermokarst-mound microtopographical positions (tops, flanks, and trenches) and at control sites in August 2022. See Table S1 for full site names and characteristics. b Methane fluxes measured June 6, 2022, at the undisturbed ground surface (depth 0 cm) and various borehole (7.6 cm OD) depths relative to the seasonal frost (SF) at three microtopographical locations on an NSY thermokarst mound. c Fluxes measured over the same boreholes and from boreholes at the UAF black spruce control site later in summer 2022. Among thermokarst-mound soil pits and boreholes, we observed a significant increase in methane flux with depth, and thermokarst-mound profile fluxes were higher than control-site fluxes (Supplementary Discussion 5.1). Source data are provided as a Source Data file. Errors bars are the SD of two or three biological or technical replicates, details of which are provided in the Source Data file.
Fig. 7
Fig. 7. Seasonality of methane (CH4) dynamics in upland Yedoma thermokarst mounds.
a In summer, aerobic methane oxidation dominates surface soils; nonetheless, methane escapes to the atmosphere from anaerobic taliks through preferential flow paths (red dots), such as those formed along melted ice-wedge casts (red-blue dashed lines in the talik). b In winter, relatively larger seasonal methane emissions from the talik are due to a decrease in aerobic methanotrophy by freezing of surface soils. Wintertime methanogenesis in deep talik soils and barometric pressure pumping of methane from taliks also enhance winter emissions.
Fig. 8
Fig. 8. Eddy-covariance tower observations at the NSY thermokarst-mound field.
Air and soil temperature (a), methane (CH4) flux and atmospheric pressure (b), and carbon dioxide (CO2) flux and soil moisture expressed as volumetric water content at 15 cm depth (c).
Fig. 9
Fig. 9. Ecosystem methane emissions by latitude.
a, summer; b, winter, and c, annual. Northern wetlands (n = 305) and uplands (n = 49) are from Treat et al..
Fig. 10
Fig. 10. Simulated thermokarst-mound and talik formation for the Lena River delta in Northeastern Siberia under RCP8.5.
Schematic of the tile-based abstraction of an upland thermokarst-mound landscape (a), and modeled thaw subsidence (dashed line), maximum snow heights (gray area), and evolution of the hydrothermal state (colored areas) for mound tops (b), mound flanks (c), and trenches (d). Note that cryotic talik formation (minimum annual soil liquid water content >10% and perennially unfrozen soil temperature <0 °C) due to laterally transported heat precedes the development of a non-cryotic talik (perennially unfrozen soil temperature >0 °C) underneath mound tops by several decades. Shown results are for a simulation with a snowfall multiplier of φ = 1.0 and a snow density of θ = 200 kg m–3. Simulation results for further parameter settings are shown in Fig. S11 and Supplementary Movies 1–6. Panel a is adapted from “Effects of multi-scale heterogeneity on the simulated evolution of ice-rich permafrost lowlands under a warming climate” by Nitzbon, J. et al. , published under CC BY 4.0.

References

    1. Rantanen M, et al. The Arctic has warmed nearly four times faster than the globe since 1979. Commun. Earth Environ. 2022;3:168. doi: 10.1038/s43247-022-00498-3. - DOI
    1. Biskaborn BK, et al. Permafrost is warming at a global scale. Nat. Comm. 2019;10:264. doi: 10.1038/s41467-018-08240-4. - DOI - PMC - PubMed
    1. Smith SL, O’Neill HB, Isaksen K, Noetzli J, Romanovsky VE. The changing thermal state of permafrost. Nat. Rev. Earth Environ. 2022;3:10–23. doi: 10.1038/s43017-021-00240-1. - DOI
    1. Webb EE, et al. Permafrost thaw drives surface water decline across lake-rich regions of the Arctic. Nat. Clim. Change. 2022;12:841–846. doi: 10.1038/s41558-022-01455-w. - DOI
    1. Liljedahl AK, et al. Pan-Arctic ice-wedge degradation in warming permafrost and its influence on tundra hydrology. Nat. Geosci. 2016;9:312–319. doi: 10.1038/ngeo2674. - DOI

LinkOut - more resources