. 2024 Jul 18;15(1):6071.
doi: 10.1038/s41467-024-50404-y.

Integrating muti-omics data to identify tissue-specific DNA methylation biomarkers for cancer risk

Affiliations

Integrating muti-omics data to identify tissue-specific DNA methylation biomarkers for cancer risk

Yaohua Yang et al. Nat Commun. .

Abstract

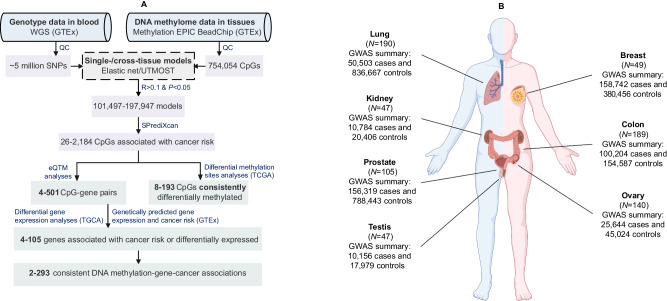
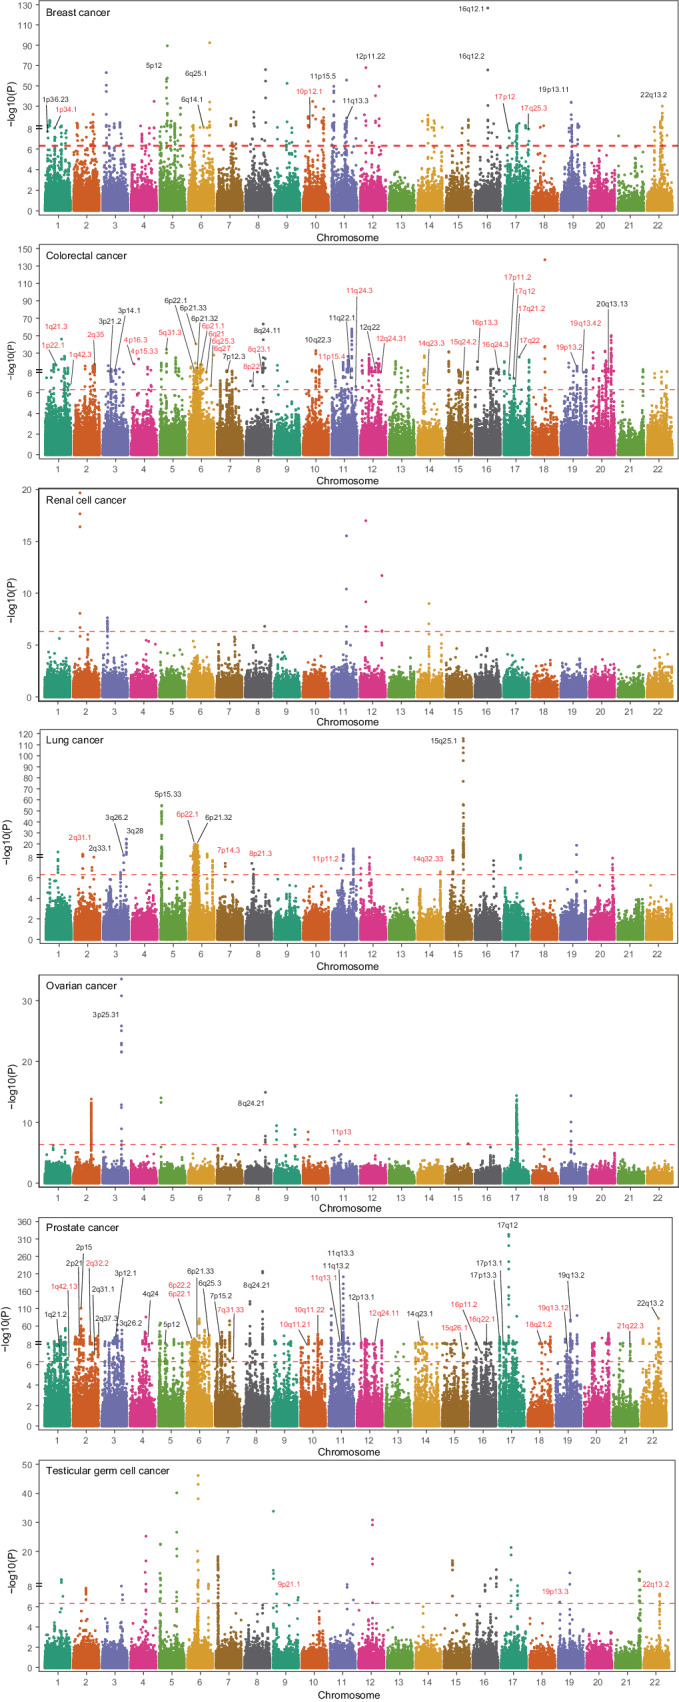
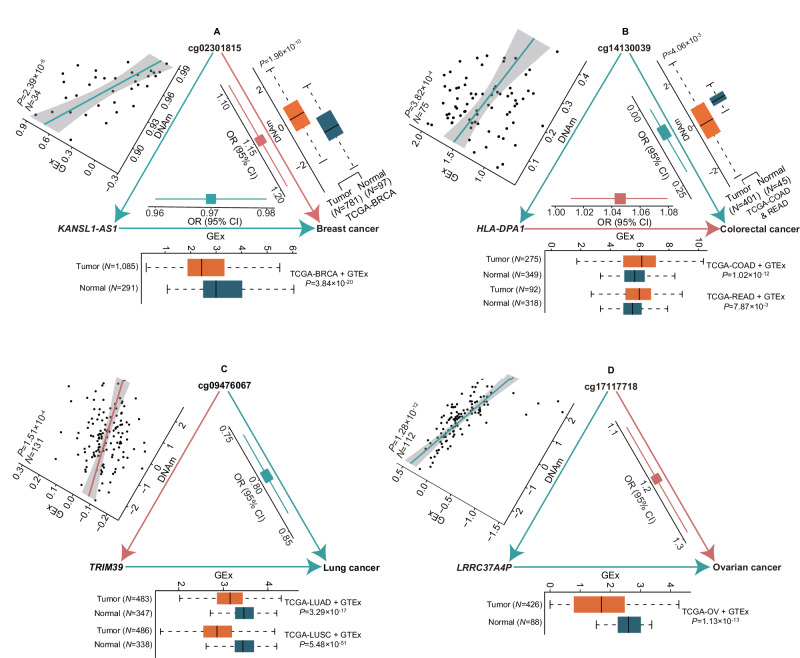
The relationship between tissue-specific DNA methylation and cancer risk remains inadequately elucidated. Leveraging resources from the Genotype-Tissue Expression consortium, here we develop genetic models to predict DNA methylation at CpG sites across the genome for seven tissues and apply these models to genome-wide association study data of corresponding cancers, namely breast, colorectal, renal cell, lung, ovarian, prostate, and testicular germ cell cancers. At Bonferroni-corrected P < 0.05, we identify 4248 CpGs that are significantly associated with cancer risk, of which 95.4% (4052) are specific to a particular cancer type. Notably, 92 CpGs within 55 putative novel loci retain significant associations with cancer risk after conditioning on proximal signals identified by genome-wide association studies. Integrative multi-omics analyses reveal 854 CpG-gene-cancer trios, suggesting that DNA methylation at 309 distinct CpGs might influence cancer risk through regulating the expression of 205 unique cis-genes. These findings substantially advance our understanding of the interplay between genetics, epigenetics, and gene expression in cancer etiology.


Conflict of interest statement

The authors declare no competing interests.

Figures

Fig. 1
Fig. 1. Overall workflow and resources of the present study.
A the overall workflow. The range of values denotes the minimum and maximum numbers across all tissue or cancer types. WGS whole genome sequencing, GTEx Gene-Tissue Expression consortium, QC quality control, UTMOST Unified Test for MOlecular SignaTures, eQTM expression quantitative trait methylation, TCGA The Cancer Genome Atlas. B tissue samples used in DNA methylation prediction model development and cancer GWAS data used in association analyses. N number of samples, GWAS genome-wide association studies. The (B) was created with BioRender.com released under a Creative Commons Attribution-NonCommercial-NoDerivs 4.0 International license.
Fig. 2
Fig. 2. Manhattan plots showing associations between genetically predicted DNA methylation at CpGs and cancer risk.
Association analyses were conducted using SPrediXcan and all statistical tests were two-sided. The x-axis denotes chromosomes and the y-axis is log10P. The dashed red line in each plot represents the Bonferroni-corrected threshold, which was 4.93 × 10−7 for breast cancer, 2.53 × 10−7 for colorectal cancer, 3.98 × 10−7 for renal cell cancer, 2.55 × 10−7 for lung cancer, 2.66 × 10−7 for ovarian cancer, 3.28 × 10 −7 for prostate cancer, and 4.22 × 10−7 for testicular germ cell cancer. Loci (cytobands) instead of CpGs are displayed because of the huge number of cancer-associated CpGs. All loci containing CpG-cancer associations that might be independent of GWAS-identified signals are annotated. Potential novel loci are highlighted in red. Source data are provided as a Source Data file.
Fig. 3
Fig. 3. Examples of CpG-gene-cancer trios suggesting DNA methylation influencing cancer risk by modulating cis-gene expression.
Association analyses of genetically predicted DNA methylation (DNAm) or gene expression (GEx) with cancer risk were performed using SPrediXcan. Differential DNAm or GEx analyses were conducted using linear mixed models. Association analyses between DNAm and GEx were performed using linear regression. Red arrows, lines, and blocks denote positive associations, while green ones denote negative associations. All statistical tests were two-sided and multiple comparisons were Bonferroni- or false discovery rate (FDR)-adjusted. The odds ratio (OR) and 95% confidence interval (CI) for cancer risk per standard deviation (SD) increase in genetically predicted DNAm or GEx are displayed as a block with error bands. In boxplots, boxes represent the interquartile range, black bars are medians, and whiskers extend at most 1.5 times the interquartile range. In the scatter plot displaying the association between DNAm and GEx, directly measured DNAm and GEx values after quantile- and inverse-normalization are presented. N number of samples, TCGA The Cancer Genome Atlas, GTEx Gene-Tissue Expression consortium, BRCA breast invasive carcinoma, COAD colon adenocarcinoma, READ rectum adenocarcinoma, LUAD lung adenocarcinoma, LUSC lung squamous cell carcinoma, OV ovarian serous cystadenocarcinoma. A DNAm at cg02301815 may elevate breast cancer risk by suppressing the expression of KANSL1-AS1. The sample size was 878 for tumor-normal differential DNAm analyses, 34 for DNAm-GEx correlation analyses, 1376 for tumor-normal differential GEx analyses, and 539,198 for association analyses of predicted DNAm and GEx with breast cancer risk, respectively. B DNAm at cg14130039 may decrease colorectal cancer risk by suppressing the expression of HLA-DPA1. The sample size was 446 for tumor-normal differential DNAm analyses, 75 for DNAm-GEx correlation analyses, 624 (TCGA-COAD + GTEx) and 410 (TCGA-READ + GTEx) for tumor-normal differential GEx analyses, and 254,791 for association analyses of predicted DNAm and GEx with colorectal cancer risk, respectively. C DNAm at cg09476067 may decrease lung cancer risk by promoting the expression of TRIM39. The sample size was 131 for DNAm-GEx correlation analyses, 830 (TCGA-LUAD + GTEx) and 824 (TCGA-LUSC + GTEx) for tumor-normal differential GEx analyses, and 887,170 for association analyses of predicted DNAm and GEx with lung cancer risk, respectively. D DNAm at cg17117718 may increase ovarian cancer risk by suppressing the expression of LRCC37A4P. The sample size was 112 for DNAm-GEx correlation analyses, 514 (TCGA-OV + GTEx) for tumor-normal differential GEx analyses, and 70,668 for association analyses of predicted DNAm and GEx with ovarian cancer risk, respectively. Differential DNAm analyses were unable to be performed for ovarian cancer-associated CpG because of the small sample size (n < 10) of the TCGA-OV DNA methylation datasets. Source data are provided as a Source data file.

References

    1. Mucci LA, et al. Familial risk and heritability of cancer among twins in Nordic countries. Jama. 2016;315:68–76. doi: 10.1001/jama.2015.17703. - DOI - PMC - PubMed
    1. Byun J, et al. Cross-ancestry genome-wide meta-analysis of 61,047 cases and 947,237 controls identifies new susceptibility loci contributing to lung cancer. Nat. Genet. 2022;54:1167–1177. doi: 10.1038/s41588-022-01115-x. - DOI - PMC - PubMed
    1. Conti DV, et al. Trans-ancestry genome-wide association meta-analysis of prostate cancer identifies new susceptibility loci and informs genetic risk prediction. Nat. Genet. 2021;53:65–75. doi: 10.1038/s41588-020-00748-0. - DOI - PMC - PubMed
    1. Fernandez-Rozadilla C, et al. Deciphering colorectal cancer genetics through multi-omic analysis of 100,204 cases and 154,587 controls of European and East Asian ancestries. Nat. Genet. 2023;55:89–99. doi: 10.1038/s41588-022-01222-9. - DOI - PMC - PubMed
    1. Jia G, et al. Genome-and transcriptome-wide association studies of 386,000 Asian and European-ancestry women provide new insights into breast cancer genetics. Am. J. Hum. Genet. 2022;109:2185–2195. doi: 10.1016/j.ajhg.2022.10.011. - DOI - PMC - PubMed

Substances

Supplementary concepts

LinkOut - more resources