. 2024 Jul 18;15(1):6042.
doi: 10.1038/s41467-024-50427-5.

Maternal inheritance of functional centrioles in two parthenogenetic nematodes

Affiliations

Maternal inheritance of functional centrioles in two parthenogenetic nematodes

Aurélien Perrier et al. Nat Commun. .

Abstract

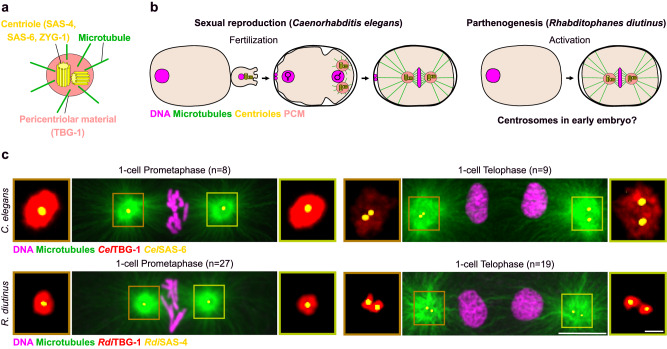
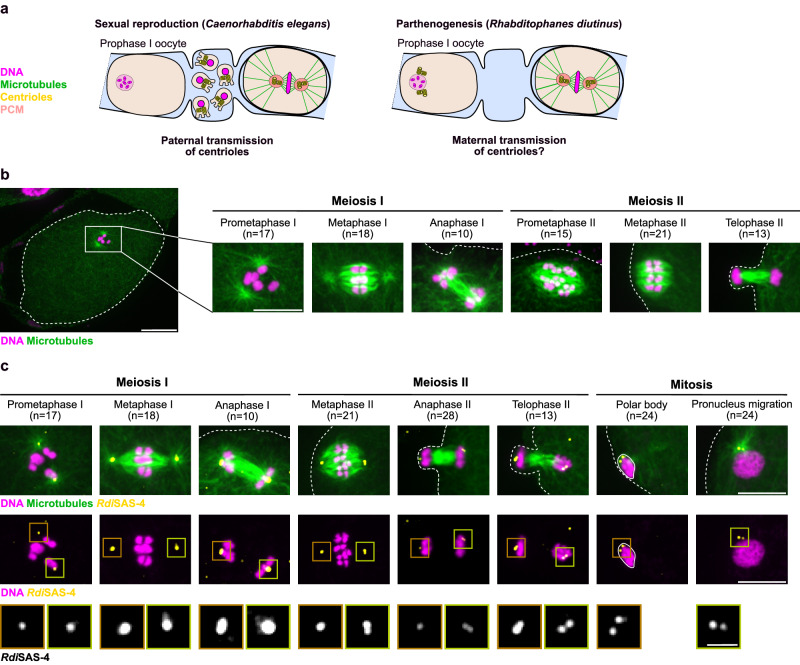
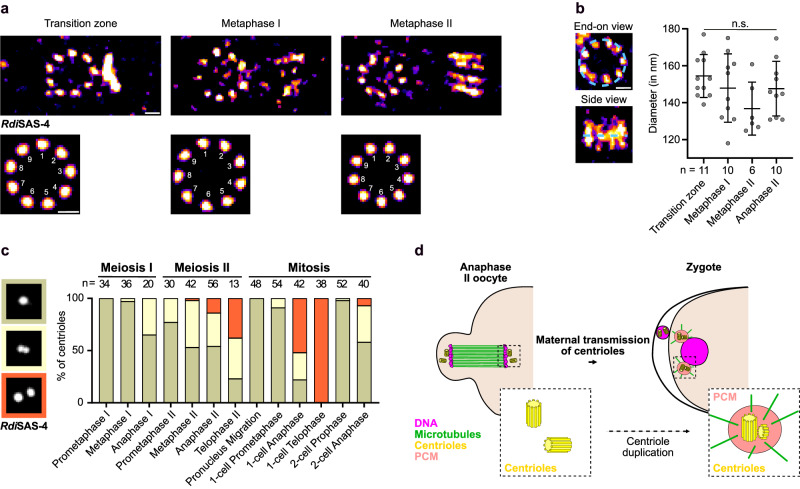
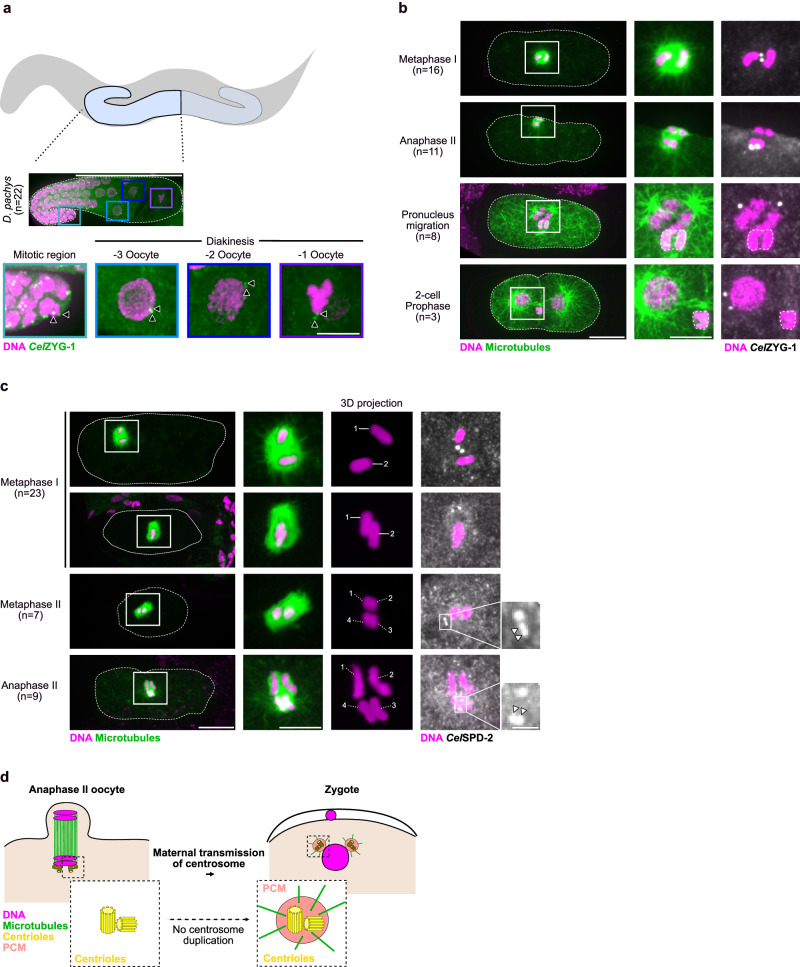
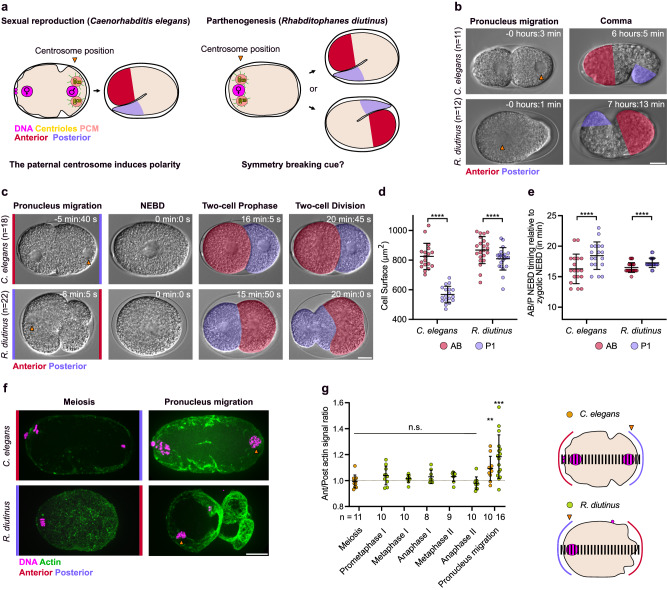
Centrioles are the core constituent of centrosomes, microtubule-organizing centers involved in directing mitotic spindle assembly and chromosome segregation in animal cells. In sexually reproducing species, centrioles degenerate during oogenesis and female meiosis is usually acentrosomal. Centrioles are retained during male meiosis and, in most species, are reintroduced with the sperm during fertilization, restoring centriole numbers in embryos. In contrast, the presence, origin, and function of centrioles in parthenogenetic species is unknown. We found that centrioles are maternally inherited in two species of asexual parthenogenetic nematodes and identified two different strategies for maternal inheritance evolved in the two species. In Rhabditophanes diutinus, centrioles organize the poles of the meiotic spindle and are inherited by both the polar body and embryo. In Disploscapter pachys, the two pairs of centrioles remain close together and are inherited by the embryo only. Our results suggest that maternally-inherited centrioles organize the embryonic spindle poles and act as a symmetry-breaking cue to induce embryo polarization. Thus, in these parthenogenetic nematodes, centrioles are maternally-inherited and functionally replace their sperm-inherited counterparts in sexually reproducing species.


Conflict of interest statement

The authors declare no competing interests.

Figures

Fig. 1
Fig. 1. Canonical centrosomes at mitotic spindle poles in the R. diutinus one-cell embryo.
a Schematic of a mature centrosome. Green, microtubules; light red, pericentriolar material; yellow, centrioles. b Schematics of the origin of one-cell embryo centrosomes in sexually-reproducing Caenorhabditis elegans (left) and in parthenogenetic Rhabditophanes diutinus (right). Magenta, DNA; green, microtubules; light red, pericentriolar material (PCM); yellow, centrioles. c Mitotic spindles during prometaphase (left) and telophase (right) in C. elegans (upper panels) and R. diutinus (lower panels) one-cell embryo. Magenta, DNA; green, microtubules; red, PCM; yellow, centrioles. Scale bar, 5 μm. Number of embryos examined is indicated at the top of each image for each stage. Insets, higher magnification of the centrosomes. Scale bar, 1 μm.
Fig. 2
Fig. 2. Centrioles are present throughout the gonad in R. diutinus.
a Top, schematic of R. diutinus highlighting the reproductive system. Bottom, immunofluorescence image of a straightened R. diutinus gonad. Magenta, DNA; green, microtubules. The gonad is delimited by a white dashed line. Scale bar, 50 μm. Immunofluorescence images of R. diutinus gonads centered on the vestigial spermatheca-proximal region that contains the mitotically-dividing germline nuclei and early meiotic nuclei (leptotene to diplotene) and stained (green) for RdiSAS-4 (b), microtubules (c), pH3 (d), pMPM-2 (e), and (magenta) DNA. Gonads in (b) and (e) were spread before staining. Scale bar, 10 μm. Bottom insets show higher magnification of one nucleus. Scale bar, 2 μm. Number of gonads examined is listed for each antibody used. f Schematic (top) of the spermatheca-proximal small condensed nuclei (SCN) zone and plot (bottom) of the spatial distribution of mitotic activity (pH3), meiotic activity (pMPM-2), and centrioles (RdiSAS-4) across the SCN zone from the distal to the spermathecal proximal region. Means and quartiles are shown. Kruskal-Wallis multiple comparison test, alpha = 0.05, ****p ≤ 0.0001. g Top, immunofluorescence image of an R. diutinus gonad arm centered on the vestigial spermatheca-proximal region and the diakinetic oocytes. Scale bar, 50 μm. Bottom insets show higher magnification of one nucleus. Top row, magenta, DNA; greyscale, RdiSAS-4. Middle row, magenta, DNA; greyscale, RdiZYG-1. Bottom row, magenta, RdiZYG-1; green, SAS-4. Black arrowheads indicate RdiSAS-4 and/or RdiZYG-1 signal. Scale bar, 5 μm. Source data are provided as a Source Data file.
Fig. 3
Fig. 3. Centriolar foci are present at the spindle poles throughout meiosis in R. diutinus oocytes.
a Schematics of the paternal and potential maternal origin of one-cell embryo centrosomes in sexually-reproducing Caenorhabditis elegans (left) and in parthenogenetic Rhabditophanes diutinus (right) respectively. Magenta, DNA; green, microtubules; yellow, centriole; light red, PCM. b Immunofluorescence image of an R. diutinus oocyte in prometaphase I. The oocyte contour is highlighted with a white dashed line. Scale bar, 10 μm. Number of oocytes examined is indicated at the top of the images for each stage. Images on the right show higher magnifications centered on the spindle during the indicated oocyte meiotic division steps. Magenta, DNA; green, microtubules. Scale bar, 5 μm. c Immunofluorescence images centered on the spindle during the indicated oocyte meiotic division steps and on the polar body and maternal pronucleus during mitosis in R. diutinus. Magenta, DNA; green, microtubules; yellow, RdiSAS-4. Scale bar, 5 μm. Oocyte and embryo contours are highlighted with a white dashed line. The polar body is highlighted by a white line. Number of oocytes or embryos examined is indicated at the top of the images for each stage. Bottom insets show higher magnifications of RdiSAS-4 at the left (brown square) and right (green square) meiotic spindle poles or during polar body emission (brown square) and pronuclear migration (green square). Scale bar, 1 μm.
Fig. 4
Fig. 4. Maternal inheritance of intact centrioles in the R. diutinus one-cell embryo.
a U-Ex-STED microscopy images of centrioles observed at R. diutinus oocyte spindle poles at different meiotic stages. RdiSAS-4, fire lookup table. Corresponding bottom images were obtained after 9-fold symmetrization. Scale bar 0.2 μm. b Quantification of individual centriole diameters at different R. diutinus oocyte meiotic stages. Number of centrioles examined is indicated beneath each plot. An example of centriole “end-on view” and “side view” are displayed. RdiSAS-4, fire lookup table. Scale bar 0.2 μm. Kruskal-Wallis multiple comparison test, alpha = 0.05, n.s. = p > 0.05. Mean and standard deviation are displayed. c Quantification of the shape of the RdiSAS-4 foci at the indicated meiotic and mitotic stages. Grey, light beige, and orange correspond to 1-spot, 2-spot adjacent/engaged, and 2-spot separated/disengaged foci respectively. Number of centrioles examined is indicated at the top of each bar. d Schematic of the maternal transmission of a single centrosome from the oocyte to the one-cell embryo in R. diutinus. Insets are schematics of the transmitted centriolar and centrosomal structures. Magenta, DNA; green, microtubules; yellow, centrioles; light red, PCM. Source data are provided as a Source Data file.
Fig. 5
Fig. 5. Maternal inheritance of centrioles in the parthenogenetic nematode Diploscapter pachys.
a Schematic (top) and immunofluorescence image (middle) of a D. pachys gonad. Magenta, DNA; green, CelZYG-1. Scale bar, 50 μm. Number of gonads examined is indicated on the left. Insets (bottom) show higher magnification views of single nuclei at the indicated stages. Black arrowheads indicate ZYG-1 foci. Scale bar, 5 μm. b Immunofluorescence images of D. pachys oocytes and embryos at the indicated stages. Scale bar, 10 μm. Oocyte, embryo and polar body contours are highlighted with a dashed line. Number of oocytes or embryos examined is indicated on the left for each stage. Right insets are higher magnification views of the spindle region. Magenta, DNA (all panels); green, microtubules (left and center panels); greyscale, CelZYG-1 (right panels). Scale bar, 5 μm. c Immunofluorescence images of D. pachys oocytes and embryos at the indicated stages. Scale bar, 10 μm. Oocyte and embryo contours are highlighted with a dashed line. Number of oocytes examined is indicated on the left for each stage. Right insets are higher magnification views of the spindle region. Scale bars, 5 μm and 1 μm respectively. Magenta, DNA (all panels); green, microtubule (left and center left panels); greyscale, CelSPD-2 (right panels and insets). White arrowheads on insets show adjacent/engaged double foci of SPD-2 signal. d Schematic of the maternal transmission of two centrosomes from the oocyte to the embryo in D. pachys. Magenta, DNA; green, microtubules; yellow, centrioles; light red, PCM.
Fig. 6
Fig. 6. The position of the inherited centrosome correlates with the zygote posterior pole in R. diutinus.
a Schematic highlighting the central role of the paternally-inherited centrosome and the potential function of its maternally-inherited counterpart in the one-cell embryo polarization of C. elegans (left) and R. diutinus (right), respectively. Magenta, DNA; yellow, centrioles; light red, centrosomes; red, embryo anterior (head); blue, embryo posterior (tail). b Still images from time-lapse differential interference contrast (DIC) imaging of C. elegans (top) and R. diutinus (bottom) embryos at the pronuclear migration (left) and Comma (right) stage. Anterior and posterior of Comma stage embryos are highlighted in red and purple, respectively. Orange arrowheads indicate the centrosome position. Scale bar, 10 μm. Number of embryos examined is indicated on the left for each species. c Still images from time-lapse DIC imaging of C. elegans (top) and R. diutinus (bottom) embryos at the indicated stages. The anterior AB and the posterior P1 blastomeres are highlighted in red and purple, respectively. Orange arrowheads indicate the centrosome position. Scale bar, 10 μm. Number of embryos examined is indicated on the left for each species. d Quantification of the AB (red circles) and P1 (purple circles) cell surfaces in R. diutinus and C. elegans embryos. Two-tailed paired t-test, alpha = 0.05, ****p ≤ 0.0001. Mean and standard deviation are displayed. e Quantification of the timing of nuclear envelope breakdown (NEBD) in AB or P1 relative to NEBD in the one-cell embryo of R. diutinus and C. elegans. Two-tailed paired Wilcoxon test, alpha = 0.05, ****p ≤ 0.0001. Mean and standard deviation are displayed. f Images of F-actin staining in C. elegans (top) and R. diutinus (bottom) oocyte and embryo at the indicated stages. Orange arrowheads indicate the centrosome position. Polar bodies are surrounded by a white line. Magenta, DNA; green, F-actin. Scale bar, 10 μm. g Quantification of the anterior/posterior F-actin signal ratio at the indicated stages in R. diutinus (green circles) and C. elegans (orange circles) oocytes and embryos. Number of oocytes or embryos examined is indicated below the plot for each stage. One sample two-tailed Wilcoxon test, alpha = 0.05, **p = 0.0098. Mean and standard deviation are displayed. Source data are provided as a Source Data file.

References

    1. Cowan CR, Hyman AA. Centrosomes direct cell polarity independently of microtubule assembly in C. elegans embryos. Nature. 2004;431:92–96. doi: 10.1038/nature02825. - DOI - PubMed
    1. Szöllösi D, Calarco P, Donahue RP. Absence of centrioles in the first and second meiotic spindles of mouse oocytes. J. Cell Sci. 1972;11:521–541. doi: 10.1242/jcs.11.2.521. - DOI - PubMed
    1. Mikeladze-Dvali T, et al. Analysis of centriole elimination during C. elegans oogenesis. Development. 2012;139:1670–1679. doi: 10.1242/dev.075440. - DOI - PMC - PubMed
    1. Pimenta-Marques A, et al. A mechanism for the elimination of the female gamete centrosome in Drosophila melanogaster. Science. 2016;353:aaf4866. doi: 10.1126/science.aaf4866. - DOI - PubMed
    1. Blaxter ML, et al. A molecular evolutionary framework for the phylum Nematoda. Nature. 1998;392:71–75. doi: 10.1038/32160. - DOI - PubMed

LinkOut - more resources