. 2024 Aug;26(8):1233-1246.
doi: 10.1038/s41556-024-01460-5. Epub 2024 Jul 18.

A group 3 medulloblastoma stem cell program is maintained by OTX2-mediated alternative splicing

Affiliations

A group 3 medulloblastoma stem cell program is maintained by OTX2-mediated alternative splicing

Olivier Saulnier et al. Nat Cell Biol. 2024 Aug.

Abstract

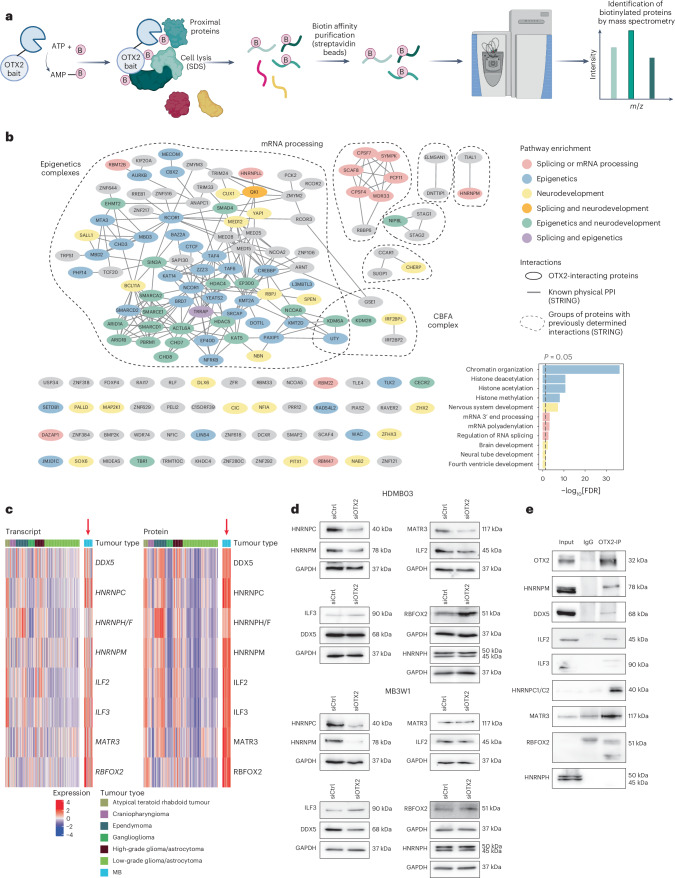
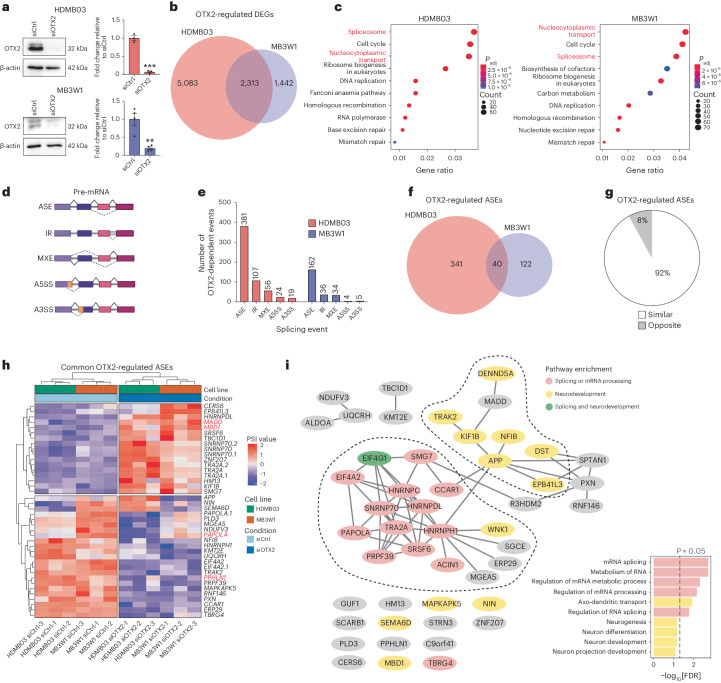
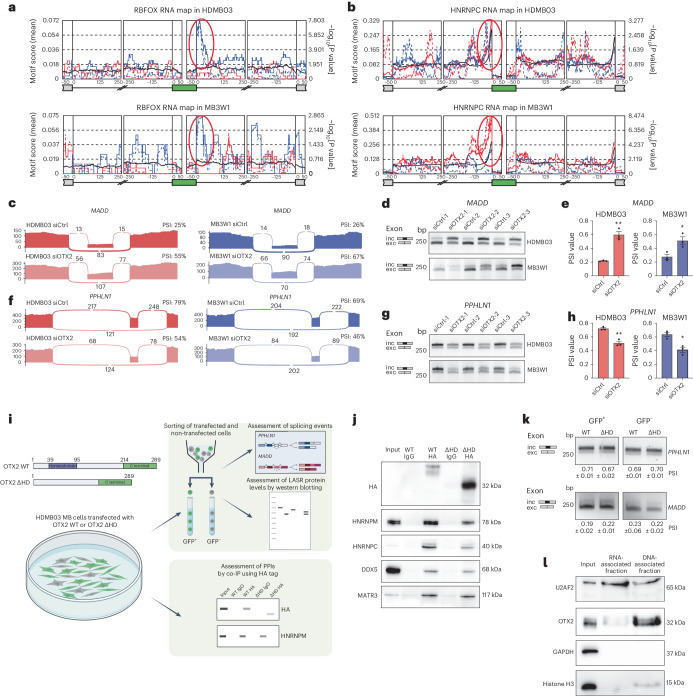
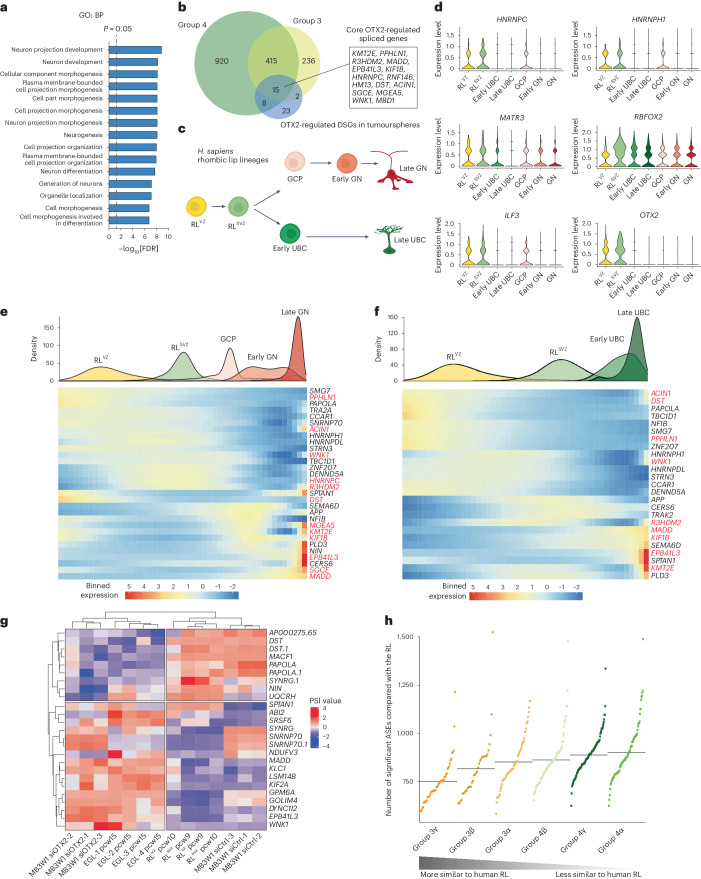
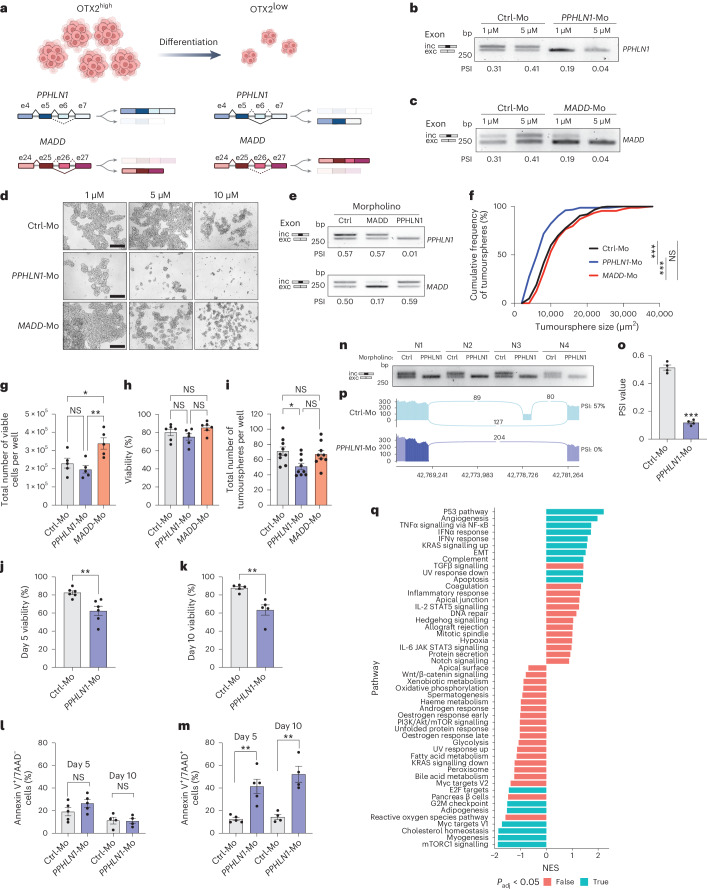
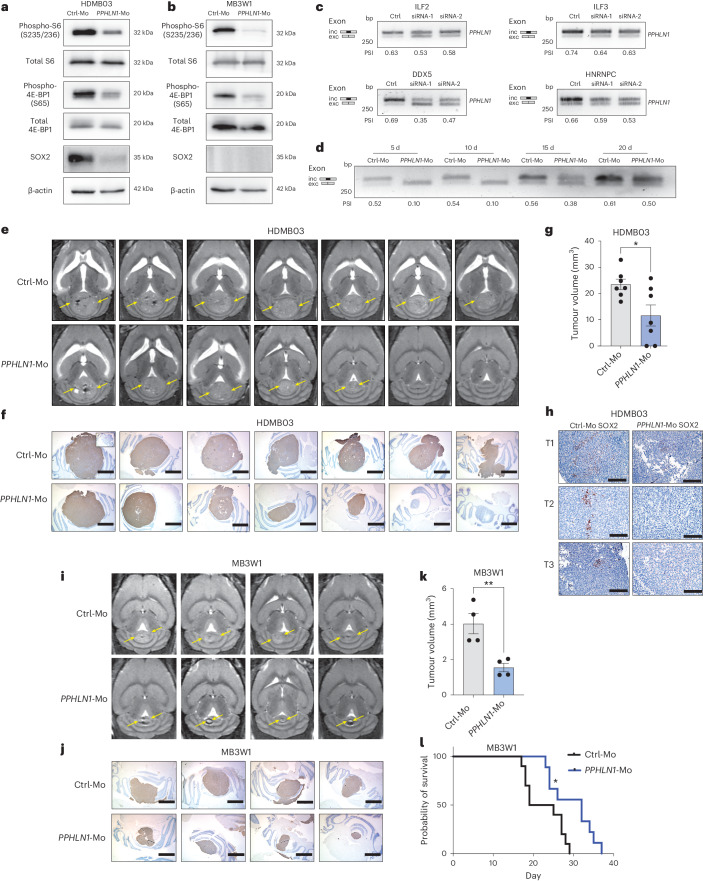
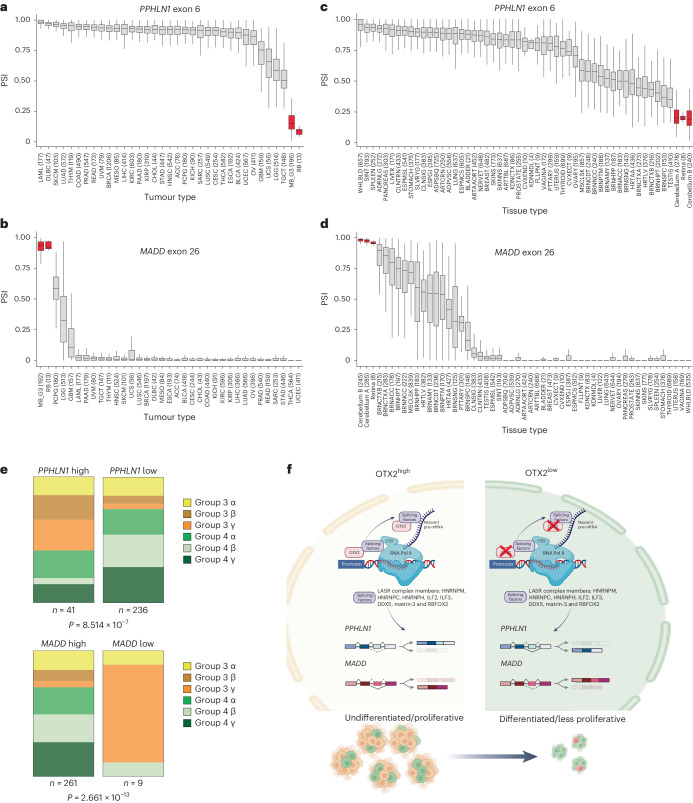
OTX2 is a transcription factor and known driver in medulloblastoma (MB), where it is amplified in a subset of tumours and overexpressed in most cases of group 3 and group 4 MB. Here we demonstrate a noncanonical role for OTX2 in group 3 MB alternative splicing. OTX2 associates with the large assembly of splicing regulators complex through protein-protein interactions and regulates a stem cell splicing program. OTX2 can directly or indirectly bind RNA and this may be partially independent of its DNA regulatory functions. OTX2 controls a pro-tumorigenic splicing program that is mirrored in human cerebellar rhombic lip origins. Among the OTX2-regulated differentially spliced genes, PPHLN1 is expressed in the most primitive rhombic lip stem cells, and targeting PPHLN1 splicing reduces tumour growth and enhances survival in vivo. These findings identify OTX2-mediated alternative splicing as a major determinant of cell fate decisions that drive group 3 MB progression.


Conflict of interest statement

The authors declare no competing interests.

Figures

Fig. 1
Fig. 1. OTX2 associates with core components of the LASR complex.
a, Schematic depicting the TurboID workflow used to identify OTX2 proximal interacting proteins. b, Known PPIs (edges) between OTX2-interacting proteins (nodes), as identified by TurboID experiments. PPIs were determined by STRING analysis, with sub-setting only for experimentally determined physical interactions with a medium (0.400) confidence score or above. The node colours correspond to the enriched pathways displayed in the inset. Pathway significance was assessed using g:Profiler and the GO:BP database with FDR correction. The dotted lines encompass clusters of OTX2-interacting proteins with previously determined interactions. OTX2 was not shown to decrease the complexity. n = 4 biological replicates for OTX2-Turbo samples and n = 3 biological replicates for control (Ctrl-Turbo) samples. c, Heatmap illustrating transcript (left) and transcribed protein (right) levels of genes transcribing members of the LASR complex across 218 samples representing multiple classes of paediatric brain cancer. Individual samples are vertically aligned, with the 22 MB samples coloured blue. Signalling components absent from the ProTrack database have been omitted. d, Western blots depicting LASR complex member protein levels following OTX2 silencing in HDMB03 and MB3W1 tumourspheres. GAPDH served as a loading control. n = 2 independent experiments per cell line with similar results. e, Co-IP validation of endogenous OTX2 protein association with HNRNPM and other components of the LASR complex in HDMB03 tumourspheres. n = 5 independent experiments with similar results. B, biotin; CBFA, core binding factor alpha; IgG, immunoglobulin G; SDS, sodium dodecyl sulfate. Panel a created with BioRender.com.
Fig. 2
Fig. 2. OTX2 silencing results in significant splicing alterations.
a, Representative western blots (left) and quantification (right) of OTX2 silencing in HDMB03 and MB3W1 tumourspheres. GAPDH served as a loading control. The error bars represent s.e.m. (n = 3 (HDMB03) and 4 (MB3W1) biological replicates per condition). Statistical significance was determined by unpaired t-test (***P = 0.0002 (HDMB03) and **P = 0.0033 (MB3W1)). b, Overlap in DEGs with significant differences in expression following OTX2 silencing in HDMB03 (red) and MB3W1 (blue) tumourspheres. P < 10 × 10−50 by hypergeometric probability, with an expected overlap of 1,603. The data represent three biological replicates (siCtrl and siOTX2) for tumourspheres from each cell line (FDR < 0.05; fold change > 2). c, KEGG pathway analyses on OTX2-downregulated genes. Genes associated with the spliceosome and nucleocytoplasmic transport (red labels) were significantly downregulated following OTX2 silencing in HDMB03 (left) and MB3W1 (right) tumourspheres. Statistical significance was determined by right-tailed Fisher’s exact test. d, Schematic depicting the different types of splicing events. e, Numbers of OTX2-dependent splicing events identified by rMATS following OTX2 silencing in HDMB03 (red) and MB3W1 (blue) tumourspheres. f, Venn diagram depicting overlap specifically in OTX2-regulated ASEs in HDMB03 (red) and MB3W1 (blue) tumourspheres. P < 10 × 10−50 by hypergeometric probability, with an expected overlap of 2. The data represent n = 3 biological replicates (siCtrl and siOTX2) for tumourspheres from each cell line. g, Proportion of common target ASEs following OTX2 silencing (as shown in f; n = 40) that were similar (white) or opposite (grey), depending on whether their change in PSI value varied in the same or opposite direction, respectively. h, Heatmap of normalized PSI values from OTX2-regulated ASEs common to both HDMB03 and MB3W1 siCtrl and siOTX2 tumourspheres. ASEs highlighted in red were selected for further validation. i, Interaction map showing PPIs (edges) between protein products (nodes) of 48 common OTX2-regulated DSGs. PPIs were determined using STRING analysis, with sub-setting for only experimentally determined interactions with a low (0.150) confidence score or above. Pathway significance was assessed with g:Profiler using the GO:BP and Reactome databases with FDR correction. A3SS, alternative 3′ splice site; A5SS, alternative 5′ splice site; IR, intron retention; MXE, mutually exclusive exon; Padj, adjusted P value. Source data
Fig. 3
Fig. 3. OTX2 associates with the LASR complex and regulates alternative splicing in a manner that is partially independent of the homeodomain.
a,b, RBFOX (a) and HNRNPC (b) RNA maps in HDMB03 and MB3W1 tumourspheres showing significant enrichment motifs downstream or upstream, respectively, of OTX2-regulated ASEs. Wilcoxon’s rank-sum test was used to identify positions with significant differences in motif scores. Black lines represent the background set of exons. Solid red and blue lines represent up- and downregulated OTX2-regulated ASEs, respectively. Dashed red and blue lines represent −log10[P value] of motif scores versus the background. c, Representative Sashimi plots from RNA-seq data depicting MADD inclusion and exclusion reads, as well as PSI values for siCtrl and siOTX2 HDMB03 (red) and MB3W1 (blue) tumourspheres. n = 3 biological replicates per cell line. d,e, RT-PCR validation (d) and quantification (e) of MADD exon levels for siCtrl and siOTX2 tumourspheres from HDMB03 and MB3W1 cells. The error bars represent s.e.m. (n = 3 biological replicates per condition and cell line). Statistical significance was determined by unpaired t-test (**P = 0.0014 (HDMB03) and *P = 0.027 (MB3W1)). inc, included; exc, excluded. f, Representative Sashimi plots from RNA-seq data depicting PPHLN1 inclusion and exclusion reads, as well as PSI values for siCtrl and siOTX2 HDMB03 (red) and MB3W1 (blue) tumourspheres. n = 3 biological replicates per cell line. In c and f, numbers in the Sashimi plots represent the number of junction reads. g,h, RT-PCR validation (g) and quantification (h) of PPHLN1 exon levels for siCtrl and siOTX2 tumourspheres from HDMB03 and MB3W1 cells. The error bars represent s.e.m. (n = 3 biological replicates per condition and cell line). Statistical significance was evaluated by unpaired t-test (**P = 0.0024 (HDMB03) and *P = 0.01 (MB3W1)). i, Schematic depicting the sequences of the OTX2 wild type (OTX2 WT) and OTX2 lacking its DNA-binding homeodomain (OTX2 ΔHD), plus the subsequent workflow with OTX2 constructs. j, Co-IP showing OTX2 wild type and ΔHD interaction with select LASR proteins. n = 3 independent experiments with similar results. k, RT-PCR of PPHLN1 (top) and MADD (bottom) exon levels for sorted transduced (GFP+) and untransduced (GFP) cells. The values represent PSI values ± s.e.m. (n = 3 biological replicates for PPHLN1 and n = 2 biological replicates for MADD). l, Subcellular fractionation demonstrating a strong presence of OTX2 in the DNA fraction and a modest presence in the RNA fraction. GAPDH and histone H3 served as controls. n = 3 independent experiments with similar results. HA, haemagglutinin. Panel i created with BioRender.com. Source data
Fig. 4
Fig. 4. OTX2-regulated DSGs are expressed in the developing human rhombic lip.
a, Enriched biological processes associated with the 668 OTX2-correlated DSGs from 187 samples from patients with group 3 MB. Gene Ontology term enrichment was performed with the ToppFun suite using a hypergeometric distribution and P values were adjusted with FDR correction. b, Venn diagram depicting overlap between significantly OTX2-correlated DSGs in samples from patients with group 3 and group 4 MB and the 48 significantly common OTX2-regulated DSGs in group 3 tumourspheres. c, Schematic of the lineages descending from the rhombic lip during human cerebellar development. In humans, but not mice or macaques, the rhombic lip splits into distinct zones termed the RLVZ and RLSVZ. d, Violin plots depicting the expression levels of genes transcribing members of the LASR complex, as well as OTX2, in cell types of the developing human rhombic lip. e,f, Gene expression of characteristic marker genes of granule neuron (e) and UBC (f) differentiation along pseudotime following OTX2 knockdown in MB3W1 cells. In total, 30 of 48 OTX2-regulated spliced genes were significant for the granule neuron lineage, whereas 25 of 48 common OTX2-regulated spliced genes were significant for the UBC lineage. Members of the core 15 OTX2-regulated DSGs are highlighted in red. g, Heatmap of normalized PSI values of the significantly spliced exons in RLVZ/RLSVZ versus EGL that were also OTX2-regulated exons in MB3W1 tumourspheres. h, Numbers of significant ASEs compared with the human rhombic lip (pooled RLVZ and RLSVZ at PCWs 9 and 10; n = 4) across all group 3 and group 4 MB subtypes. The dots represent individual tumours and the median per subtype is represented by a horizontal line. The MB subtypes are ordered by increasing number of significant splicing events relative to the human rhombic lip, with group 3γ tumours being the least divergent or more similar to their developmental origins. GN, granule neuron. Source data
Fig. 5
Fig. 5. Alternative splicing of PPHLN1 and MADD is associated with stem and progenitor cell states.
a, Schematic depicting PPHLN1 and MADD alternative splicing relative to OTX2 expression. b,c, RT-PCR validation of PPHLN1 (b) and MADD (c) exon levels following 48 h morpholino treatment. n = 3 independent experiments with similar results. d, HDMB03 tumourspheres treated with morpholinos for 48 h. Scale bars, 300 μm. n = 3 independent experiments with similar results. e, RT-PCR validation of PPLHN1 and MADD exon levels following 72 h of 1 μM morpholino treatment. n = 3 independent experiments with similar results. f, Tumoursphere size following 72 h treatment with 1 μM Ctrl-Mo (black), PPHLN1-Mo (blue) or MADD-Mo (red). Statistical significance was determined by two-sample Kolmogorov–Smirnov test (***P < 0.001). gi, Quantification of HDMB03 live cell number (g), viability (h) and total number of tumourspheres (i) following 72 h (g and h) or 5 d (i) of treatment. The error bars represent s.e.m. (n = 5 (g), 6 (h) and 9 (i) biological replicates). Statistical significance was determined by one-way ANOVA with Tukey’s test for multiple comparison (in g, *P = 0.033 for Ctrl-Mo versus MADD-Mo and **P = 0.0070 for MADD-Mo versus PPHLN1-Mo; in i, *P = 0.0215 for Ctrl-Mo versus PPHLN1-Mo). j,k, Quantification of trypan blue staining following 5 d (j) or 10 d (k) of treatment. The error bars represent s.e.m. (n = 6 (j) and 5 (k) biological replicates). Statistical significance was determined by unpaired t-test (**P = 0.0044 (j) and **P = 0.0034 (k)). l,m, Quantification of annexin V staining (annexin V+/7AAD dying cells (l) and annexin V+/7AAD+ dead cells (m)) following 5 or 10 d of treatment. The error bars represent s.e.m. (for both l and m, n = 5 (5 d) and 4 (10 d) biological replicates). Statistical significance was determined by unpaired t-test (for both 5 and 10 d in m, **P = 0.002). n,o, Representative PCR (n) and quantification (o) of PPHLN1 exon 6 levels following 5 d of treatment with 1 μM PPHLN1-Mo. The error bars represent s.e.m. (n = 4 biological replicates). Statistical significance was determined by unpaired t-test (***P < 0.001). N1–N4 represent four biological replicates. p, Sashimi plots of PPHLN1 exon 6 following 1 μM PPHLN1-Mo treatment. Numbers in the Sashimi plots represent the number of junction reads. q, Gene set enrichment analysis demonstrating hallmark pathways enriched following 5 d of 1 μM PPHLN1-Mo versus Ctrl-Mo treatment. n = 4 biological replicates. IFN, interferon; EMT, epithelial-to-mesenchymal transition; IL-2, interleukin-2; NES, normalized enrichment score; NF-κB, nuclear factor-κB; NS, not significant; TGF, transforming growth factor; TNF, tumour necrosis factor; UV, ultraviolet. Source data
Fig. 6
Fig. 6. Skipping of PPHLN1 exon 6 inhibits stem cell properties and impairs tumour growth in vivo.
a,b, Immunoblots of HDMB03 (a) and MB3W1 (b) tumourspheres following 5 d of 1 μM PPHLN1-Mo treatment. β-actin, total S6 and total 4E-BP1 served as loading controls. n = 2 independent experiments per cell line with similar results. c, RT-PCR validation of PPHLN1 exon 6 levels following 72 h treatment with siCtrl or siRNAs for LASR complex members in HDMB03 tumourspheres. The experiment was repeated three times with similar results. d, Exon skipping, evaluated at days 5 (passage 1), 10 (passage 2), 15 (passage 3) and 20 (passage 4), of HDMB03 tumourspheres treated with 1 μM PPHLN1-Mo on day 0. The experiment was repeated twice with similar results. e, MRI images of representative tumours derived from Ctrl-Mo- and PPHLN1-Mo-treated HDMB03 cells following a 5 d pre-treatment. The yellow arrows denote tumour margins. f, Representative immunohistochemical staining for anti-mitochondrial antibodies in formalin-fixed, paraffin-embedded tissue sections derived from NOD-SCID mice injected with Ctrl-Mo- and PPHLN1-Mo-treated HDMB03 MB cells. n = 7 mice per treatment group. Scale bars, 1,550 μm. Inset represents secondary only negative control. g, Tumour volume in mice transplanted with Ctrl-Mo- and PPHLN1-Mo-treated HDMB03 cells. The error bars represent s.e.m. (n = 7). Statistical significance was determined by unpaired t-test (*P = 0.0206). h, Representative SOX2 immunohistochemical staining in sections derived from independent NOD-SCID mice injected with Ctrl-Mo- (left) or PPHLN1-Mo-treated (right) HDMB03 MB cells. Scale bars, 150 μm. n = 3 per group. i, MRI images of representative tumours derived from Ctrl-Mo- and PPHLN1-Mo-treated MB3W1 cells. The yellow arrows denote tumour margins. j, Representative immunohistochemical staining for anti-mitochondrial antibodies in sections derived from NOD-SCID mice injected with Ctrl-Mo- and PPHLN1-Mo-treated MB3W1 MB cells. n = 4 mice per treatment group. Scale bar, 1,550 μm. k, Tumour volume in NOD-SCID mice transplanted with Ctrl-Mo- and PPHLN1-Mo-treated MB3W1 MB cells. The error bars represent s.e.m. (n = 4). Statistical significance was determined by unpaired t-test (**P = 0.0069). l, Kaplan–Meier curves following transplantation of NOD-SCID mice with MB3W1 cells (n = 10 for Ctrl-Mo and n = 9 for PPHLN1-Mo). Statistical significance was determined by log-rank test (*P = 0.0152). Source data
Fig. 7
Fig. 7. Group 3 MB and retinoblastoma PPHLN1 and MADD alternative splicing patterns are similar.
ad, PSI distributions of PPHLN1 exon 6 (a and c) and MADD exon 26 (b and d) across TCGA tumour types (a and b) and GTEx tissues (c and d). The results for group 3 MB (MB_G3), retinoblastoma (RB), cerebellum and retina are highlighted in red. The numbers represent the number of samples per tumour (a and b) or tissue type (c and d) in which the exon of interest was detected. Box plots show the median with IQR and whiskers represent 1.5-fold IQR. The points outside this range were outliers and are not represented. A full list of defined abbreviations is provided in Supplementary Table 14. e, Breakdown of PPHLN1 exon 6 and MADD exon 26 PSI values using k-means clustering (k = 2) in group 3 and group 4 MB subtypes. Statistical significance was determined by chi-squared test. f, Proposed model of OTX2-mediated regulation of group 3 MB alternative splicing. OTX2 affects this process indirectly (through traditional DNA binding to alter the expression of splicing factors) and directly (through protein interactions with the LASR complex). This leads to alternative splicing of genes associated with cerebellar development, such as PPHLN1 and MADD, in favour of isoforms that perpetuate the undifferentiated stem cell state. CTD, carboxy-terminal domain. Panel f created with BioRender.com.
Extended Data Fig. 1
Extended Data Fig. 1. Turbo ID validation and LASR complex gene expression in Group 3 MB tumorspheres following OTX2 silencing.
a. Immunoblot showing successful expression of the TurboID-OTX2 fusion protein when the TurboID construct is fused to the N-terminal of OTX2. Three independent clones (NT-2, NT-3, and NT-5 were assessed for N-terminal TurboID-OTX2 expression at 75 kDa relative to endogenous levels of OTX2 at 32/37 kDa. N = 3 experiments with similar results. b. Immunoblot showing representative TurboID-OTX2 fusion protein relative to TurboID-CTRL in HDMB03 tumorspheres that were utilized for proteomics analyses. β-actin serves as a loading control. N = 4 experiments with similar results. c. OTX2 enrichment is observed at regulatory elements on LASR complex gene members. From top to bottom, each sub-panel shows: (1) OTX2 ChIP-seq coverage depth, with the range shown numerically in the top left, (2) OTX2 peaks called by MACS2, (3) exons of the gene depicted in the sub-panel, and (4) chromosome number and chromosomal coordinates in Mbp. Images represent un-normalized read depth. d. ChIP-qPCR validation of OTX2 ChIP-sequencing data showing enrichment of OTX2 on all 8 LASR complex genes suggesting that OTX2 can regulate the expression of these complex members. N = 3 biological replicates for each gene. IgG was used as a negative control and H3K4me3 was used as a positive control for enrichment. Error bars: SEM. e. qPCR validation of OTX2 silencing in HDMB03 and MB3W1 tumorspheres. Data are normalized relative to scramble controls (siCTRL). Error bars: SEM. p < 0.01**, p < 0.001***. HDMB03, p = 0.0002; MB3W1, p = 0070. N = 3 biological replicates for each condition and cell line. Results were analyzed using an unpaired t-test. f. Log2 normalized counts for RBFOX2, HNRNPC and HNRNPM following OTX2 silencing in HDMB03 and MB3W1 tumorspheres obtained from RNA-seq data. Error bars: SEM. N = 3 biological replicates for each condition. p < 0.001 for all conditions. Results were analyzed using a Wald test, with FDR correction. Source data
Extended Data Fig. 2
Extended Data Fig. 2. Immunofluorescence demonstrating that RBFOX2, but not HNRNPM or HNRNPC, exhibits an increase in cytoplasmic staining when OTX2 is silenced.
a. Representative immunofluorescent images depicting localization of RBFOX2, HNRNPC and HNRNPM following OTX2 silencing. Arrows denote RBFOX2 levels in the cytoplasmic extensions of differentiating HDMB03 cells following OTX2 silencing. Blue: DAPI, Green: RBFOX2, HNRNPC or HNRNPM. Scale bar: 75 μm. b. Quantification representing 8–10 images for each antibody per condition. For RBFOX2: n = 539 cells for siCTRL and n = 208 cells for the siOTX2 condition were analyzed. For HNRNPM: n = 547 cells for siCTRL and n = 332 cells for the siOTX2 condition were analyzed. For HNRNPC: n = 507 for siCTRL and n = 264 cells for the siOTX2 condition were analyzed. P = 0.01 for RBFOX2. N = 3 independent experiments. Results were analyzed using a Welch’s t-test. Source data
Extended Data Fig. 3
Extended Data Fig. 3. Silencing of LASR complex members decreases tumorigenic properties in Group 3 MB tumorspheres.
a. Immunoblot validations of individual LASR complex gene silencing following HDMB03 tumorsphere treatment with 2 independent siRNAs for each gene relative to siCTRL. GAPDH serves as a loading control for each blot. b. Quantification of HDMB03 total tumorsphere number following 5 day treatment with siCTRL, or siRNAs for LASR complex members. Error bars: SEM. p < 0.05*, p < 0.01**. ILF2 p = 0.0468, p = 0.0064, ILF3 p = 0.0306, p = 0.0217, DDX5 p = 0.0113, p = 0.0133, HNRNPC p = 0.0084, p = 0.0075. N = 3 or 4 biological replicates. Results were analyzed using one-way ANOVA and a Dunnett’s test for multiple comparisons. c. Quantification of HDMB03 tumorsphere viability following 72 hours treatment with siCTRL, or siRNAs for LASR complex members. Error bars: SEM. Results were analyzed using one-way ANOVA and a Dunnett’s test for multiple comparisons. d. Immunoblot validations of ILF2, ILF3, DDX5 and HNRNPC gene silencing following MB3W1 tumorsphere treatment with 2 independent siRNAs for each gene relative to siCTRL. GAPDH serves as a loading control for each blot. e. Quantification of MB3W1 total tumorsphere number following 5 day treatment with siCTRL, or siRNAs for the LASR complex members ILF2, ILF3, DDX5, and HNRNPC. Error bars: SEM. p < 0.05*, p < 0.01**. ILF2 p = 0.0496, p = 0.0144, ILF3 p = 0.0301, p = 0.0241, DDX5 p = 0.0098, p = 0.0127, HNRNPC p = 0.0122, p = 0.005. N = 3–5 biological replicates for each. Results were analyzed using one-way ANOVA and a Dunnett’s test for multiple comparisons. f. Quantification of MB3W1 tumorsphere viability following 72 hours treatment with siCTRL, or siRNAs for the LASR complex members ILF2, ILF3, DDX5, and HNRNPC. Error bars: SEM. Results were analyzed using one-way ANOVA and a Dunnett’s test for multiple comparisons. Source data
Extended Data Fig. 4
Extended Data Fig. 4. OTX2 silencing is associated with significant splicing alterations in HDMB03 and MB3W1 Group 3 MB tumorspheres.
a. Principal component analyses (PCA) demonstrating clustering of replicates for siCTRL and siOTX2 tumorspheres derived from HDMB03 and MB3W1 cells. b. GSEA demonstrating that hallmark genes associated with G2M checkpoint, MYC targets V1 and MTORC1 signaling are enriched in genes sets that are downregulated in siOTX2 HDMB03 (upper) and MB3W1 (lower) tumorspheres. padj < 0.05* for all signatures. c-d. Heat map of normalized PSI values from OTX2-regulated alternatively spliced exons (ASEs) in HDMB03 (c) or MB3W1 (d) siCTRL and siOTX2 tumorspheres. e. Bar graph depiction of the number of OTX2-regulated alternatively spliced exons (ASEs) in HDMB03 and MB3W1 tumorspheres that are skipped (dark grey) or included (light grey). f-g. Interaction maps showing protein-protein interactions (PPIs) (edges) between protein products (nodes) of OTX2-regulated significantly differentially spliced genes (DSGs) in HDMB03 (f) and MB3W1 (g) tumorspheres. PPIs were determined using STRING analysis, sub-setting for only experimentally determined interactions with a medium (0.4) confidence score or above. Node colours correspond to DSGs associated with the indicated pathways that overlap between the 2 cell lines.
Extended Data Fig. 5
Extended Data Fig. 5. Enriched RNA binding protein motifs up- and downstream of OTX2-regulated alternatively spliced exons.
a-d. LASR protein motifs are enriched up- and downstream of downregulated (a,b) and upregulated (c,d) alternatively spliced exons in HDMB03 (a,c) and MB3W1 (b,d). The RNA Binding Fox-1 Homolog (RBFOX) motif is highly enriched downstream of skipped OTX2-regulated alternatively spliced exons (ASEs). N = 3 biological replicated for both HDMB03 and MB3W1 samples.
Extended Data Fig. 6
Extended Data Fig. 6. OTX2-regulated differentially spliced genes in Group 3 MB tumorspheres and across MB patient samples.
a. Representative sashimi plots depicting MBD1 inclusion and exclusion reads as well as percent spliced-in (PSI) values for siCTRL and siOTX2 HDMB03 (red) and MB3W1 (blue) tumorspheres. N = 3 biological replicates for each cell line. PSI (Percent Spliced In) = percentage of exon inclusion (inclusion reads/inclusion reads + exclusion reads). b. RT PCR validation of MBD1 gene exon inclusion and exclusion for siCTRL and siOTX2 tumorspheres from HDMB03 and MB3W1 cells across N = 3 biological replicates. c. Representative sashimi plots depicting PAPOLA inclusion and exclusion reads as well as percent spliced-in (PSI) values for siCTRL and siOTX2 HDMB03 (red) and MB3W1 (blue) tumorspheres. N = 3 biological replicates for each cell line. PSI (Percent Spliced In) = percentage of exon inclusion (inclusion reads/inclusion reads + exclusion reads). d. RT PCR validation of PAPOLA gene exon inclusion and exclusion for siCTRL and siOTX2 tumorspheres from HDMB03 and MB3W1 cells across N = 3 biological replicates. e-h. Normalized counts for MBD1 (e), MADD (f), PPHLN1 (g) and PAPOLA (h) following OTX2 silencing in HDMB03 and MB3W1 tumorspheres obtained from RNA-seq data. While MADD, PPHLN1, and PAPOLA showed statistically significant expression changes following OTX2 silencing, only MADD levels in HDMB03 exhibited a >2-fold change and fit the criteria for significant differential expression. P < 0.01 **, P < 0.001 ***. Results were analyzed using a Wald test, with FDR correction. i-l. Violin plots demonstrating MBD1 (i), MADD (j), PPHLN1 (k), and PAPOLA (l) gene expression across MB subgroups from 763 medulloblastoma patient samples. For all plots, the center line is the median, the whiskers extend to the minima and maxima and the 25th and 75th percentiles are depicted by the bottom and top of the box, respectively. m-o. Overlap between differentially expressed genes (DEGs) and differentially spliced genes (DSGs) in HDMB03 (m), MB3W1 (n) and tumorspheres from both cell lines (o) following OTX2 silencing. Expected overlap for HDMB03 = 133. Expected overlap for MB3W1 = 28. Source data
Extended Data Fig. 7
Extended Data Fig. 7. Association between deltaHD OTX2 and LASR protein levels and correlation between OTX2 and spliced genes in Group 3 MB and Group 4 MB patient samples.
a. Representative fluorescent and brightfield images of transduction efficiency following transfection of HDMB03 MB cells with OTX2 WT or OTX2 delta HD mutant constructs. Scale bar: 300 μm. b. Western blots depicting LASR protein expression in sorted transduced GFP+ (WT and ΔHD) and untransduced (WT and ΔHD) HDMB03 tumorspheres. HA is used to show molecular weights of WT and truncated ΔHD OTX2 protein as well as the purity of the sort. GAPDH serves as the loading control. N = 2 independent experiments with similar results. c. Representative immunofluorescence images depicting RBFOX2 expression (red) in transduced (GFP+) and untransduced (GFP-) cells. DAPI is used to stain nuclei. N = 3 independent experiments with similar results. Scale bar: 75 μm. d. Heat map of normalized PSI values of exons significantly correlated with OTX2 expression across 187 Group 3 MB patient samples. A Pearson correlation test was used to determine the correlation between PSI values of each individual exon and OTX2 expression. This revealed 853 exons in 668 unique genes significantly correlated with OTX2 (FDR < 0.01). e. Heat map of normalized PSI values of exons significantly correlated with OTX2 expression across 293 Group 4 MB patient samples. A Pearson correlation test was used to determine the correlation between PSI values of each individual exon and OTX2 expression. f. Enriched biological processes associated with the 1358 OTX2-correlated genes from 293 Group 4 MB patient samples. GO terms enrichment was performed with the Toppfun suite using a hypergeometric distribution and p-values adjusted using the FDR correction. Source data
Extended Data Fig. 8
Extended Data Fig. 8. OTX2 levels are correlated with spliced genes in Group 3 MB patient samples and are associated with the developing rhombic lip.
a. Venn diagram depicting overlap between common OTX2-correlated genes (Group 3 MB patient samples) and lineage genes from the developing rhombic lip (RL) of the cerebellum. b-c. Gene expression of characteristic marker genes of granule neuron (GN) differentiation along pseudotime. OTX2-correlated spliced genes in Group 3 MB tumors significant for the ‘early’ GN lineage (b) or ‘late’ GN (c) lineage. d-e. Gene expression of characteristic marker genes of unipolar brush cell (UBC) differentiation along pseudotime. OTX2-correlated spliced genes in Group 3 MB tumors significant for the ‘early’ UBC lineage (d) or ‘late’ UBC (e) lineage.
Extended Data Fig. 9
Extended Data Fig. 9. Splice blocking, but not global siRNA silencing of PPHLN1 and MADD in Group 3 MB tumorspheres impacts tumorigenic properties in vitro.
a. Heat map of normalized PSI values from ASEs in RLVZ/RLSVZ vs. the external granule layer (EGL). RLVZ and RLSVZ at post conception weeks (PCW) 9 and 10, N = 4 versus the EGL at PCW 15, N = 4. b. Heat map of normalized PSI values from ASEs in RLVZ vs. the RLSVZ. RLVZ at post conception weeks (PCW) 9 and 10, N = 2 vs. RLSVZ at post conception weeks (PCW) 9 and 10, N = 2. c-d. Immunoblot validation of PPHLN1 (c) and MADD (d) silencing following treatment with 2 independent siRNAs or a negative control siRNA (siCTRL) for each gene. OTX2 levels are unaffected. β-actin serves as a loading control. N = 2 experiments for both PPHLN1 and MADD with similar results. e-g. Quantification of HDMB03 total live cell number (e), viability (f) and total number of tumorspheres (g) following 5 day treatment with siCTRL, siPPHLN1-1, or siPPHLN1-2. Error bars: SEM. Raw data were analyzed using one-way ANOVA and a Dunnett’s test for multiple comparisons. h-j. Quantification of HDMB03 total live cell number (h), viability (i) and total number of tumorspheres (j) following 5 day treatment with siCTRL, siMADD-1, or siMADD-2. Error bars: SEM. Raw data were analyzed using one-way ANOVA and a Dunnett’s test for multiple comparisons. k. MADD splicing isoforms of interest and their corresponding protein domains from PROSITE, Pfam and SMART databases. Exon of interest is highlighted in red. l. PPHLN1 splicing isoforms of interest and their corresponding protein domains from PROSITE, Pfam and SMART databases. Exon of interest is highlighted in red. m. Western blot depicting protein levels of PPHLN1 and MADD following HDMB03 tumorsphere treatment with the CTRL-Mo, MADD-Mo and PPHLN1-Mo. GAPDH serves as a loading control. n-q. Initial toxicity test and associated quantification of viability (n-o) (N = 2 independent experiments) and total number of viable cells (p-q) (N = 1) following HDMB03 treatment with 1, 5, or 10 μM PPHLN1-Mo (n,p) or MADD-Mo (o,q) relative to CTRL-Mo for 48 hours. Source data
Extended Data Fig. 10
Extended Data Fig. 10. A PPHLN1-Mo and MADD-Mo have different effects on MB3W1 Group 3 MB tumor properties.
a. RT PCR validation of specific PPLHN1 or MADD gene exon exclusion following 72 hour 5 μM PPHLN1-Mo or MADD-Mo treatment respectively relative to CTRL-Mo in MB3W1. N = 3 experiments with similar results. b. Representative images of MB3W1 tumorspheres treated with 1 μM control (CTRL-Mo) (left), PPHLN1 (PPHLN1-Mo) (middle) or MADD (MADD-Mo) (right) morpholinos for 5 days. Scale bar: 300 μm. c. Cumulative frequency distribution of MB3W1 tumorsphere size following 5 day treatment with 1 μM CTRL-Mo (black), PPHLN1-Mo (blue) or MADD-Mo (red). Tumorsphere size was analyzed using 2-sample Kolmogorov–Smirnov tests. p < 0.05*, p < 0.01**. CTRL-Mo vs. PPHLN1-Mo, p = 0.0044; CTRL-Mo vs. MADD-Mo, p = 0.0442; PPHLN1-Mo vs. MADD-Mo, p = 0.0071. d–f. Quantification of MB3W1 total live cell number (d), viability (e) and total number of tumorspheres (f) following 72 hour (d-e) or 5 day (f) treatment with CTRL-Mo, PPHLN1-Mo or MADD-Mo. Error bars: SEM. p < 0.05*, p = 0.0475. Results were analyzed using one-way ANOVA and a Tukey’s test for multiple comparisons. g–h. Quantification of MB3W1 tumorsphere viability by Trypan Blue staining following 5 day (g) or 10 day (h) treatment with PPHLN1-Mo relative to CTRL-Mo. Error bars: SEM. p < 0.001***. For G, p < 0.0001. For H, p = 0.0019. Results were analyzed using unpaired t-tests. i. Representative flow cytometry plots depicting Annexin V/7AAD staining following CTRL-Mo (left) and PPHLN1-Mo (right) treatment of MB3W1 tumorspheres. Inset: unstained control. j-k. Quantification of MB3W1 tumorsphere viability by Annexin V staining. j: Annexin V+/7AAD- dying cells, k: Annexin V+/7AAD+ dead cells following 5 day or 10 day treatment with PPHLN1-Mo relative to CTRL-Mo. Error bars: SEM. For 5 days, p = 0.0025, and for 10 days, p = 0.0001. Results were analyzed using unpaired t-tests. l. Schematic depicting PPHLN1-Mo treatment of HDMB03 or MB3W1 tumorpsheres followed by intracerebellar injection into NOD SCID mice and subsequent analyses of tumor volume. m. Immunofluorescent images depicting regions of interest (ROIs) from the CTRL-Mo and PPHLN1-Mo samples utilized for multiplex protein analyses. Samples were stained for MAP2 (green), Ki67 (pink) and Syto13 (blue) for tumor visualization. Scale bar: 5 mm. n. Barplots depicting levels of select cell death and differentiation proteins across ROIs from the CTRL-Mo and PPHLN1-Mo sample. Error bars: SEM. n = 10 selected ROIs from 1 representative slide for each treatment arm. o-p. Kaplan-Meier curve of PPHLN1 exon 6 (chr12:42778741-42778798) (o) and MADD exon 26 (chr11:47330530-47330593) (p) in Group 3 and Group 4 MB tumors showing significant differences in overall survival. Tumors were separated by k-means clustering based on their PSI value. Panel l created with BioRender.com. Source data

References

    1. Louis, D. N., Ohgaki, H., Wiestler, O. D. & Cavenee, W. K. WHO Classification of Tumours of the Central Nervous System 4th edn (IARC Publications, 2016).
    1. Ramaswamy, V. et al. Risk stratification of childhood medulloblastoma in the molecular era: the current consensus. Acta Neuropathol.131, 821–831 (2016). 10.1007/s00401-016-1569-6 - DOI - PMC - PubMed
    1. Hendrikse, L. D. et al. Failure of human rhombic lip differentiation underlies medulloblastoma formation. Nature609, 1021–1028 (2022). 10.1038/s41586-022-05215-w - DOI - PMC - PubMed
    1. Smith, K. S. et al. Unified rhombic lip origins of group 3 and group 4 medulloblastoma. Nature609, 1012–1020 (2022). 10.1038/s41586-022-05208-9 - DOI - PMC - PubMed
    1. Cavalli, F. M. G. et al. Intertumoral heterogeneity within medulloblastoma subgroups. Cancer Cell31, 737–754.e6 (2017). 10.1016/j.ccell.2017.05.005 - DOI - PMC - PubMed

Publication types

MeSH terms