. 2024 Jul 18;14(1):16626.
doi: 10.1038/s41598-024-67718-y.

Metabolism changes caused by glucose in normal and cancer human brain cell lines by Raman imaging and chemometric methods

Affiliations

Metabolism changes caused by glucose in normal and cancer human brain cell lines by Raman imaging and chemometric methods

Monika Kopec et al. Sci Rep. .

Abstract

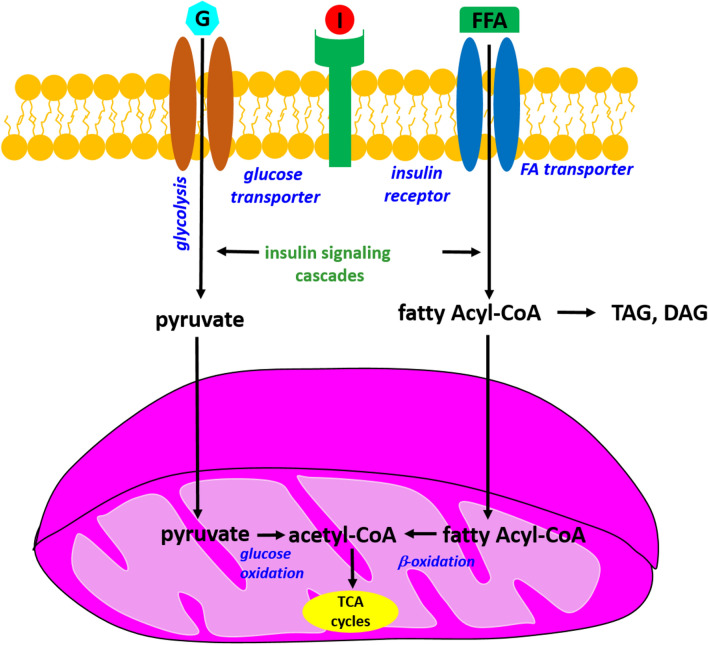
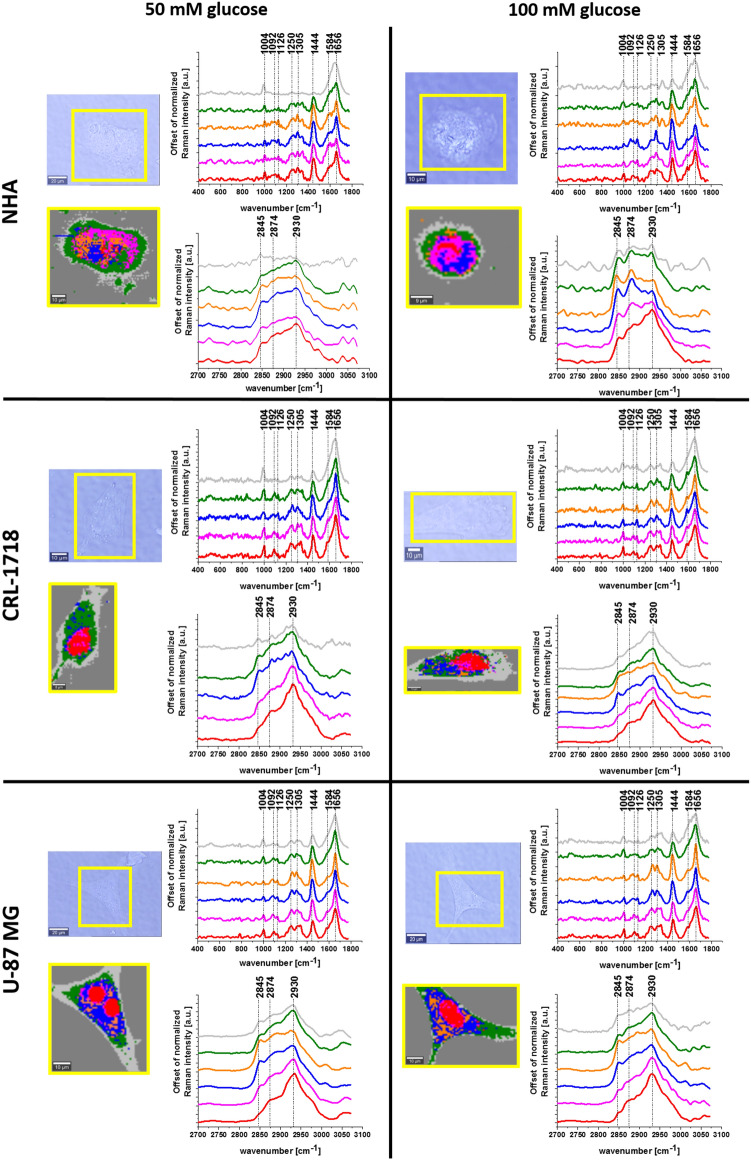
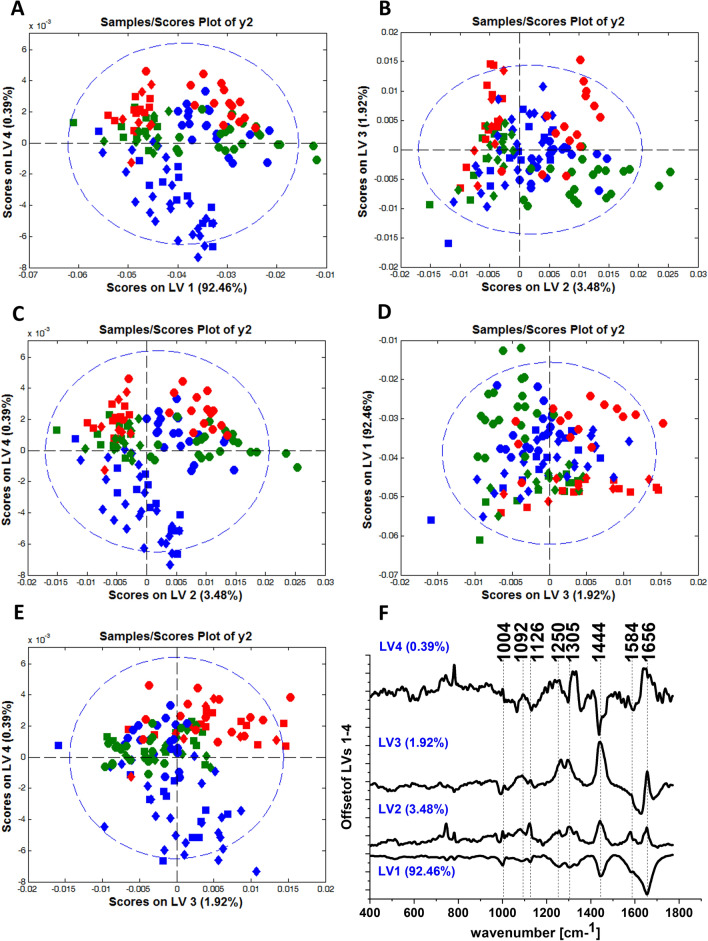
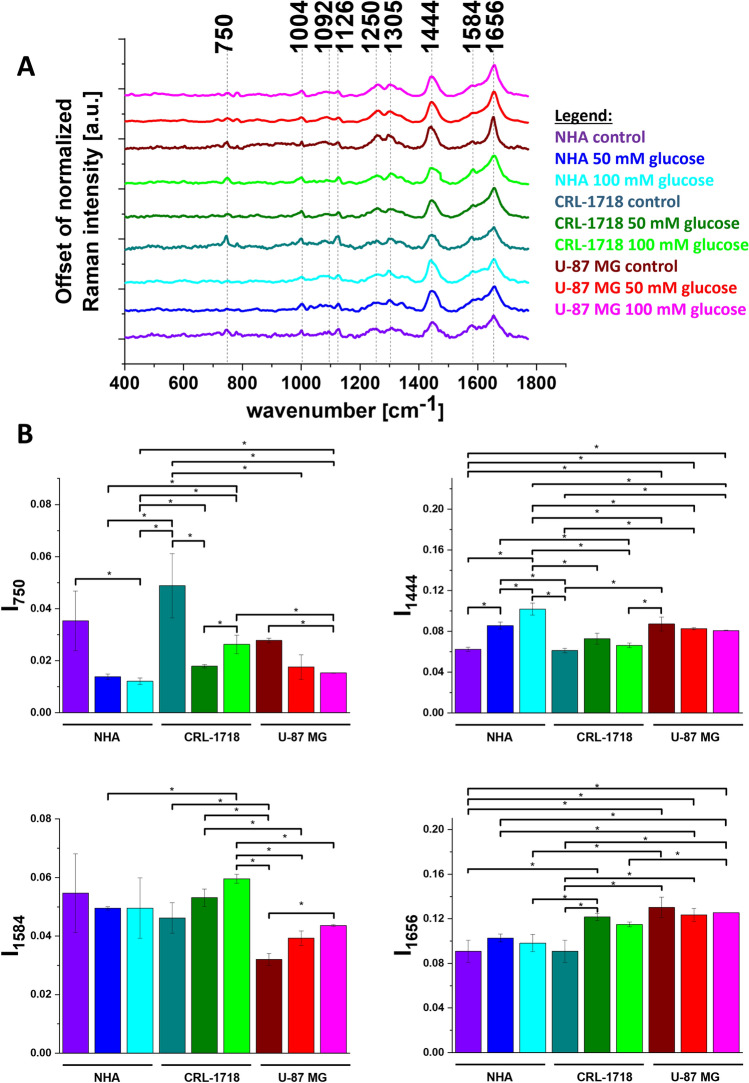
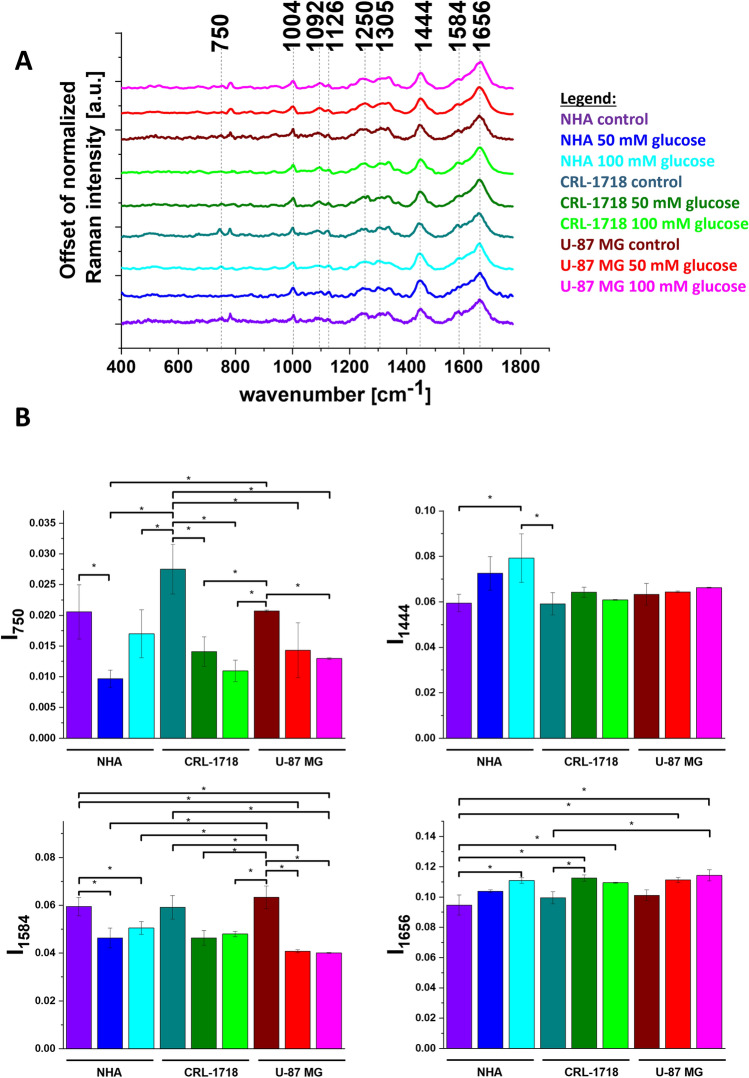
Glucose is the main source of energy for the human brain. This paper presents a non-invasive technique to study metabolic changes caused by glucose in human brain cell lines. In this paper we present the spectroscopic characterization of human normal brain (NHA; astrocytes) and human cancer brain (CRL-1718; astrocytoma and U-87 MG; glioblastoma) control cell lines and cell lines upon supplementation with glucose. Based on Raman techniques we have identified biomarkers that can monitor metabolic changes in lipid droplets, mitochondria and nucleus caused by glucose. We have studied the vibrations at 750 cm-1, 1444 cm-1, 1584 cm-1 and 1656 cm-1 as a function of malignancy grade. We have compared the concentration of cytochrome, lipids and proteins in the grade of cancer aggressiveness in normal and cancer human brain cell lines. Chemometric analysis has shown that control normal, control cancer brain cell lines and normal and cancer cell lines after supplementation with glucose can be distinguished based on their unique vibrational properties. PLSDA (Partial Least Squares Discriminant Analysis) and ANOVA tests have confirmed the main role of cytochromes, proteins and lipids in differentiation of control human brain cells and cells upon supplementation with glucose. We have shown that Raman techniques combined with chemometric analysis provide additional insight to monitor the biology of astrocytes, astrocytoma and glioblastoma after glucose supplementation.

Keywords: Biomarkers; Brain cancer; Glucose; PLS-DA; Raman imaging; Raman spectroscopy.


Conflict of interest statement

The authors declare no competing interests.

Figures

Figure 1
Figure 1
The mechanism of cellular insulin signaling on glucose and fatty acid metabolism; G-Glucose; I-Insulin; FFA-Free fatty acid; TCA cycles-tricarboxylic acid cycle, DAG-Diacylglycerol, TAG-Triacylglycerol.
Figure 2
Figure 2
Molecular formula of glucose (panel A) Raman spectra of glucose in the fingerprint region (panel B) and high-frequency region (panel C).
Figure 3
Figure 3
The microscope images, Raman images and Raman spectra of cell organelles (nucleus (red), mitochondria (magenta), oleic lipid droplets (orange), lipid droplets/endoplasmic reticulum (blue), cytoplasm (green) and cell membrane (grey)) of a typical normal human astrocyte (NHA), astrocytoma (CRL-1718) and glioblastoma (U-87 MG) cells supplemented with 50 mM glucose and 100 mM glucose.
Figure 4
Figure 4
PLS-DA score plots (model: normalization) LV4 vs. LV1 (panel A), LV3 vs. LV2 (panel B), LV4 vs. LV2 (panel C), LV1 vs. LV3 (panel D), LV4 vs. LV3 (panel E) for Raman spectra obtained from Cluster Analysis for NHA (blue color), CRL-1718 (green color) and U-87 MG (red color) control cell line and cell line supplemented with 50 mM glucose and 100 mM glucose: control cells (circle), cells supplemented with 50 mM glucose (square), cells supplemented with 100 mM glucose (diamond); the loadings plots of LV1, LV2, LV3 and LV4 versus wavenumber [cm-1] obtained from PLS-DA analysis (panel F).
Figure 5
Figure 5
Average Raman spectra (panel A) and normalized Raman intensity characteristic for lipid droplets for Raman bands at: 750 cm−1, 1444 cm−1, 1584 cm-1, 1656 cm-1 for NHA, CRL-1718 and U-87 MG cell line without supplementation and supplemented with 50 mM glucose and 100 mM glucose (panel B); * means statistically significant results; p-value≼ 0,05.
Figure 6
Figure 6
Average Raman spectra (panel A) and normalized Raman intensity characteristic for mitochondria for Raman bands at: 750 cm−1, 1444 cm−1, 1584 cm-1, 1656 cm-1 for NHA, CRL-1718 and U-87 MG cell line without supplementation and supplemented with 50 mM glucose and 100 mM glucose (panel B); * means statistically significant results; p-value≼ 0,05.
Figure 7
Figure 7
Average Raman spectra (panel A) and normalized Raman intensity characteristic for nucleus for Raman bands at: 750 cm−1, 1444 cm−1, 1584 cm-1, 1656 cm-1 for NHA, CRL-1718 and U-87 MG cell line without supplementation and supplemented with 50 mM glucose and 100 mM glucose (panel B); * means statistically significant results; p-value≼ 0,05.

References

    1. Wolever TM, Miller JB. Sugars and blood glucose control. Am J Clin Nutr. 1995;62(1 Suppl):212S-221S; discussion 221S-227S. 10.1093/ajcn/62.1.212S - PubMed
    1. Ritter S. Monitoring and Maintenance of Brain Glucose Supply: Importance of Hindbrain Catecholamine Neurons in This Multifaceted Task. Published online 2017. http://europepmc.org/books/NBK453140 - PubMed
    1. Hantzidiamantis PJ, Lappin SL. Physiology, Glucose. StatPearls Publishing, Treasure Island (FL); 2023. http://europepmc.org/books/NBK545201 - PubMed
    1. Cutshaw G, Uthaman S, Hassan N, Kothadiya S, Wen X, Bardhan R. The emerging role of raman spectroscopy as an omics approach for metabolic profiling and biomarker detection toward precision medicine. Chem Rev. 2023;123(13):8297–8346. doi: 10.1021/acs.chemrev.2c00897. - DOI - PMC - PubMed
    1. Hill IE, Boyd M, Milligan K, et al. Understanding radiation response and cell cycle variation in brain tumour cells using Raman spectroscopy. Analyst. 2023;148(11):2594–2608. doi: 10.1039/d3an00121k. - DOI - PMC - PubMed

LinkOut - more resources