. 2024 Sep;25(9):1718-1730.
doi: 10.1038/s41590-024-01910-0. Epub 2024 Jul 18.

Gα13 restricts nutrient driven proliferation in mucosal germinal centers

Affiliations

Gα13 restricts nutrient driven proliferation in mucosal germinal centers

Hang T Nguyen et al. Nat Immunol. 2024 Sep.

Abstract

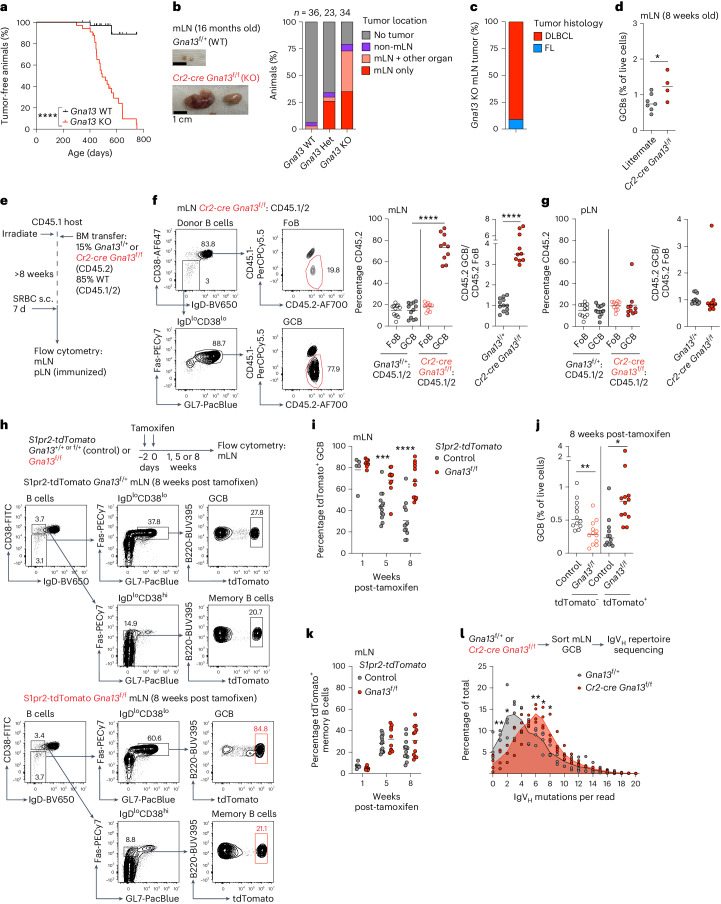
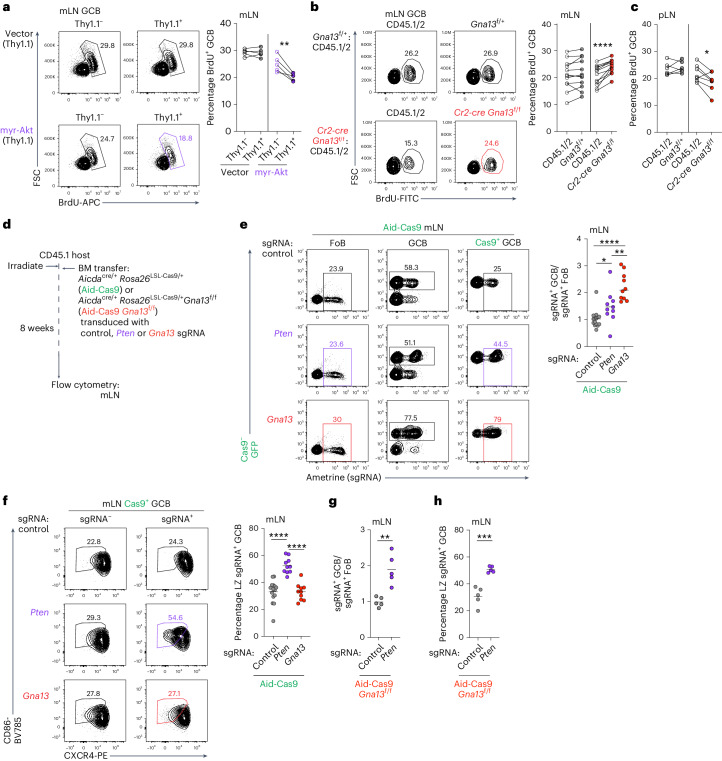
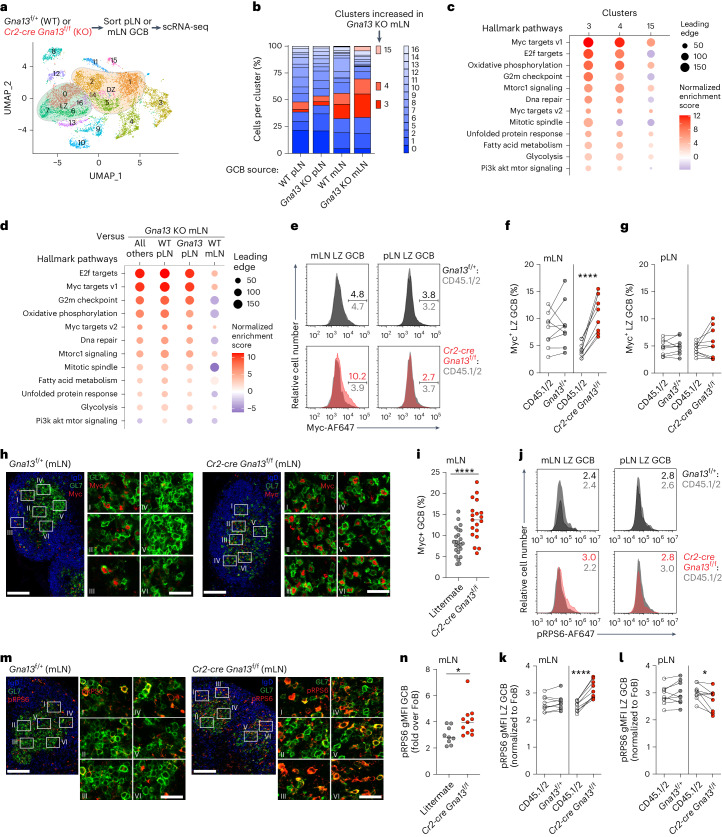
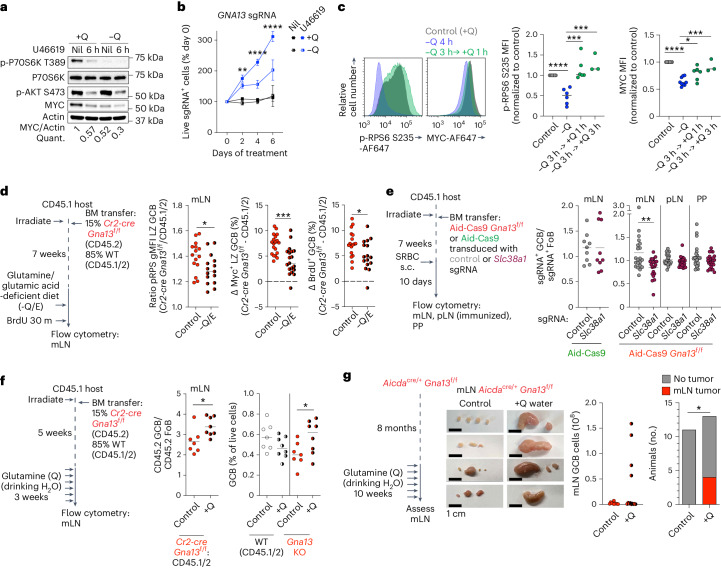
Germinal centers (GCs) that form in mucosal sites are exposed to gut-derived factors that have the potential to influence homeostasis independent of antigen receptor-driven selective processes. The G-protein Gα13 confines B cells to the GC and limits the development of GC-derived lymphoma. We discovered that Gα13-deficiency fuels the GC reaction via increased mTORC1 signaling and Myc protein expression specifically in the mesenteric lymph node (mLN). The competitive advantage of Gα13-deficient GC B cells (GCBs) in mLN was not dependent on T cell help or gut microbiota. Instead, Gα13-deficient GCBs were selectively dependent on dietary nutrients likely due to greater access to gut lymphatics. Specifically, we found that diet-derived glutamine supported proliferation and Myc expression in Gα13-deficient GCBs in the mLN. Thus, GC confinement limits the effects of dietary glutamine on GC dynamics in mucosal tissues. Gα13 pathway mutations coopt these processes to promote the gut tropism of aggressive lymphoma.


Conflict of interest statement

The authors declare no competing interests.

Figures

Fig. 1
Fig. 1. Gα13 suppresses tumor development and GC B cell clonal persistence in the mLN.
a, Tumor-free survival of animals with B cell-specific Gα13-deficiency (Gna13 KO; Cr2-cre Gna13f/f) or WT littermates aged up to 750 days. n = 36 WT, n = 34 Gna13 KO. ****P < 0.0001 log-rank (Mantel–Cox) test. b, Anatomic location of tumors in aged Gna13 WT (Gna13f/+), Gna13 heterozygous (Het) (Cr2-cre Gna13f/+) or Gna13 KO (Cr2-cre Gna13f/f) animals. Example gross image of mLNs from 16-month-old animals on left. Scale bar, 1 cm. c, Pathological classification of mLN tumors in aged Gα13-deficient animals. FL, follicular lymphoma. n = 11. Examples are shown in Extended Data Fig. 1. d, GCBs in mLNs of 8-week-old bred animals. Data are from four experiments, n = 7 littermates, n = 4 Gna13 KO. *P = 0.0357 unpaired two-tailed Student’s t-test. e, Experimental scheme for f and g. s.c., subcutaneous. f,g, Percentages of CD45.2 follicular B cells (FoBs) and GCBs or the ratio of CD45.2 GCB to CD45.2 FoBs in mLNs (f) or pLNs (g) of mixed BM chimeras. Data are pooled from two experiments, n = 12 control, n = 10 Gna13 KO. ****P = 9.58 × 10−12 and 1.41 × 10−6, respectively in f, unpaired two-tailed Student’s t-test. h, Experimental scheme and gating strategy for fate-mapped GCBs and memory B cells for ik. ik, tdTomato+ GCs (i) or tdTomato or tdTomato+ mLN GCBs as a percentage of live cells (j) or tdTomato+ memory B cells (B220+IgDloCD38highFasintGL7; k) in S1pr2-tdTomato mice at 1, 5 or 8 weeks following tamoxifen administration. Data are from ten experiments, n = 5, 7, 13, 10, 12 and 12. ***P = 0.0002, ****P = 1.77 × 10−5 in i, **P = 0.0034, *P = 0.0115 in j, unpaired two-tailed Student’s t-test. l, Mutation frequency per read in IgVH repertoire sequencing of mLN GCBs. n = 4. **P = 0.0047, *P = 0.0252, **P = 0.0094, *P = 0.0223, *P = 0.025 unpaired two-tailed Student’s t-test. KO, knockout. Source data
Fig. 2
Fig. 2. Gα13 suppresses mLN GC B cell proliferation.
a, Percentages of proliferating (BrdU+) GCBs among untransduced (Thy1.1) or transduced (Thy1.1+) cells in mLNs of myr-Akt chimeras generated as in Extended Data Fig. 3a. Data are from one experiment representative of two, n = 5 mice per group. **P = 0.0098 paired two-tailed Student’s t-test. b,c, Percentages of proliferating (BrdU+) GCBs among WT (CD45.1/2) or WT (Gna13f/+) or Gα13-deficient (Cr2-cre Gna13f/f) cells in mLNs (b) or pLNs (c) of mixed BM chimeras. n = 12 mice per group in b pooled from three experiments and n = 6 and 7 mice per group pooled from two experiments in c. ****P = 8.49 × 10−5 for b, *P = 0.028 for c paired two-tailed Student’s t-test. d, Experimental scheme for eh. e,f, Ratio of sgRNA-expressing Cas9+ GCB (sgRNA+ GCB) to sgRNA+ FoB (e) or percentage of LZ sgRNA+ GCB (f) in Aid-Cas9 BM chimeras targeting Pten or Gna13. Data are from three experiments with n = 15, 10 and 10 mice per group. *P = 0.024, **P = 0.0084, ****P = 2.77 × 10−7 unpaired two-tailed Student’s t-test. g,h, Ratio of sgRNA-expressing Cas9+ GCBs (sgRNA+ GCBs) divided by sgRNA+ FoBs (g) or percentage of LZ sgRNA+ GCBs (h) in Aid-Cas9 Gna13f/f BM chimeras targeting Pten. Data are from one experiment, n = 5. **P = 0.0019 for g and ***P = 0.0003 for h, unpaired two-tailed Student’s t-test. Source data
Fig. 3
Fig. 3. Gα13 suppresses mTorc1 signaling and Myc protein expression in mLN GCB cells.
a, Unsupervised clustering of mLN or pLN GCBs from WT or Gα13-deficient mice. Clusters with the highest LZ or DZ signatures are indicated. b, Fraction of cells in each cluster in WT or Gα13-deficient GCBs from pLN or mLN. c, Hallmark gene sets enriched in clusters with increased representation in Gα13-deficient mLNs. d, Gene sets enriched in Gα13-deficient mLNs compared to all other samples. eg, Intracellular FACS of Myc in LZ cells from mLNs or pLNs (e) or percentage of LZ GCBs expressing Myc in mLNs (f) or pLNs (g) in mixed BM chimeras. Data are from two experiments, n = 9. ****P = 7.93 × 10−5 paired two-tailed Student’s t-test for f. h, Confocal microscopy of mLN GCs stained for IgD, GL7 and Myc. Scale bars, 100 μm (whole GC) or 25 μm (inset). i, Percentage of Myc+ GCBs in mLNs quantified by histocytometry. Data are from three experiments, n = 4 littermate, n = 3 Gna13 KO. Each symbol refers to the frequency of Myc+ cells in one GC. ****P = 9.13 × 10−5 unpaired two-tailed Student’s t-test. jl, Intracellular FACS of phospho-RPS6 S240/244 (pRPS6) in LZ cells from mLNs or pLNs (j) or gMFI of pRPS6 normalized to FoBs in LZ GCBs in mLNs (k) or pLNs (l) in mixed BM chimeras. Data are from nine experiments, n = 9. ****P = 9.14 × 10−6, *P = 0.0207 paired two-tailed Student’s t-test. m, Confocal microscopy of mLN GCs stained for IgD, GL7 and pRPS6. Scale bars, 100 μm (whole GC) or 25 μm (inset). n, gMFI of pRPS6 in GCBs relative to FoBs in mLNs quantified by histocytometry. Data are from three experiments, n = 6 littermate, n = 3 Gna13 KO. Each symbol refers to the gMFI of pRPS6 in one GC. *P = 0.022 unpaired two-tailed Student’s t-test. gMFI, geometric mean fluorescence intensity. Source data
Fig. 4
Fig. 4. Gα13 signaling regulates multiple proliferative pathways.
a, GCB-DLBCL cell lines were engineered to express Cas9 and thromboxane receptor (Tbxa2r) and the synthetic thromboxane-A2 mimetic U46619 was added to cells to stimulate Gα13 signaling. b, Tbxa2r-expressing GCB-DLBCL cell lines were treated with the U46619 and the percent of live cells in culture was measured over time. Data are representative of two experiments for each cell line. c, Relative frequency of control or GNA13 sgRNA-expressing NUDUL1 cells with or without U46619. Data are representative of four experiments. d, DNA content of control or GNA13 sgRNA-expressing NUDUL1 cells treated with U46619 for 24 h. Data are representative of two experiments. e, GSEA of control or GNA13-deficient NUDUL1 cells treated for 24 h with U46619. f, MYC or cyclin D3 protein expression in control or GNA13-deficient GCB-DLBCL cells following U46619 treatment for 3 h or 6 h. Data are representative of two independent experiments for each cell line. g, Time course of phospho-P70S6K T389, phospho-RPS6 S235, phospho-Akt S473 and T308 and MYC expression in U46619-treated NUDUL1 cells. Data are representative of three experiments. h,i, Experimental scheme (h) or CRISPR screen scores (CSSs) (i) for a genome-wide CRISPR/Cas9 screen for effectors of Gα13 signaling in GCB-DLBCL cell lines. Inducible Cas9 and Tbxa2r-expressing NUDUL1 or OCI-Ly8 cells were transduced with the genome-wide Brunello sgRNA library, following selection for transduced cells, Cas9 was induced with doxycycline for 7 days, cells were then cultured in the presence or absence of U46619 for 14 days and sgRNA representation was assessed by next-generation sequencing. j,k, Relative frequency of ARHGEF1 (j) or RIC8A (k) sgRNA-expressing NUDUL1 cells with or without U46619. Data are representative of at least three independent experiments. l, Ratio of sgRNA-expressing Cas9+ GCBs (Cas9+sgRNA+ GCBs) to Cas9+ sgRNA+ FoBs in constitutive Cas9 BM chimeras targeting Ric8 generated as shown in Extended Data Fig. 6c. Data are from one experiment n = 5. **P = 0.008 unpaired two-tailed Student’s t-test. Source data
Fig. 5
Fig. 5. Gα13 signaling suppresses MYC translation.
a, Quantitative PCR of MYC in NUDUL1 cells treated with U46619. Each point represents a technical replicate from one experiment representative of two. b,c, MYC protein expression in NUDUL1-Tbxa2r cells treated with U46619 and the neddylation inhibitor, MLN4924 (b) or the GSK-3b inhibitor, CHIR99021 (c) for 1 h. Data are representative of three and two experiments, respectively. d,e, MYC protein expression in NUDUL1 cells treated with U46619 in the presence or absence of MLN4924 (d) or the translation inhibitor, silvestrol (e) for 3 h. Data are representative of three and two experiments, respectively. f, Cartoon depicting Gα13-mediated regulation of MYC protein expression. Source data
Fig. 6
Fig. 6. Dietary factors support Gα13-deficient mLN GCBs.
a, Frequency of GNA13 sgRNA+ NUDUL1 cells treated with U46619 and rapamycin. Data are from one experiment representative of three. **P = 0.0089, ***P = 0.0005, ***P = 0.0003, unpaired two-tailed Student’s t-test. bd, Experimental scheme (b), percentages of Myc+ LZ (c) or BrdU+ (d) GCBs in mLNs of mixed chimeras that were treated with rapamycin. Data are from two experiments, n = 6 vehicle, n = 7 rapamycin. **P = 0.0017, *P = 0.0245, **P = 0.0012, paired two-tailed Student’s t-test, ***P = 0.0007, *P = 0.0139, **P = 0.005, unpaired two-tailed Student’s t-test. e, Ratio of CD45.2 GCBs to CD45.2 FoBs or frequency of GCBs in mLNs of mixed chimeras depleted of CD4+ cells. Data are from two experiments, n = 10. ***P = 0.0003, *P = 0.0459, unpaired two-tailed Student’s t-test. f, Confocal microscopy of mLNs stained for LYVE1, IgD, GL7 and Myc. Scale bars, 100 μm (whole GC) or 25 μm (inset). Data are representative of three experiments, n = 3. g, Ratio of sgRNA+ GCBs to sgRNA+ FoBs in Aid-Cas9 or Aid-Cas9 Gna13f/f BM chimeras targeting S1pr3. Data are from two experiments, n = 10. **P = 0.0035, unpaired two-tailed Student’s t-test. h, Ratio of CD45.2 GCBs to CD45.2 FoBs or frequency of GCBs in mLNs of mixed chimeras treated with antibiotics (ampicillin, vancomycin, neomycin, metronidazole; AVNM). Data are from two experiments, n = 18 control, n = 20 AVNM. ****P = 3.9 × 10−5, **P = 0.0065, unpaired two-tailed Student’s t-test. i,j, Percentage of GCBs in mLNs (i) or Myc+ LZ GCBs (j) in germ-free animals. Data are from 12 experiments, n = 27 littermate, n = 14 Gα13-deficient. *P = 0.0296, unpaired two-tailed Student’s t-test in i. *P = 0.0203, unpaired two-tailed Student’s t-test in j. k, Ratio of CD45.2 GCBs to CD45.2 FoBs (middle) or frequency of GCB (right) in mLNs of mixed chimeras that were fasted of food. Data are from four experiments, n = 13 fed, n = 12 fasted. *P = 0.0263, *P = 0.0201, **P = 0.0028, unpaired two-tailed Student’s t-test. l, Ratio of sgRNA+ GCBs to sgRNA+ FoBs in mLNs of Aid-Cas9 or Aid-Cas9 Gna13f/f BM chimeras targeting Cpt2, Slc2a1 or Rraga. Data are from three experiments, n = 15 control, n = 10 Cpt2, n = 9 Slc2a1, n = 4 Rraga (middle) and from four experiments, n = 20 control, n = 10 Cpt2, n = 13 Slc2a1, n = 4 Rraga (right). **P = 0.0055, **P = 0.0059, ***P = 0.0004, *P = 0.0425, ****P = 3.95 × 10−5, unpaired two-tailed Student’s t-test. Source data
Fig. 7
Fig. 7. Dietary glutamine differentially supports expansion of Gα13-deficient mLN GCBs.
a, Phospho-P70S6K T389, phospho-Akt S473 and MYC expression in NUDUL1 cells treated with U46619 with or without glutamine (Q). Representative of three experiments. b, Relative frequency of GNA13 sgRNA+ NUDUL1 cells treated with U46619 with or without glutamine. Representative of three experiments. **P = 0.0023, ****P = 7.5 × 10−7 and 2.83 × 10−5, respectively, unpaired two-tailed Student’s t-test. c, pRPS6 and MYC expression in NUDUL1 cells cultured without glutamine for 4–6 h or without glutamine for 3 h with glutamine add back for 1–3 h. Data are pooled from four experiments. ****P = 6.5 × 10−5, ***P = 0.0006 or 0.0008 and ****P = 3.4 × 10−10, *P = 0.0141 or ***P = 0.0007, unpaired two-tailed Student’s t-test. d, Ratio or differences in percentages between Gα13-deficient and WT of pRPS6 gMFI or Myc+ in LZ GCB or BrdU+ GCBs in mLNs of mixed chimeras given glutamine and glutamic acid-deficient diet (−Q/E diet). Data are pooled from seven experiments, n = 15, 15, 19, 19, 17 and 16. *P = 0.0225, ***P = 0.0003, *P = 0.0256 unpaired two-tailed Student’s t-test. e, Ratio of sgRNA+ GCBs to sgRNA+ FoBs in Aid-Cas9 or Aid-Cas9 Gna13f/f BM chimeras targeting Slc38a1. Data are pooled from two experiments, n = 9 and from four experiments, n = 21 control, n = 20 Slc38a1. **P = 0.0061, unpaired two-tailed Student’s t-test. f, Ratio of CD45.2 GCBs to CD45.2 FoBs or frequency of GCBs in mLNs of mixed chimeras given glutamine for 3 weeks. Data are pooled from two experiments, n = 7 control, n = 8 glutamine. *P = 0.022 (middle), *P = 0.042 (right), unpaired two-tailed Student’s t-test. g, Images of mLNs, GC B cell number or tumor incidence in Gα13-deficient animals given glutamine at 8 months of age for 10 weeks. Data are pooled from three experiment, n = 11 control, n = 13 glutamine. *P = 0.0219, one-sided chi-squared test. Source data
Extended Data Fig. 1
Extended Data Fig. 1. Gα13 suppresses B cell lymphoma development in the mLN.
Histological analysis of mLN tumors from Cr2-cre Gna13f/f animals aged 14–18 months. Sections were stained with hematoxylin and eosin (H&E) or for IgD and GL7, B220 or CD35. Scale bars: 1 mM in low power H&E and immunohistochemistry images and 20 μm in high power H&E (HPF). Data are from 6 tumors representative of 11 tumors.
Extended Data Fig. 2
Extended Data Fig. 2. Gα13 suppresses cell intrinsic GC B cell expansion in the mLN.
(a) GCB as a percentage of B cells in mLN of 8-week-old bred Cr2-cre Gna13f/f or littermate control (Gna13f/+, Gna13f/f or Cr2-cre Gna13f/+) animals. (b, c) Representative flow cytometric analysis of FoB and GCB in mLN (a) and pLN (b) of Gα13 mixed chimeras generated as in Fig. 1d. (d) Ratio of frequency of CD45.2 GCB to CD45.2 FoB in mLN, pLN and Peyer’s patches (PP) of control or Gα13-deficient mixed chimeras generated as in Fig. 1d. One experiment representative of four, n = 5. ***P = 0.0009, ****P < 0.0001, ***P = 0.0005 unpaired two−tailed Student’s t-test. (e) Ratio of frequency of CD45.2 GCB to CD45.2 FoB in individual lobes of the mLN chain draining the indicated portion of the small intestine, PP or SRBC-immunized pLN. 7 experiments, n = 47 for mLN and PP n = 24 for pLN. ****P < 0.0001, *P = 0.0495 paired two-tailed Student’s t-test. (f) tdTomato- or tdTomato+ mLN GC B cells as a percentage of B cells in S1pr2-tdTomato control or Gna13f/f mice at 8 weeks following tamoxifen administration. **P = 0.0015 unpaired two-tailed Student’s t-test. (g) Percentage of tdTomato+ BM plasma cells in S1pr2-tdTomato control or Gna13f/f mice at 8 weeks following tamoxifen administration. 2 experiments, n = 8 and 6. Source data
Extended Data Fig. 3
Extended Data Fig. 3. Gα13-deficiency does not phenocopy high Akt states in mLN GCs.
(a) Experimental scheme for data in b-g. (b) Representative flow cytometry plots of Thy1.1 retroviral reporter expression in FoB and GCB from mLN of myr-Akt transduced chimeras. (c, d) Percentages of transduced (Thy1.1+) FoB and GCB in mLN (c) or pLN (d) of myr-Akt transduced BM chimeras. One experiment, n = 5. ****P < 0.0001 unpaired two-tailed Student’s t-test for data in c. (e, f) Percentages of LZ GC B cells or amongst untransduced (Thy1.1-) or transduced (Thy1.1+) cells in mLN (e) or pLN (f) of myr-Akt chimeras. One experiment, n = 5. ****P < 0.0001, ***P = 0.0002 unpaired two-tailed Student’s t-test. (g) Percentages of proliferating (BrdU+) GC B cells amongst untransduced (Thy1.1-) or transduced (Thy1.1+) cells in pLN of myr-Akt chimeras. One experiment, n = 5. *P = 0.0465 paired two−tailed Student’s t-test. (h-i) Percentages of LZ GC B cells amongst WT (CD45.1/2) or WT (Gna13f/+) or Gα13-deficient (Cr2-cre Gna13f/f) cells in mLN (h) or pLN (i) of mixed BM chimeras generated as in Fig. 1a. 2 experiments, n = 12 and 10. **P = 0.0094 unpaired two-tailed Student’s t-test for data in i. (j-l) Intracellular FACS for pAkt S473 in LZ cells from mLN or pLN (j) or gMFI of pAkt S473 normalized to FoB in LZ GC B cells in mLN (k) or pLN (l) in mixed BM chimeras generated as in Fig. 1d. Three experiments, n = 3. *P = 0.0402 paired two-tailed Student’s t-test for l. Source data
Extended Data Fig. 4
Extended Data Fig. 4. Gene signatures enriched in Gα13-deficient mLN GCB.
(a) Distribution of control (Gna13f/+) or Gα13-deficient (Cr2-cre Gna13f/f) pLN or mLN GCB in UMAP plot. (b) Enrichment scores for Light Zone or Dark Zone projected onto UMAP plots. (c-e) Enrichment scores for MYC TARGETS V1 (c), E2F TARGETS (d) and MTORC1 SIGNALING (e) gene signatures projected onto UMAP plots of each sample type. (f) Differentially expressed genes in clusters with increased representation in Gα13-deficient mLN GC B cells. (g) Hallmark gene set enrichment in WT mLN compared to pLN GC B cells or Gα13-deficient pLN GC B cells compared to all other samples or WT pLN GCB. (h) Gene set enrichment plots for Gα13-deficient mLN GCB compared to all other samples. (i-j) Intracellular FACS for Cyclin D3 in mLN (i) or pLN (j) from control or Gα13-deficient mixed BM chimeras. Example FACS plots are shown on the left in i with Cyclin D3 MFI indicated. Six experiments, n = 14 and 18 for i. Five experiments, n = 13 and 12 for j. ****P < 0.0001, *P = 0.0326 unpaired two-tailed Student’s t-test. Source data
Extended Data Fig. 5
Extended Data Fig. 5. Gα13 signaling promotes Cyclin D3 degradation.
(a, b) Relative frequency of GNA13 sgRNA-expressing OCI-LY8 (a) or Dogkit (b) cells with or without U46619. One experiment representative of 2. (c) Experimental scheme for data in 4 l. (d) Quantitative PCR of CCND3 in NUDUL1 cells treated with U46619. Each point represents a technical replicate. One experiment representative of 2. (e-f) Cyclin D3 protein expression in NUDUL1 cells treated with U46619 and MLN4924 for 3 hours (e) or 6 hours (f). One experiment representative of three or two, respectively. (g) Phospho-Cyclin D3 expression in NUDUL1 cells treated with U46619 and MLN4924 for 1 hour. One experiment representative of 2. Source data
Extended Data Fig. 6
Extended Data Fig. 6. Fatty acids, glucose and Rag-dependent nutrients do not differentially support expansion of Gα13-deficient mLN GC B cells.
(a) Frequency of WT or Gα13-deficient GCB as a percentage of B cells in mLN of Gα13-deficient mixed chimeras described in 6e. ****P < 0.0001 and *P = 0.0134 unpaired two-tailed Student’s t-test. (b) Ratio of sgRNA+ GCB to sgRNA+ FoB in pLN or PP of Aid-Cas9 BM chimeras targeting S1pr3. 2 experiments, n = 10. (c) Frequency of WT or Gα13-deficient GCB as a percentage of B cells in mLN of Gα13-deficient mixed chimeras described in 6 h. **P = 0.0045 unpaired two-tailed Student’s t-test. (d) Frequency of GCB of B cells in mLN in germ-free Cr2-cre Gna13f/f or littermate control (Gna13f/+, Gna13f/f or Cr2-cre Gna13f/+) animals. *P = 0.0328 (e) Frequency of WT or Gα13-deficient GCB as a percentage of B cells in mLN of Gα13-deficient mixed chimeras described in 6k. *P = 0.0212, **P = 0.0035 unpaired two-tailed Student’s t-test. (f) Relative frequency of GNA13 sgRNA-expressing NUDUL1 cells with U46619 in the presence or absence of the Cpt1 inhibitor, Etomoxir. One experiment representative of 2. (g) Ratio of CD45.2 GCB to CD45.2 FoB in mLN of Gα13-deficient mixed chimeras that were fed medium chain triglyceride (MCT) or high fat (HF) diet for 3 weeks prior to analysis. 2 experiments, n = 11, 12 and 12. *P = 0.0189 unpaired two-tailed Student’s t-test. (h-i) Relative frequency of GNA13 sgRNA-expressing NUDUL1 cells with U46619 in the presence of 2-deoxy-glucose (2-DG) (h) or in the absence of glucose and pyruvate (i). One experiment representative of 2. (j) Relative frequency of RRAGA sgRNA-expressing NUDUL1 cells in the presence or absence of U46619. One experiment representative of three. Source data
Extended Data Fig. 7
Extended Data Fig. 7. Dietary glutamine differentially supports Gα13-deficient mLN GC B cells.
(a) MYC expression in NUDUL1 cells cultured in the absence of glutamine for 4 hours or in the absence of glutamine for 3 hours with glutamine add back for 1 hour prior to analysis in the presence or absence of U46619. Four experiments. ***P = 0.0009 and **P = 0.0062 unpaired two-tailed Student’s t-test. Some of the data points from cells not treated with U46619 are the same as in Fig. 7c and are included for comparison. (b–d) gMFI of pRPS6 (b) in LZ GCB or percentage of Myc+ cells (c) in LZ GCB or percentages of BrdU+ cells (d) in GCB in mLN of mixed chimeras that were fed a diet deficient in glutamine and glutamic acid (-Q/E diet) for at least 2 days. Pooled from 7 experiments, n = 15 in b, n = 19 in c. n = 17 and 16 in d. ****P < 0.0001 paired two-tailed Student’s t-test for data within chimeras. *P = 0.0331, ****P < 0.0001, **P = 0.0039 unpaired two-tailed Student’s t-test for data between chimeras. (e) Expression of glutamine transporters in publicly available RNA sequencing data of sorted GCB (Immgen.org). (f) Expression of Slc38a1 across clusters of GCB from scRNA-seq data described in Fig. 3a. (g) Ratio of sgRNA+ GCB to sgRNA+ FoB in pLN and PP of Aid-Cas9 BM chimeras targeting Slc38a1. 2 experiments, n = 9 and 10. (h-i) Frequency of WT or Gα13-deficient GCB as a percentage of B cells in mLN (h) or ratio of CD45.2 GCB to CD45.2 FoB in pLN (i) of Gα13-deficient mixed chimeras described in Fig. 7f. *P = 0.0168 between WT (CD45.1/2) cells and *P = 0.0445 between Gna13 KO cells unpaired two-tailed Student’s t-test in h. (j) Images of mLN (middle panel), GCB number (right panel) in Gα13-sufficient animals that were given glutamine (28 g/L) in drinking water at 8 months of age for 10 weeks prior to analysis. Scale bars: 1 cm. One experiment, n = 5. Source data

References

    1. Victora, G. D. & Nussenzweig, M. C. Germinal centers. Annu. Rev. Immunol.40, 413–442 (2022). 10.1146/annurev-immunol-120419-022408 - DOI - PubMed
    1. Calado, D. P. et al. The cell-cycle regulator c-Myc is essential for the formation and maintenance of germinal centers. Nat. Immunol.13, 1092–1100 (2012). 10.1038/ni.2418 - DOI - PMC - PubMed
    1. Dominguez-Sola, D. et al. The proto-oncogene MYC is required for selection in the germinal center and cyclic reentry. Nat. Immunol.13, 1083–1091 (2012). 10.1038/ni.2428 - DOI - PMC - PubMed
    1. Ersching, J. et al. Germinal center selection and affinity maturation require dynamic regulation of mTORC1 Kinase. Immunity46, 1045–1058 e1046 (2017). 10.1016/j.immuni.2017.06.005 - DOI - PMC - PubMed
    1. Saxton, R. A. & Sabatini, D. M. mTOR signaling in growth, metabolism, and disease. Cell169, 361–371 (2017). 10.1016/j.cell.2017.03.035 - DOI - PubMed

MeSH terms

Substances