. 2024 Sep;21(9):1624-1633.
doi: 10.1038/s41592-024-02360-0. Epub 2024 Jul 18.

Single-cell EpiChem jointly measures drug-chromatin binding and multimodal epigenome

Affiliations

Single-cell EpiChem jointly measures drug-chromatin binding and multimodal epigenome

Chao Dong et al. Nat Methods. 2024 Sep.

Abstract

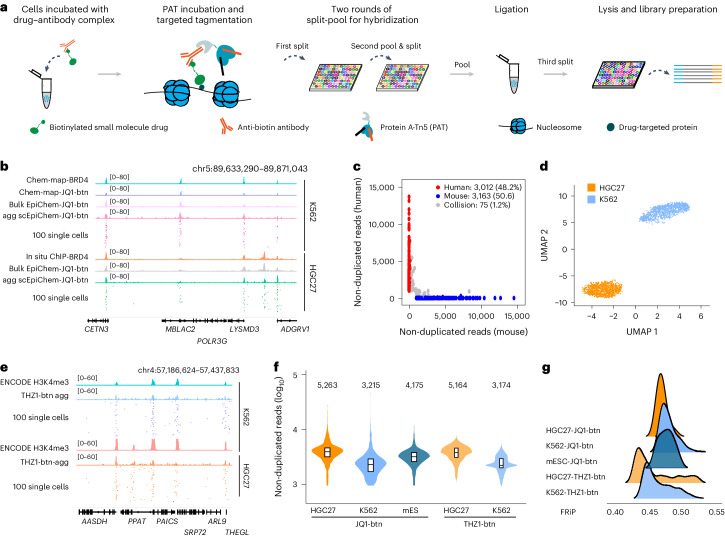
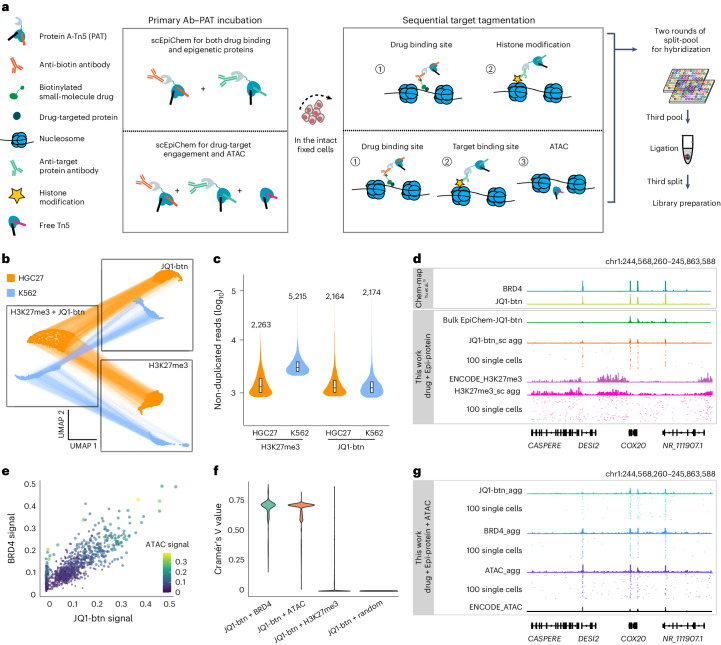
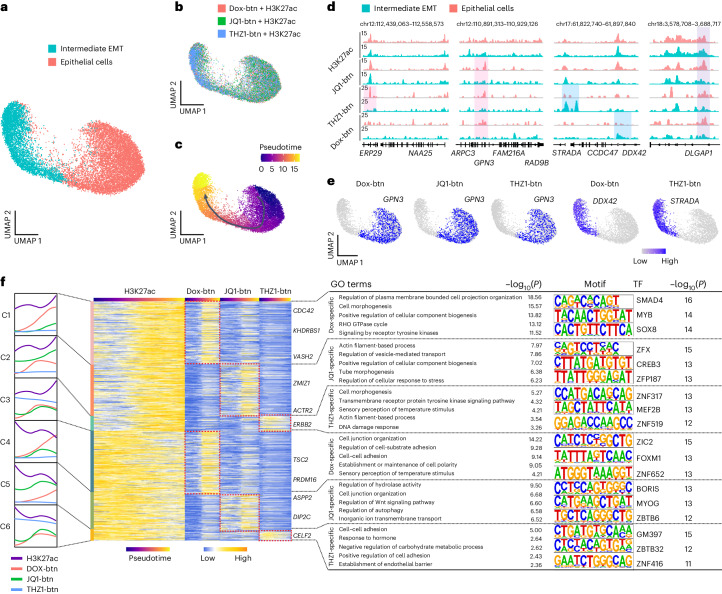
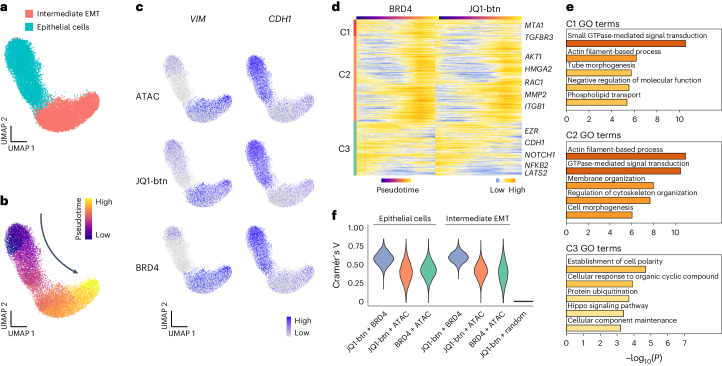
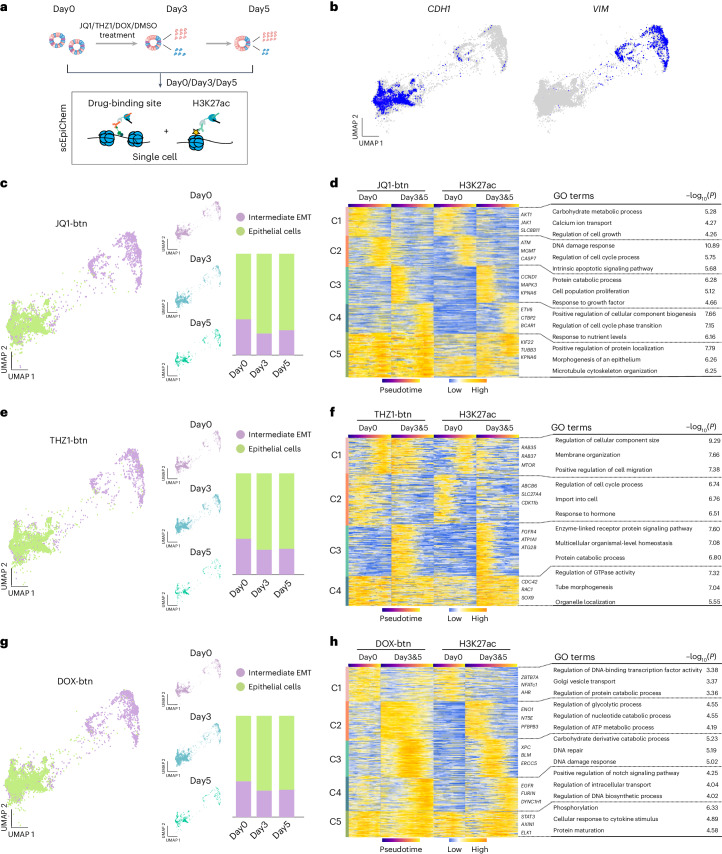
Studies of molecular and cellular functions of small-molecule inhibitors in cancer treatment, eliciting effects by targeting genome and epigenome associated proteins, requires measurement of drug-target engagement in single-cell resolution. Here we present EpiChem for in situ single-cell joint mapping of small molecules and multimodal epigenomic landscape. We demonstrate single-cell co-assays of three small molecules together with histone modifications, chromatin accessibility or target proteins in human colorectal cancer (CRC) organoids. Integrated multimodal analysis reveals diverse drug interactions in the context of chromatin states within heterogeneous CRC organoids. We further reveal drug genomic binding dynamics and adaptive epigenome across cell types after small-molecule drug treatment in CRC organoids. This method provides a unique tool to exploit the mechanisms of cell type-specific drug actions.


Conflict of interest statement

The authors declare no competing interests.

Figures

Fig. 1
Fig. 1. Single-cell EpiChem profiling of genomic binding sites of small-molecule drugs.
a, Schematic of single-cell EpiChem design. b, Track view displaying JQ1-btn signals in K562 and HGC27 cells at the representative loci. Genomic tracks of JQ1-btn binding in bulk level (JQ1-btn), single cell aggregate (JQ1-btn agg) and randomly selected 100 single cells alongside those of related proteins were presented. Chem-map data were downloaded from GSE209713. c, Scatter-plot of the human–mouse species mixing test using JQ1-btn signals. Points are colored by the cell identity as human (red, >95% of reads mapping to hg19) and mouse (blue, >95% of reads mapping to mm10) or collision (gray, 5% to 95% of reads mapping to either genome). d, UMAP visualization showing K562 (n = 2,000) and HGC27 cells (n = 2,000) colored by cell types, based on JQ1-btn signals. e, Track view displaying THZ1-btn signals in K562 and HGC27 cells at the representative loci. Genomic tracks of small-molecule genomic bindings at bulk level (THZ1-btn), single cell aggregate (THZ1-btn agg) and randomly selected 100 single cells alongside those of related proteins were presented. f, Violin plot showing non-duplicated reads per cell of JQ1-btn and THZ1-btn of K562 (n = 2,000), HGC27 (n = 2,000) and mES cells (n = 2,000). Numbers on the top of violin plot indicate the median value. g, Ridge plot showing the FRiP of JQ1-btn, THZ1-btn in K562, HGC27 and mES cells. Source data
Fig. 2
Fig. 2. Single-cell EpiChem enables joint assay of small-molecule JQ1 genomic binding and histone modification or chromatin accessibility.
a, Schematic of single-cell EpiChem design for the joint assay. b, UMAP embedding of dual modalities of scEpiChem data for JQ1-btn and H3K27me3. Connecting lines represent the same cells in different modalities (3,619 cells in two biological replicates). c, Violin plot showing the median non-duplicated reads of JQ1-btn and H3K27me3 of K562 (n = 2,000) and HGC27 cells (n = 2,000). Boxes in the violin plots: center marks the median and edges of boxes define the 25th and 75th percentiles. d, Track view of aggregate single cells of scEpiChem (dual modalities) K562 data and random 100 single cells with bulk reference, at the DESI2 loci. Chem-map data were downloaded from GSE209713; ENCODE H3K27me3 were downloaded from GSE31755. e, Visualization of single-cell ATAC, BRD4, JQ1-btn modality of scEpiChem tri-modality data in K562 cells (n = 1,261). Normalized signal was calculated by JQ1-btn, BRD4 and ATAC read counts in 56,352 BRD4 peaks and then z-score normalized. f, Violin plots depicting the calculated Cramér’s V of association between JQ1-btn & BRD4 modalities (n = 1,261, median 0.71), JQ1-btn & ATAC (n = 1,261, median 0.65), JQ1-btn & H3K27me3 (n = 3,619, median 0.07) and JQ1-btn & random (n = 1,261, median 0.03). g, Track view of aggregated single cells of scEpiChem (tri-modalities) data and random 100 single cells with bulk reference from ENCODE at the DESI2 loci. ENCODE ATAC were downloaded from GSE90409. Source data
Fig. 3
Fig. 3. Single-cell EpiChem identifies cell type-specific genomic binding dynamics of three small-molecule drugs in human CRC organoids.
a, UMAP showing scEpiChem (small molecules and H3K27ac) in human CRC organoids (n = 14,027), identified as epithelial cells (n = 9,341) and Intermediate EMT cells (n = 4,686). b, UMAP showing undetected batch effects in different scEpiChem experiments (small molecules and H3K27ac) in CRC organoids (n = 14,027), visualizing Dox-btn + H3K27ac (n = 4,793), JQ1-btn + H3K27ac (n = 4,810) and THZ1-btn + H3K27ac (n = 4,424). c, Pseudotime trajectory showing EMT progression. d, Track view displaying signals of H3K27ac and three small molecules in epithelial and intermediate EMT cells on the representative loci of cell type-specific drug binding sites. The pink, blue and purple shading represents epithelial cell-specific, intermediate EMT-specific and common peaks, respectively. e, UMAP projections showing gene activity scores of GPN3, DDX42 and STRADA among small molecules. f, Aggregate curves (left) and heatmaps (middle) showing dynamic genomic signals of H3K27ac and small molecules (Dox-btn, JQ1-btn and THZ1-btn) along the pseudotime. Representative genes in each cluster were labeled on the right. The top three enriched GO terms in each cluster are shown (right). De novo transcription factor motifs in peaks were discovered using Homer. P values were calculated by the Binomial test. The results of GO term enrichment analysis using a hypergeometric test, with two-sided statistical tests and adjustments for multiple comparisons employing the Benjamini–Hochberg method. Source data
Fig. 4
Fig. 4. Single-cell EpiChem enables dynamic mapping of JQ1-btn genomic binding and its target BRD4 engagement in human CRC organoids.
a, UMAP showing scEpiChem (JQ1-btn, BRD4 and ATAC) in human CRC organoids (n = 19,983), identified as epithelial cells (n = 10,981) and Intermediate EMT cells (n = 9,004). b, The pseudotime trajectory of the EMT progression. c, UMAP projections showing the gene activity scores of VIM and CDH1. d, Heatmaps showing dynamic genomic signals of BRD4 and JQ1 along the pseudotime. Rows were clustered by hierarchical co-clustering and smoothed by the step size of one. Representative genes in each cluster were labeled on the right. e, Top five enriched GO terms of each small molecule (C1:1,384, C2:3,615, C3:2,917) are shown on the right. The P values of GO term enrichment analysis were calculated using a hypergeometric test, with two-sided statistical tests and adjustments for multiple comparisons employing the Benjamini–Hochberg method. f, Violin plots showing Cramér’s V of association between JQ1-btn + BRD4 (median 0.69), JQ1-btn + ATAC (median 0.48), BRD4 + ATAC (median 0.51) in epithelial cells (n= 10,981); and JQ1-btn + BRD4 (median 0.71), JQ1-btn + ATAC (median 0.50), BRD4 + ATAC (median 0.47) in Intermediate EMT cells (n = 9,004) and JQ1-btn + random (n = 1,261, median 0.03). The same number of simulated random genomic regions (42,782) as for BRD4 peaks was used. Source data
Fig. 5
Fig. 5. Single-cell EpiChem identifies drug sensitivity across cell types with drug genomic binding sites and chromatin states in human CRC organoids.
a, Experimental workflow for small-molecule drug treatment of human CRC organoids. b, UMAP projections showing the gene activity scores of VIM, CDH1. c, UMAP showing scEpiChem (JQ1-btn and H3K27ac) in human CRC organoids (n = 8,797), identified as epithelial cells (n = 6,334) and intermediate EMT cells (n = 2,463). The stacked bar plot shows the proportion of different cell types at each time point (right). d, Heatmaps showing dynamic genomic signals of JQ1-btn along the pseudotime. Cells were ordered by 33,131 peaks in JQ1-btn with 229 columns in Day0 (untreated), 228 columns in Day3&5 (treated). The top three enriched GO terms in each cluster are shown (right). e, UMAP showing scEpiChem (THZ1-btn and H3K27ac) in human CRC organoids (n = 9,574), identified as epithelial cells (n = 6,675) and intermediate EMT cells (n = 2,899). f, Heatmaps showing dynamic genomic signals of THZ1-btn along the pseudotime. Cells were ordered by 22,054 peaks in THZ1-btn with 171 columns in Day0 (untreated) and 193 columns in Day3&5 (treated). The top three enriched GO terms in each cluster were shown (right). g, UMAP showing scEpiChem (Dox-btn and H3K27ac) in human CRC organoids (n = 9,239), identified as epithelial cells (n = 6,318) and intermediate EMT cells with a high EMT score (n = 2,921). h, Heatmaps showing dynamic genomic signals of Dox-btn along the pseudotime. Cells were ordered by 17,908 peaks in Dox-btn with 174 columns in Day0 (untreated) and 282 columns in Day3&5 (treated, columns referring to metacells with 50 single cells each). The top three enriched GO terms in each cluster were shown. The top three enriched GO terms in each cluster are shown. P values of GO term enrichment analysis in d, f and h were calculated using hypergeometric test, with two-sided statistical tests and adjustments for multiple comparisons employing the Benjamini–Hochberg method. Source data
Extended Data Fig. 1
Extended Data Fig. 1. Characterization of native and biotinylated small molecules.
a 1H NMR spectrum (400 MHz) of Doxorubicin-btn (Dox-btn) in DMSO solvent. b Mass spectrum of Dox-btn. c-e Effect of different native small molecules and biotinylated derivatives on K562 (top), HGC27 (middle) and colorectal cancer organoids (bottom) proliferation. Cells were treated with varying concentrations of JQ1 and JQ1-btn (c), THZ1 and THZ1-btn (d), and Dox and Dox-btn (e). Mean ± s.d. (n = 3). f-h Confocal microscopy of K562 (top), HGC27 (middle) and colorectal cancer organoids (bottom) treated with different small molecules and biotinylated derivatives. Cells were stained for JQ1 and JQ1-btn (f), THZ1 and THZ1-btn (g), and Dox and Dox-btn (h) by the anti-biotin antibody. Nuclei were stained with DAPI. Scale bars, 20 μm (f, g, h). Shown are one of experiments repeated at least three times.
Extended Data Fig. 2
Extended Data Fig. 2. Data reproducibility of EpiChem and scEpiChem experiments.
a-h Scatter plot showing correlation between biological replicates in EpiChem (a), scEpiChem (single modality: JQ1-btn) in K562, mESC and HGC27 (b), scEpiChem (single modality: THZ1-btn) in K562 and HGC27 (c), scEpiChem (dual modalities: JQ1-btn and H3K27me3) in K562 and HGC27 (d), scEpiChem (tri-modality: JQ1-btn, BRD4 and H3K27ac) in K562 (e), scEpiChem (tri-modality: JQ1-btn, BRD4 and ATAC) in K562 (f), scEpiChem (dual modalities: H3K27ac and small molecule) in CRC organoids (g) and scEpiChem (tri-modality: JQ1-btn, BRD4 and ATAC) in CRC organoids (h). Each replicate represents one individual experiment.
Extended Data Fig. 3
Extended Data Fig. 3. Characterization of EpiChem profiling of genomic binding sites of the BET bromodomain-targeting drug JQ1-btn in K562 and HGC27 cells.
a EpiChem workflow. b Track view displaying EpiChem signals of JQ1-btn in K562 and HGC27 cells, on the representative loci of cell-type specific drug binding sites (FERMT3). BRD4 (in situ ChIP) and JQ1-btn (in vitro and in vivo experiments) data were obtained in this work, alongside JQ1 and biotin as two negative controls. Chem-map data were downloaded from GSE209713. c Heatmap showing EpiChem signals around Chem-map BRD4 peak regions (51,963). The rows were sorted by the descending signals of Chem-map BRD4 signals. d Genomic distributions of JQ1-btn peaks from EpiChem in vitro and in vivo experiments. Total peaks number: K562-JQ1-btn in vitro: 72,799; K562-JQ1-btn in vivo: 39,036; HGC27-JQ1-btn in vitro: 58,907; HGC27-JQ1-btn in vivo: 38,039. e Venn diagram showing peak overlap in (d) of JQ1-btn (in vitro and in vivo) in K562 and HGC27 cells. Overlap peak numbers: K562 JQ1-btn in vivo and in vitro: 15,627; HGC27 JQ1-btn in vivo and in vitro:33,289; K562 JQ1-btn in vitro and HGC27 JQ1-btn in vitro: 19,288; K562 JQ1-btn in vitro and HGC27 JQ1-btn in vitro: 22,872. f Spearman correlation of JQ1-btn (in vitro and in vivo) and BRD4 (in situ ChIP) binding signals within the Chem-map BRD4 peak regions (51,963) in K562 and HGC27 cells. g Spearman correlation of JQ1-btn (in vitro or in vivo) or BRD4 binding signals in K562 and HGC27 cells, in 10 kb genome wide. h Average JQ1-btn (in vitro and in vivo), JQ1 and biotin signals in K562 cells were plotted at the 5 kb flanking regions around the peak center of BRD4 from Chem-map (51,963).
Extended Data Fig. 4
Extended Data Fig. 4. Single-cell EpiChem simultaneously detects JQ1–BRD4 engagement and chromatin accessibility/H3K27me3.
a The structure of scEpiChem sequencing library. b The expected number of barcode combinations using different numbers of PAT barcode introduced during tagmentation. The arrow indicated the expected barcode combinations in our scEpiChem experiments. c Expected collision rate for different cells per experiment in scEpiChem. d Read distribution for human/mouse mix-species scEpiChem data. The red dashed line indicates 1,000 non-duplicated reads, and barcodes with less than 1,000 reads were excluded from further analyses. e The broken line plot shows collision rate in the human-mouse species mixing test by scEpiChem single modality (JQ1-btn) data. f Benchmarking the ability of clustering of scEpiChem data with different sequencing depth. Box plots show the number of ‘Mixed’ cells occupying non-ambiguous clusters defined exclusively by either K562 or HGC27 cells in 80%, 40%, 20% down sampled reads. g The cluster accuracy of scEpiChem varied with down sampling reads. The line graph illustrates the change in the cluster accuracy, defined exclusively by either K562 or HGC27 cells in 80%, 40%, 20% down sampling reads. Shaded error band shows the 95% confidence interval (mean ± 2 SEM). h The boxplots show the number of single-cell detected reads in bulk peaks with scEpiChem after down sampling the reads of the single modality data from 20% (left) to 80% (right) (n = 2,000). i Heatmap showing Pearson correlation of aggregated single-cell genome-wide signals of JQ1-btn and H3K27me3 of dual modalities scEpiChem data in 2,000 K562 cells, and JQ1-btn or BRD4 signals from Chem-map, or H3K27me3 signals from ENCODE data. j-k ROC curves for aggregate JQ1&BRD4&H3K27ac (j) and JQ1&BRD4&ATAC (k) tri-modality scEpiChem data in K562 cells. Values next to indicated group names are the area under the ROC (AUC). The aggregate BRD4 data serves as the gold standard for specificity analysis.
Extended Data Fig. 5
Extended Data Fig. 5. The discrepancies of binding site of JQ1-btn and its target BRD4 were revealed through scEpiChem data in K562 cells.
a Track view of JQ1-btn and BRD4 signals on the representative loci in K562 cells. JQ1-btn specific loci (left), BRD4 specific loci (middle) and JQ1-btn and BRD4 shared loci (right). b Venn diagram showing peak overlap of JQ1-btn and BRD4 in K562 cells. Overlap peak numbers of JQ1-btn and BRD4: 19,342; JQ1-btn specific peak numbers: 5,289; BRD4 specific peak numbers: 3,213. c Genomic distributions of scEpiChem peaks of JQ1-btn and BRD4 in K562 cells. d Heatmap showing JQ1 and BRD4 binding signals of scEpiChem data in JQ1-specific (top), shared (middle) and BRD4-specific (bottom) peaks in K562 cells.
Extended Data Fig. 6
Extended Data Fig. 6. Characterization of scEpiChem data in human CRC organoids.
a Spearman correlation of THZ1-btn and Dox-btn binding signals in bulk and single cell data within the TSS 5±kb regions in human CRC organoids. b ROC curves for CRC bulk and single cell aggregated THZ1-btn (4,424 cells) or Dox-btn (4,793 cells), using CRC bulk THZ1-btn or Dox-btn data as gold standard. AUC: THZ1-btn, 0.9561; Dox-btn, 0.8361. c UMAP showing scEpiChem data (small molecules and H3K27ac) on CRC organoids (n = 14,027 cells) with projections of the gene activity scores of the EMT score and CDH1. The EMT score was calculated based on 1,184 signature genes (http://www.dbemt.bioinfo-minzhao.org/). d UMAP showing the batch effect of scEpiChem (small molecules and ATAC; small molecules, target and ATAC) on CRC organoids data from two samples, p1201 (n = 6,209) and p20 (n = 3,222); p1201 (n = 12,790) and p20 (n = 8,993). e Track view of H3K27ac and Dox-btn signals on the representative loci in CRC organoid cells. f Genomic distributions of scEpiChem peaks of Dox-btn and H3K27ac in CRC organoid cells. g Venn diagram showing peak overlap of Dox-btn and H3K27ac in CRC organoid cells. h GO terms enriched by Dox-btn-specific peaks. P-value was calculated by binomial test. The results of GO term enrichment analysis using a hypergeometric test, with two-sided statistical tests and adjustments for multiple comparisons employing the Benjamini-Hochberg method. i-j Distribution of the median non-duplicated reads for single cells in H3K27ac (n = 12,066), Dox-btn (n = 3,052), JQ1-btn (n = 4,012) and THZ1-btn (n = 3,453) with scEpiChem (small molecules and H3K27ac) (i) and ATAC (n = 10,672), BRD4 (n = 5,809) and JQ1-btn (n = 5,302) with scEpiChem (small molecules, target and ATAC) (j) in CRC organoids data. Boxes in the violin plots: center marks the median; edges of boxes define the 25th and 75th percentiles.
Extended Data Fig. 7
Extended Data Fig. 7. The discrepancies of binding site of JQ1-btn and its target BRD4 were revealed through scEpiChem data in CRC organoids.
a Track view of JQ1-btn and BRD4 signals on the representative loci in epithelial cells and Intermediate EMT. b Venn diagram showing peak overlap of JQ1-btn and BRD4 in epithelial cells and Intermediate EMT. Overlap peak numbers of JQ1-btn and BRD4 in epithelial cells (26,999) and Intermediate EMT (21,459); JQ1-btn specific peak numbers in epithelial cells (5,614) and Intermediate EMT (8,326); BRD4 specific peak numbers in epithelial cells (15,733) and Intermediate EMT (8,630). c Genomic distributions of scEpiChem peaks of JQ1-btn and BRD4 in epithelial cells and Intermediate EMT. d Heatmap showing JQ1 and BRD4 binding signals of scEpiChem data in JQ1-specific (top), shared (middle) and BRD4-specific (bottom) peaks in epithelial cells and Intermediate EMT.
Extended Data Fig. 8
Extended Data Fig. 8. Characterization of scEpiChem data in human CRC organoids after treatment with invidual small molecules.
a Violin plot showing the median non-duplicated reads per cell of Dox-btn (n = 9,239), JQ1-btn (n = 8,797) and THZ1-btn (n = 9,574) in day0, day3 and day5 of after removal of single cell with less than 1,000 raw reads. Numbers on the top of violin plot indicate the median value. Boxes in the violin plots: center marks the median; edges of boxes define the 25th and 75th percentiles. b Violin plot showing the median non-duplicated reads per cell of H3K27ac in day0 (n = 11,480), day3 (n = 9,678) and day5 (n = 6,452). Numbers on the top of violin plot indicate the median value. Boxes in the violin plots: center marks the median; edges of boxes define the 25th and 75th percentiles.
Extended Data Fig. 9
Extended Data Fig. 9. The dynamics of drug engagement and epigenomic landscape during EMT.
a Heatmaps showing dynamic genomic signals of Dox-btn and H3K27ac along the pseudotime. Left, aggregate curves showing signals of Dox-btn and H3K27ac in Day0 and Day3&5 along the pseudotime, respectively. Middle, heatmaps showing dynamic genomic signals of Dox-btn along the pseudotime. Cells were ordered by 17,908 peaks in Dox-btn with 174 columns in Day0 (untreated) and 282 columns in Day3&5 (treated, columns referring to metacells, 50 single cells each). Rows were clustered by hierarchical co-clustering and smoothed by the step size of one. The binding dynamics of the signals (peaks with less than 10 reads were removed) of JQ1-btn was presented along the EMT progression. Right, Top 3 enriched GO terms in each cluster were shown. De novo TF motifs in peaks were discovered using Homer. P value was calculated by the Binomial test. The results of Gene Ontology (GO) term enrichment analysis using a hypergeometric test, with two-sided statistical tests and adjustments for multiple comparisons employing the Benjamini-Hochberg method. b-c ChromVAR identifying TF dynamics during EMT in differential regions between Dox-btn and H3K27ac for Day3&5 CRC samples based on the signals in C1 peaks as in (a). Among the dynamic TF genes with increasing TF activity score along pseudotime (44 genes in Dox-btn, 43 genes in H3K27ac, FDR < 0.001), only 7 TFs are shared; Among the dynamic TF genes with decreasing TF activity score along pseudotime (46 genes in Dox-btn, 40 genes in H3K27ac, FDR < 0.001), only 4 TFs are shared.

References

    1. Cohen, P., Cross, D. & Jänne, P. A. Kinase drug discovery 20 years after imatinib: progress and future directions. Nat. Rev. Drug Discov.20, 551–569 (2021). 10.1038/s41573-021-00195-4 - DOI - PMC - PubMed
    1. Shaw, A. T. et al. First-line lorlatinib or crizotinib in advanced ALK-positive lung cancer. N. Engl. J. Med.383, 2018–2029 (2020). 10.1056/NEJMoa2027187 - DOI - PubMed
    1. Peters, S. et al. Alectinib versus crizotinib in untreated ALK-positive non-small-cell lung cancer. N. Engl. J. Med.377, 829–838 (2017). 10.1056/NEJMoa1704795 - DOI - PubMed
    1. Llovet, J. M. et al. Sorafenib in advanced hepatocellular carcinoma. N. Engl. J. Med.359, 378–390 (2008). 10.1056/NEJMoa0708857 - DOI - PubMed
    1. Pan, S. et al. Small-molecule probes from bench to bedside: advancing molecular analysis of drug-target interactions toward precision medicine. Chem. Soc. Rev.52, 5706–5743 (2023). 10.1039/D3CS00056G - DOI - PubMed

LinkOut - more resources