. 2024 Nov;43(21):4822-4845.
doi: 10.1038/s44318-024-00173-7. Epub 2024 Jul 18.

Ezrin, radixin, and moesin are dispensable for macrophage migration and cellular cortex mechanics

Affiliations

Ezrin, radixin, and moesin are dispensable for macrophage migration and cellular cortex mechanics

Perrine Verdys et al. EMBO J. 2024 Nov.

Abstract

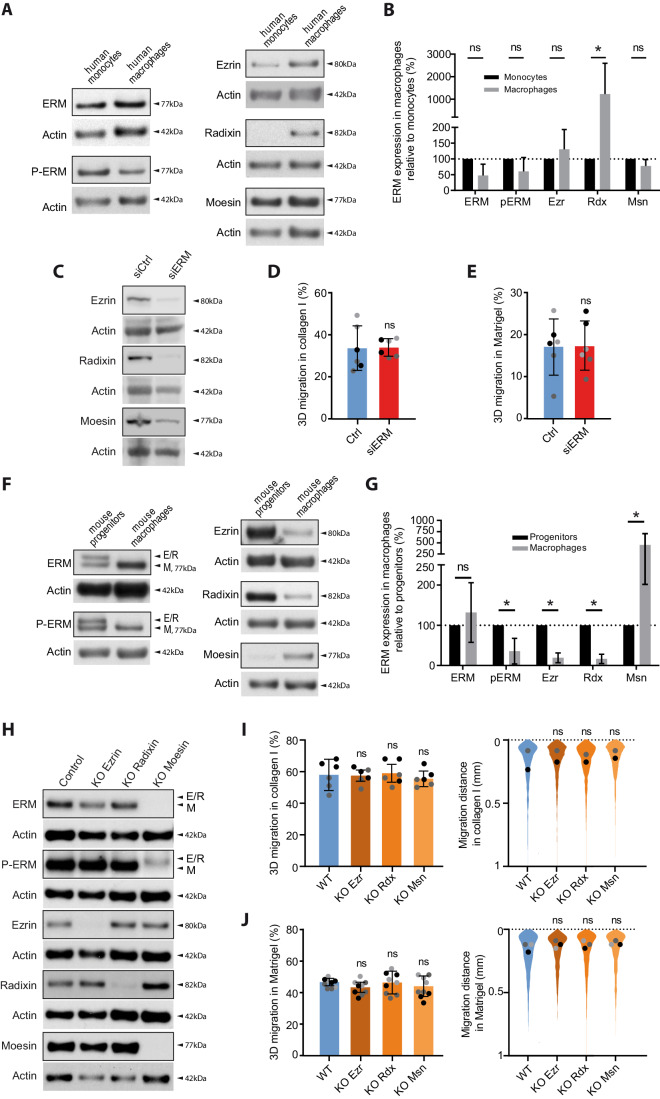
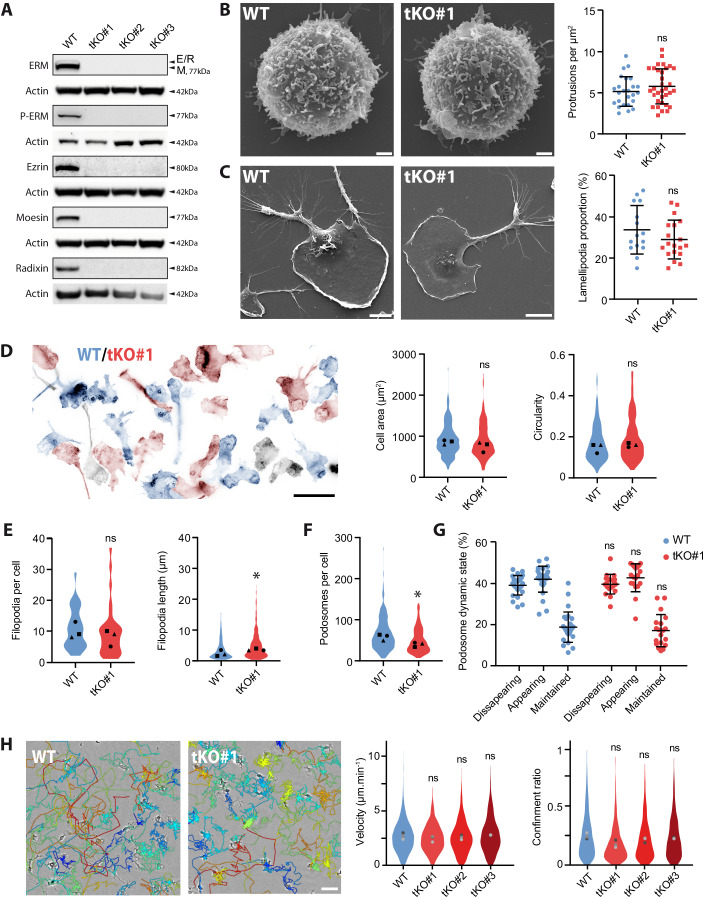
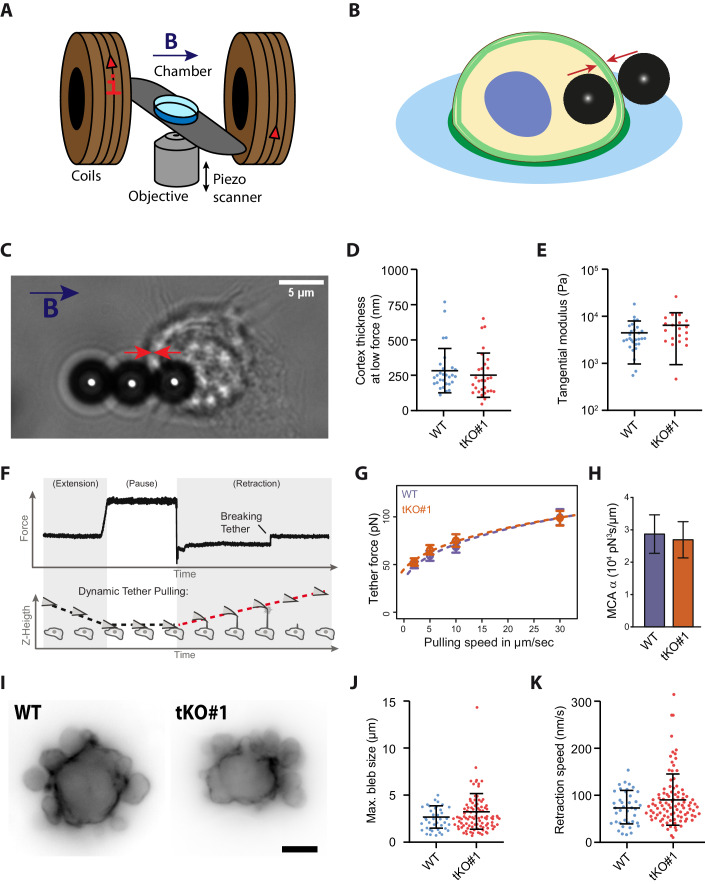
The cellular cortex provides crucial mechanical support and plays critical roles during cell division and migration. The proteins of the ERM family, comprised of ezrin, radixin, and moesin, are central to these processes by linking the plasma membrane to the actin cytoskeleton. To investigate the contributions of the ERM proteins to leukocyte migration, we generated single and triple ERM knockout macrophages. Surprisingly, we found that even in the absence of ERM proteins, macrophages still form the different actin structures promoting cell migration, such as filopodia, lamellipodia, podosomes, and ruffles. Furthermore, we discovered that, unlike every other cell type previously investigated, the single or triple knockout of ERM proteins does not affect macrophage migration in diverse contexts. Finally, we demonstrated that the loss of ERMs in macrophages does not affect the mechanical properties of their cortex. These findings challenge the notion that ERMs are universally essential for cortex mechanics and cell migration and support the notion that the macrophage cortex may have diverged from that of other cells to allow for their uniquely adaptive cortical plasticity.

Keywords: Cell Cortex; Cell Migration; Cytoskeleton; ERM; Macrophages.


Conflict of interest statement

The authors declare no competing interests.

Figures

Figure 1
Figure 1. Ezrin, radixin, or moesin depletion does not affect macrophage 3D migration.
(A, B) Endogenous expression of ERM proteins in human myeloid cells. (A) ERM, p-ERM, ezrin, radixin, and moesin expression levels of human blood-derived monocytes, and human monocyte-derived macrophages (HMDM), respectively, differentiated from the same donor. Actin levels were used to normalize the immunoblots. (B) Quantification of ERM expression in macrophages relative to monocytes was done at least on three independent donors. Mean and SD are plotted. Statistics: P values were obtained with a paired Student’s t test (ns: not significant, *P < 0.05). P value (Rdx)= 0.0357. (CE) ERM depletion in human macrophages by siRNA. (C) Ezrin, radixin, and moesin expression levels of HMDM treated with siCtrl or siRNAs against the three ERMs is representative of three independent donors. (D, E) Percentages of migration of siRNA-treated HMDM inside collagen I (D) and Matrigel (E) are represented as follows: the technical replicates (dot) of three independent experiments (highlighted by different gray colors) are represented. The mean (bar) and SD from the independent experiments are shown. Statistical analysis was done on the mean per experiment using a paired two-tailed t test. (FH) Endogenous expression and depletion of ERM in murine macrophages. (F) ERM, p-ERM, ezrin, radixin, and moesin expression levels of murine WT HoxB8 progenitors, and WT HoxB8 macrophages. (G) Quantification of expression relative to HoxB8 progenitors from at least three independent experiments. Mean and SD are plotted. Statistics: P values were obtained with a paired Student’s t test. P value (p-ERM)=0.0325; (Ezr)=0.0004; (Rdx)=0.0003; (Msn)=0.0027. (H) Immunoblots showing the expression levels of ERM, p-ERM, ezrin, radixin and moesin of HoxB8 macrophages WT or respectively knockout for ezrin (KO Ezrin), radixin (KO Radixin) or moesin (KO Moesin). (I, J) 3D migration of simple KO of ezrin-, radixin-, or moesin in macrophages: percentages of migration and migration distances of WT, KO Ezrin, KO Radixin, or KO Moesin HoxB8 macrophages inside collagen I (I) and Matrigel (J) are plotted as follows: the technical replicates (dot) of three independent experiments (highlighted by different gray colors) are represented. The mean (bar) and SD from the three independent experiments are shown. Statistical analysis was done on the mean per experiment using a RM one-way ANOVA. The distribution of the migration distance of each cell from three independent experiments is shown. Dots represent the median of each independent experiment and were used for statistical analysis using RM one-way ANOVA. Source data are available online for this figure.
Figure 2
Figure 2. ERM-tKO does not have a marked influence on the formation and dynamics of macrophage actin structures.
(A) The expression levels of ezrin, radixin, moesin, ERM, and p-ERM from WT Hoxb8 macrophages and three independent clones (tKO#1, tKO#2, tKO#3) triple ERM knockout (ERM-tKO) were analyzed by western blot. ERM and moesin are from the same immunoblots, that were stripped and rehybridized, and therefore have the same actin blot. (BG) Morphological analysis of ERM-tKO macrophages. (B) The morphology of WT and ERM-tKO#1 progenitors was analyzed by scanning electron microscopy (SEM) and the number of microvilli-like protrusions was quantified per µm2 in 25 WT and 34 ERM-tKO#1 progenitors from three independent experiments (right panel). Scale bar: 1 µm. Statistics (B, C): means and SD are plotted and P values were obtained with a Mann–Whitney U test on all cells (ns: not significant, *P < 0.05). (C) Morphology of WT and ERM-tKO#1 macrophages was analyzed by SEM and lamellipodia were evaluated as a proportion of the cell perimeter in 15 WT and 19 ERM-tKO#1 cells from two independent experiments (right panel). Means and SD are plotted. Scale bar: 10 µm. (D) Actin staining of WT (blue) and ERM-tKO#1 (red) macrophages pseudo-colored according to their identification using cell trackers. Black cells, whose cell tracer staining was too weak to be identified, were removed from the analysis (left panel). Quantification of cell area (in µm2) and circularity of 210 WT and 162 ERM-tKO#1 macrophages (right panels). Statistics (DF): the medians of three independent experiments are represented. A Mann–Whitney U test was used on all cells for statistical analysis (ns: not significant, *P < 0.05). Scale bar: 20 µm. (E) Quantification of the number of filopodia per cell in 30 WT and 30 ERM-tKO#1 macrophages (left panel), and the associated filopodia length from 320 WT and 294 ERM-tKO#1 filopodia of macrophages (right panel) from two independent experiments. Filopodia length P value = 0.0002. (F) Quantification of podosomes number of 210 WT and 162 ERM-tKO#1 HoxB8-macrophage cells. P value < 0.0001. (G) Quantification of podosome stability from lifeact-GFP-expressing WT and ERM-tKO#1 macrophages plated in 2D bare glass and imaged with RIM. See also Movie EV7. The dynamic states of podosomes were categorized into disappearing, appearing and maintained and expressed as percentages. Statistics were evaluated on 29 WT and 19 ERM-tKO#1 cells from two independent experiments using with RM one-way ANOVA. Means and SD are shown. See Appendix Fig. S2 for detailed explanations. (H) 2D Migration of WT, ERM-tKO#1, tKO#2, and tKO#3 macrophages. Snapshot pictures showing WT and ERM-TKO#1 macrophages migrating randomly in bare glass (2D) with migratory tracks representing cell trajectories during 10 h. Tracks are color-coded according to their mean speed. Scale bar: 50 µm. See also Movie EV8. Quantification of the median velocity and the confinement ratio (0: confined movement; 1: directionally persistent movement) of each migratory track from WT, ERM-tKO#1, tKO#2, and tKO#3 HoxB8 macrophages. Violin plots represent the distribution of the analyzed parameter for all the filtered migratory tracks, and the medians of three independent experiments are represented and used for statistical analysis with RM one-way ANOVA. Source data are available online for this figure.
Figure 3
Figure 3. ERMs are dispensable for macrophage infiltration through 3D matrices.
(A, B) Morphology of WT and ERM-tKO#1 Hoxb8 macrophages inside 3D collagen I (A) or 3D Matrigel (B) is shown. Scale bars: 100 µm. See also z-stacks Movies EV10 and 11, respectively, in 3D Collagen I and 3D Matrigel, as well as time-lapse Movies EV12 and 13. (C, D) Percentages of migration and migration distances of WT, ERM-tKO#1, tKO#2, and tKO#3 HoxB8 macrophages in collagen I (C) and Matrigel (D) are represented as follows: the technical replicates (dot) of three independent experiments (highlighted by different gray colors) are represented. The mean (bar) and SD from the three independent experiments are shown and used for statistical analysis using RM one-way ANOVA. The distribution of the migration distance of each cell from three independent experiments is shown. Dots represent the median of each independent experiment and were used for statistical analysis using RM one-way ANOVA. (E, F) Acquisition of a Lifeact-GFP WT macrophage in 3D collagen I (E), and time-lapse color-coded from 0 to 5 min for the dynamics (F). See also Movie EV14 to compare WT and TKO cells in collagen I. Kymograph (E”), following the pointed line in enlarged view (E’), shows the dynamics of a ruffle (arrowhead). Scale bars: 5 µm. (G) Quantification of ruffle retraction in the 3D collagen I matrix from 26 measures of WT and 34 of ERM-tKO#1 macrophages expressing lifeact-GFP and imaged with RIM. See also Movie EV14. In total, 26 ruffles from 19 WT cells and 34 ruffles from 22 TKO#1 cells from two independent experiments. Unpaired t test P = 0.288. Means and SD are shown. Source data are available online for this figure.
Figure 4
Figure 4. ERM-tKO cells have no defect in adhesion to vascular endothelium in vivo and infiltrate tissue explants ex vivo.
(A) In vivo adhesion to vascular endothelium. Fibrosarcoma cells were injected into the flank of a mice. After a week, tumor was exposed for intravital microscopy, and the femoral artery of recipient mice was catheterized for injection of exogenous cells. Differentially labeled WT and TKO-ERM macrophage precursors were injected in the blood and their behavior in tumor blood vessels was assessed by real-time imaging. Rolling fractions were quantified as the percentage of rolling cells in the total flux of cells in each blood vessel, and sticking fractions were quantified as the percentage of rolling cells that firmly adhered for a minimum of 30 s. In total, 19 and 28 blood vessels were used as replicates for WT and TKO#1 precursor cells, respectively, on four different mice. P values were assessed with a Mann–Whitney test. Means and SD are represented. (B) Ex vivo infiltration of ear derma. Differentially labeled WT and tKO#1 macrophages were seeded on top of a murine ear derma tissue over 3 days. Slices were then fixed and serial sectioning was performed along the z axis. Immunohistofluorescence of an ear section showing WT (blue) and tKO#1 (red) macrophage infiltration and dapi staining of all nuclei (black). Quantifications of the percentage and the distance of ear derma infiltration of WT or tKO#1 macrophage is represented as the mean of the respective infiltration percentage per ear halve section. Analysis was performed on seven independent ear halve explants from four mice. Scale bars: 50 μm. (C) Ex vivo infiltration of tumor explants. Differentially labeled WT and tKO#1 HoxB8-macrophage cells were seeded on top of sliced fibrosarcoma explants over 3 days. Slices were then fixed and serial sectioning was performed along the z axis. Immunohistofluorescence of a tumor section showing WT (blue) and tKO#1 (red) macrophage infiltration and dapi staining of all nuclei (black). Quantifications of the percentage and the distance of tumor infiltration of WT or tKO#1 macrophages are represented. Means of six ex vivo independent tumor explants from three tumors are shown. Representative pictures are shown. Scale bars: 50 μm. Of note, cell trackers used to stain the cells were switched between all experiments to verify the absence of effects due to staining. Source data are available online for this figure.
Figure 5
Figure 5. ERM depletion does not affect macrophage cortex thickness and stiffness.
(A, B) Scheme of the magnetic setup for the cortex pinching experiment: an inverted microscope is associated with two coaxial coils to generate a quasi-homogeneous magnetic field, B, in the sample region (A). Through the application of a magnetic field, beads align, and the cortex is pinched between a bead inside the cell and a bead outside the cell (B). (C) Bright-field image of a WT HoxB8 macrophage, with one internalized and two external magnetic beads aligned by a magnetic field. The red arrows symbolize the pressure that is exerted on the cell cortex. Scale bar: 5 µm. (D) Median of the cortical thickness of 29 WT and 29 ERM-tKO#1 macrophages from three independent experiments were measured by applying a low force (5 mT) between two magnetic beads. Statistics were done using an unpaired t test. Means and SD are shown. (E). Cortical stiffness responses are represented by the tangential elastic modulus at low stress between 150 and 350 Pa. In all, 29 WT and 20 ERM-tKO#1 macrophages from three independent experiments were analyzed. Statistics were done using an unpaired t test. Means and SD are represented. (F) Exemplary force curve from atomic force spectroscopy operated in dynamic tether pulling mode. Tethers break while the cantilever is retracted at a defined velocity with the Z-height increasing constantly. (G) Force-velocity curve from dynamic tether pulling on CTL and ERM-TKO HoxB8 macrophages. Data points are mean tether force f ± SEM at 2, 5, 10, and 30 µm/s pulling velocity. At least 16 cells per condition were analyzed in four independent experiments. (H) Mean and standard deviation of the MCA parameter Alpha obtained from Monte-Carlo-based fitting of the Brochard-Wyart model to the force-velocity data in 5 g (see “Methods” for details). No statistical difference was observed (P value (Z-test): 0.83). (I) Blebbing of Lifeact-mCherry WT and Lifeact-GFP ERM-tKO progenitor cells after incubation with 10% distilled H2O to induce hypo-osmotic stress. Scale bar: 5 µm. See also Movie EV16. (J) Quantification of the maximum bleb size per blebbing WT and ERM-tKO progenitors extracted from short-time wide-field movies. In total, 38 WT and 99 ERM-tKO#1 cells from three independent experiments were analyzed. Means and SD are shown. (K) Quantification of the retraction speed of blebs from short-time wide-field movies. Overall, 38 WT and 99 ERM-tKO#1 cells from three independent experiments were analyzed. Means and SD are shown. Source data are available online for this figure.
Figure EV1
Figure EV1. Localization of Ezrin, Radixin and Moesin proteins in human macrophages.
(AC) Representative SIM images of HMDM co-transfected with ezrin-GFP (green) (A), radixin-GFP (green) (B) or moesin-GFP (green) (C) and Lifeact-mCherry (magenta) at the basal membrane, showing podosomes (z = 0 µm) and at 3 µm above the basal membrane, showing membrane ruffles (left panels). Scale bars: 10 μm, enlarged view: 1 µm. Intensity profiles along the dotted line from both enlarged view of left panels, crossing podosomes (z = 0 µm) and membrane ruffles (z = 3 µm) (right panels). Also see z-stack Movies EV1, 2 and 3. The fluorescence levels were adjusted in the same way in order to compare the intensity at the base of the cells to the upper planes. Note that ERM are mainly accumulated in the upper ruffles, compared to the basal plasma membrane and that only Ezrin slightly accumulate around podosome cores. (D) Enlarged view of ruffle dynamics from SIM images of HMDM co-transfected with ezrin-GFP (left panel), radixin-GFP (middle panel) or moesin-GFP (right panel) (green) and Lifeact-mCherry (magenta). Scale bars: 1 μm. ERM-GFP (green) or actin (magenta) intensity profiles along the dotted line are plotted below. Note that peripheral ruffles are enriched in F-actin, whereas ERM are present in both peripheral and central ruffles. Also see time-lapse Movies EV4, 5 and 6.
Figure EV2
Figure EV2. Moesin siRNA and KO does not affect macrophage 3D migration.
(AC) Depletion of Moesin in human macrophages by siRNA. (A) Moesin expression level of HMDM treated with siCtrl or siMoesin (siMSN) is representative of 3 independent donors. (B, C) Percentages of migration of siRNA-treated HMDM inside collagen I (B) and Matrigel (C) are represented as follows: the technical replicates (dot) of 3 independent experiments (highlighted by different gray colors) are represented. The mean (bar) and SD from the 3 independent experiments are shown. Statistical analysis was done on the mean per experiment using a paired two-tailed t test. (DF) Moesin KO in mouse macrophages. (D) Moesin expression level in WT or Moesin KO mouse macrophages, differentiated in macrophage directly after KO induction to avoid compensations, is representative of 3 independent KO. (E, F) Percentages of migration inside collagen I (E) and Matrigel (F) are represented as follows: the technical replicates (dot) of 4 (collagen I) and 5 (Matrigel) independent experiments (highlighted by different gray colors) are represented. The mean (bar) and SD from the independent experiments are shown. Statistical analysis was done on the mean per experiment using a paired two-tailed t test.
Figure EV3
Figure EV3. Phagocytosis by WT and ERM-tKO macrophages.
HoxB8 macrophages were exposed to fluorescent IgG beads or OVA beads. Centrifugation was used to synchronize phagocytosis and cells were fixed at the indicated times (5 to 120 min). (A) Representative images of fluorescence microscopy of macrophages exposed to OVA beads for 60 min are shown. Beads that remained outside the cells were distinguished from ingested beads using anti-ovalbumin antibodies and TRITC-coupled secondary antibodies. Beads inside cells are magenta, beads outside cells are green, F-actin is shown in white and nuclei in blue. 3 × 3 tile images were stitched together with Zen software. Scale bars: 50 µm or 10 µm for zooms. (BE) The percentages of phagocyting cells (B, D) and percentages of fully internalized beads (C, E) were quantified for both IgG beads and OVA beads. Results are expressed as mean +/− SD of at least 2600 cells/time point from 4 independent experiments and analyzed with two-way ANOVA followed by Boneferroni’s comparison test, which revealed no significant differences. Source data are available online for this figure.
Figure EV4
Figure EV4. 2D chemotaxis of WT and ERM-tKO#1 macrophages toward a C5a gradient.
(A) Schematic representation of 2D chemotaxis assay toward C5a. WT and ERM-tKO#1 cells migrating along a C5a gradient in the x axis. See also Movie EV9. (B) Snapshot of WT and ERM-tKO#1 macrophages migrating toward C5a gradient (on the right) with migratory tracks representing cell trajectories during 90 min. Tracks are color-coded according to their directionality. Scale bar: 50 µm. (C) Migratory tracks of WT and ERM-tKO#1 macrophages with origins set at (0,0). (D) Quantification of the median velocity, the directionality, and the forward migration index in the x axis (FMIx, used as a chemotaxis indicator) of each migratory track. The medians of 3 independent experiments are represented (gray points) and used for statistical analysis with a paired t test. Means and SD are shown.
Figure EV5
Figure EV5. ERM inhibit the 3D mesenchymal migration of dendritic-like cells.
(AC) ERM-tKO affects the 3D migration through Matrigel of dendritic-like cells. (A) Differentiation of HoxB8 progenitors in dendritic-like cells. FACS analyses shows that HoxB8 progenitors differentiated with 40 ng/mL GM-CSF are Ly6C -, CD11b +, CD11c high, and F4/80 - dendritic-like cells (green), compared to M-CSF, which differentiates the same progenitors into Ly6C -, CD11b +, CD11c low and F4/80 + macrophages (red). (B, C) Percentages of migration of siRNA-treated HMDM inside collagen I (B) and Matrigel (C) are represented as follows: the technical replicates (dot) of 5 independent experiments (highlighted by different gray colors) are represented. The mean (bar) and SD from the 5 independent experiments are shown. Statistical analysis was done on the mean per experiment using a paired two-tailed t test. *P < 0,05. (D, E) ERM-tKO does not affect the 3D migration of pre-osteoclasts. Percentages of migration inside collagen I (D) and Matrigel (E) are represented as follows: the technical replicates (dot) of 4 independent experiments (highlighted by different gray colors) are represented. The mean (bar) and SD from the independent experiments are shown. Statistical analysis was done on the mean per experiment using a paired two-tailed t test.

References

    1. Accarias S, Sanchez T, Labrousse A, Ben-Neji M, Boyance A, Poincloux R, Maridonneau-Parini I, Le Cabec V (2020) Genetic engineering of hoxb8 immortalized hematopoietic progenitors: a potent tool to study macrophage tissue migration. J Cell Sci 133:jcs236703 - PubMed
    1. Akisawa N, Nishimori I, Iwamura T, Onishi S, Hollingsworth MA (1999) High levels of ezrin expressed by human pancreatic adenocarcinoma cell lines with high metastatic potential. Biochem Biophys Res Commun 258:395–400 - PubMed
    1. Arpin M, Chirivino D, Naba A, Zwaenepoel I (2011) Emerging role for ERM proteins in cell adhesion and migration. Cell Adhes Migr 5:199–206 - PMC - PubMed
    1. Barger SR, Reilly NS, Shutova MS, Li Q, Maiuri P, Heddleston JM, Mooseker MS, Flavell RA, Svitkina T, Oakes PW et al (2019) Membrane-cytoskeletal crosstalk mediated by myosin-I regulates adhesion turnover during phagocytosis. Nat Commun 10:1249 - PMC - PubMed
    1. Barik GK, Sahay O, Paul D, Santra MK (2022) Ezrin gone rogue in cancer progression and metastasis: An enticing therapeutic target. Biochim Biophys Acta Rev Cancer 1877:188753 - PubMed

LinkOut - more resources