. 2024 Aug;25(8):3240-3262.
doi: 10.1038/s44319-024-00209-3. Epub 2024 Jul 18.

The actin binding protein profilin 1 localizes inside mitochondria and is critical for their function

Affiliations

The actin binding protein profilin 1 localizes inside mitochondria and is critical for their function

Tracy-Ann Read et al. EMBO Rep. 2024 Aug.

Abstract

The monomer-binding protein profilin 1 (PFN1) plays a crucial role in actin polymerization. However, mutations in PFN1 are also linked to hereditary amyotrophic lateral sclerosis, resulting in a broad range of cellular pathologies which cannot be explained by its primary function as a cytosolic actin assembly factor. This implies that there are important, undiscovered roles for PFN1 in cellular physiology. Here we screened knockout cells for novel phenotypes associated with PFN1 loss of function and discovered that mitophagy was significantly upregulated. Indeed, despite successful autophagosome formation, fusion with the lysosome, and activation of additional mitochondrial quality control pathways, PFN1 knockout cells accumulate depolarized, dysmorphic mitochondria with altered metabolic properties. Surprisingly, we also discovered that PFN1 is present inside mitochondria and provide evidence that mitochondrial defects associated with PFN1 loss are not caused by reduced actin polymerization in the cytosol. These findings suggest a previously unrecognized role for PFN1 in maintaining mitochondrial integrity and highlight new pathogenic mechanisms that can result from PFN1 dysregulation.

Keywords: Actin; Mitochondria; Mitochondrial-derived Vesicles; Mitophagy; Profilin.


Conflict of interest statement

The authors declare no competing interests.

Figures
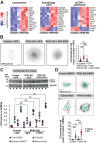
Figure 1
Figure 1. Loss of PFN1 causes an upregulation of autophagy.
(A) Heat maps of RNA-seq analysis performed on control and PFN1 KO cells, showing differential expression of genes involved in autophagy, endosome/lysosome and mTOR signaling pathways. Log2 fold change scores are colored according to the key on left. (B) Representative images of mRuby2-LC3 in control and PFN1 KO cells expressing either GFP or GFP-PFN1 (left) and quantification of LC3 puncta (right). Each data point on the graph represents the number of LC3 puncta counted in one cell (n = 56 cells for Control + GFP, n = 51 cells for PFN1 KO + GFP, and n = 54 cells for PFN1 KO + GFP-PFN1). Data is shown as median ± 95% CI. Significance was calculated against Control + GFP using ANOVA and Dunnett’s post hoc test. Scale bar = 10 μm. (C) Western blot of LC3 and GAPDH in control and PFN1 KO cells expressing either GFP or GFP-PFN1 (top). Cells were given normal media (fed) or were nutrient-deprived (starved) for 6 h and were treated with Bafilomycin A1 (Baf) to inhibit lysosome-mediated degradation or DMSO vehicle control for 4 h. Quantification of autophagic flux where LC3II levels were normalized against GAPDH (bottom). Data is shown as mean ± SEM and each data point is one biological replicate (n = 3). Significance was calculated using ANOVA and Tukey’s post hoc test. (D) Representative images of mRuby2-LC3 and DAPI in control and PFN1 KO cells treated with Bafilomycin A1 (Baf) or DMSO vehicle control for 4 h (top) and quantification of LC3 puncta (bottom). Each data point on the graph represents the number of LC3 puncta counted in one cell (n = 64 cells for Control + DMSO, n = 50 cells for Control + Baf, n = 39 cells for PFN1 KO + DMSO, and n = 48 cells for PFN1 KO + Baf). Data is shown as median ± 95% CI. Significance was calculated using a Kruskal–Wallis test followed by Dunn’s multiple comparisons test. Scale bar = 10 μm. Data information: ****p < 0.0001, **p < 0.01, ns p > 0.05. Source data are available online for this figure.
Figure 2
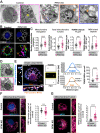
Figure 2. Autophagy induced by the loss of PFN1 selectively targets mitochondria.
(A) Heat map of RNA-seq analysis performed on control and PFN1 KO cells, showing differential expression of genes involved in mitophagy. Log2 fold change scores are colored according to the key on left. (B) Representative transmission electron micrographs of control and PFN1 KO cells. Control cells show normal mitochondria (green stars) while PFN1 KO cells have multiple double membrane bound autophagic vesicles (red arrows) containing mitochondria (red stars), scale bar = 1 μm. (C) Representative images of control and PFN1 KO cells expressing mCherry-Parkin that were also stained for TOM20, F-actin, and DAPI (left). White dashed boxes indicate the region used for the enlarged single channels images. Quantification of Parkin puncta (right). Each data point represents the total area of Parkin puncta measured in one cell (n = 40 for both Control and PFN1 KO cells). Data is shown as median ± 95% CI. Significance was calculated using a Mann–Whitney test. Scale bar = 10 μm. (D) Representative images of Control and PFN1 KO cells expressing mCherry-Parkin and GFP-p62 treated with 20 μM of the mitochondrial uncoupling agent FCCP (top) or an equivalent amount of DMSO vehicle control (bottom) for 20 min. Scale bar = 10 μm. (E) Representative images of Control and PFN1 KO cells expressing the mitophagy reporter Cox8-GFP-mCherry 48 h post electroporation (left). When Cox8-GFP-mCherry enters an acidified environment, the GFP fluorescence is quenched whilst the mCherry fluorescence remains intact. The lookup tables used for GFP and mCherry are white when overlapped. Quantification of Cox8 puncta at 24 and 48 h post electroporation that only had mCherry fluorescence (right). Each data point on the graph represents the number of Cox8-GFP(-)-mCherry(+) puncta that were counted in one cell (n = 60 for all conditions). Data are shown as median ± 95% CI. Significance was calculated using a Kruskal–Wallis test followed by Dunn’s multiple comparisons test. Scale bar = 10 μm. (F) Representative images of Control cells expressing Cox8-mCherry-GFP treated with 20 nM Latrunculin A (Lat A) overnight or DMSO vehicle control (left). This low dose Lat A reduces F-actin to 30–40% without altering cell morphology or causing cell death. Lookup tables used for GFP and mCherry are white when overlapped. Quantification of Cox8 puncta that only had mCherry fluorescence (right). Each data point on the graph represents the number of Cox8-GFP(-)-mCherry(+) puncta were counted in one cell (n = 80 for DMSO, n = 81 for 10 nM Lat A, and n = 86 for 20 nM Lat A). Data shown as median ± 95% CI. Significance was calculated using a Kruskal–Wallis test followed by Dunn’s multiple comparisons test. Scale bar = 10 μm. Data information: ****p < 0.0001, ns p > 0.05. Source data are available online for this figure.
Figure 3
Figure 3. Loss of PFN1 disrupts mitochondrial metabolism.
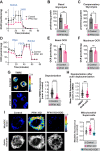
(AF) Seahorse Extracellular Flux Analyzer measurements of glycolysis (AC) and oxidative phosphorylation (DF). Glycolysis is measured using the extracellular acidification rate (ECAR) with the Seahorse XF Glycolysis Stress Test and oxidative phosphorylation is measured using the oxygen consumption rate (OCR) with the Seahorse XF Mito Stress Test. (A) Time course of Control and PFN1 KO cells in the Seahorse XF Glycolysis Stress Test. The data is displayed as mean ± SEM and each data point is one biological replicate (n = 3). (B, C) Quantification of basal (B) and compensatory glycolysis (C) from (A). The data is displayed as mean ± SD and each data point is one biological replicate (n = 3). Significance was calculated using a Student’s t-test. (D) Time course of Control and PFN1 KO cells in the Seahorse XF Mito Stress Test. The data is displayed as mean ± SEM and each data point is one biological replicate (n = 3). (E, F) Quantification of basal (E) and maximum OCR (F) from (D). The data is displayed as mean ± SD and each data point is one biological replicate (n = 3). Significance was calculated using a Student’s t-test. (G) Representative images of Control and PFN1 KO cells stained with TMRE, a fluorogenic dye for measuring membrane potential in live cells (left). The images are pseudo colored using the lookup table on the right and scaled identically so they can be compared. Quantification of mean TMRE fluorescence (right). Each data point represents the mean TMRE fluorescence of one cell (n = 250 cells for Control and n = 231 cells for PFN1 KO). Significance was calculated using a Mann–Whitney test. Scale bar = 10 μm. (H) Quantification of mean TMRE fluorescence in Control cells treated overnight with 10 nM Latrunculin A (LatA) or DMSO vehicle control. Each data point represents the mean TMRE fluorescence of one cell (n = 178 cells for DMSO and n = 197 cells for 10 nM Lat A). Significance was calculated using a Mann–Whitney test. (I) Representative images of Control and PFN1 KO cells expressing 4xmts-mScarlet to label mitochondria and stained with the MitoSOX Green superoxide probe (left). Superoxide dismutase (SOD) was also added to PFN1 KO cells to remove superoxide at the mitochondrial membrane. The images are pseudo colored using the lookup table on the right and scaled identically so they can be compared. Quantification of mean MitoSOX Green fluorescence (right). Each data point represents the mean TMRE fluorescence of one cell (n = 66 cells for Control, n = 70 for PFN1 KO, and n = 67 cells for PFN1 KO + SOD). Significance was calculated using ANOVA and Tukey’s post hoc test. Scale bar = 5 μm. Data information: ****p < 0.0001, ***p < 0.001, **p < 0.01, *p < 0.05, ns p > 0.05. Source data are available online for this figure.
Figure 4
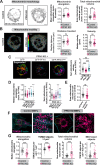
Figure 4. Loss of PFN1 disrupts mitochondrial morphology.
(A) Representative transmission electron micrographs of Control and PFN1 KO cells. Control cells have normally shaped mitochondria (yellow stars) whereas PFN1 KO cells have elongated, dysmorphic mitochondria (orange stars). Scale bar = 2 μm. (B) Representative images of TOM20 labeled mitochondria and DAPI in Control and PFN1 KO cells (top) and the results of TOM20 segmentation (bottom). Segmented TOM20 objects were assigned a random color. Note, these images are maximum intensity projections from confocal z-stacks made for presentation. TOM20 segmentation was performed in 3D from the z-stack. Scale bar = 10 μm. (C) Quantification of median mitochondria elongation, total mitochondria volume, the number of TOM20 objects >1 μm3 per cell, and the number of mitochondria-derived vesicle (MDV) sized objects (TOM20 objects <0.03 μm3) per cell from (C). Mitochondria elongation is measured by the length of the longest axis of a 3D object divided by the average of the two smaller axes. Each data point represents one cell, in the case of mitochondria elongation, a data point represents the median elongation value of all mitochondria measured from one cell (n = 59 cells for control and n = 60 for PFN1 KO). Data is shown as median ± 95% CI. Significance was calculated using a Student’s t-test except for MDV sized objects, which used a Mann–Whitney test. (D) Representative transmission electron micrographs of a PFN1 KO cell with MDVs budding from mitochondria (green stars). These images are from the same cell shown in (A). (E) Representative image of a PFN1 KO cell stained for TOM20 and PDH (left). The white arrows on the enlarged insets point to MDV-sized puncta containing only TOM20 or PDH. Quantification of the size of a TOM20 and PDH labeled puncta from the yellow bordered inset (middle), where single channel fluorescence images show that each puncta is only positive of one of the two mitochondrial proteins. Full width at half maximum (FWHM) measurements of fluorescence intensity linescans made through the puncta indicate that each is approximately 0.15 μm in circumference. Quantification of the amount of TOM20 labeled MDVs in Control and PFN1 KO cells (right). Each data point on the graph represents the number of TOM20 positive MDVs that were counted in one cell (n = 30 for Control and n = 18 for PFN1 KO). Data is shown as median ± 95% CI. Significance was calculated using a Mann–Whitney test. Scale bar = 10 μm. (F) Representative images of Control and PFN1 KO cells stained for TOM20 and the fission protein DRP1 (left). Quantification of DRP1 puncta per μm2 of TOM20 labeled mitochondria normalized to Control (right). Each data point represents the number of DRP1 puncta per μm2 of mitochondria counted in one cell (n = 60 for Control and n = 58 for PFN1 KO). Data is shown as median ± 95% CI. Significance was calculated using a Mann–Whitney test. Scale bar = 10 μm. (G) Representative images of Control and PFN1 KO cells stained for TOM20 and the fusion protein MFN2 (left). Quantification of MFN2 puncta per μm2 of TOM20 labeled mitochondria normalized to Control. Each data point represents the number of MFN2 puncta per μm2 of mitochondria counted in one cell (n = 61 for Control and n = 60 for PFN1 KO). Data is shown as median ± 95% CI. Significance was calculated using a Mann–Whitney test. Scale bar = 10 μm. Data information: ****p < 0.0001, ***p < 0.001, *p < 0.05, ns p > 0.05. Source data are available online for this figure.
Figure 5
Figure 5. PFN1 is inside of mitochondria.
(A) An image showing TOM20, GFP-PFN1, and DAPI in a PFN1 KO cell that was subjected to an immunocytochemistry protocol that had increased detergent extraction after fixation to remove cytosolic GFP-PFN1. Scale bar = 10 μm. (B) An image showing TOM20, the ALS mutant GFP-PFN1M114T, and DAPI in a PFN1 KO cell. The inset shows a mitochondrion where the GFP-PFN1M114T has aggregated inside of the TOM20 labeled membrane. Scale bar = 10 μm. (C) (Top) Schematic protocol of experimental design to determine mitochondrial localization of PFN1. Mitochondria were isolated from Control CAD cells and then either treated with Proteinase K (PK) to digest all the proteins outside of the outer mitochondrial membrane (OMM) (I), treated with the detergent Triton X-100 (TX-100) and then Proteinase K to digest all of the proteins inside the OMM (II), or treated with the detergent Digitonin to remove the OMM and make mitoplasts (MP) and then PK to digest the proteins outside of the inner mitochondrial membrane (IMM) (III). PFN1 was assessed along with the cytoplasmic protein GAPDH, the OMM protein TOM20, the intermembrane space protein Cytochrome C, the IMM protein COXIV, and the matrix protein Citrate synthase. (Bottom left) Western blot of TOM20, COXIV, and PFN1 from experiments I and II to determine if PFN1 is located inside the OMM. PFN1 is protected from Proteinase K unless mitochondria are pre-treated with Triton X-100, like the IMM protein COXIV but not the OMM protein TOM20. Also shown is the cytoplasmic fraction (Cyto) with and without Proteinase K treatment, demonstrating that the amount of Proteinase K used in these experiments is enough to digest all the PFN1 from the cytoplasmic fraction. (Bottom right) Western Blot of GAPDH, Cytochrome C, Citrate Synthase, and PFN1 from experiment III to determine if PFN1 is located in the mitochondrial matrix. PFN1 is protected in mitoplasts treated Proteinase K, like the matrix protein Citrate synthase but not the intermembrane space protein Cytochrome C. (D) A maximum intensity projection image of a PFN1 KO cell expressing 4Xmts-mScarlet to label the IMM and GFP-PFN1 from a 4X expansion microscopy experiment (left). The zoomed insets (right) show different focal planes from the confocal z-stack where GFP-PFN1 was found inside of the IMM. Scale bar = 10 μm. Source data are available online for this figure.
Figure EV1
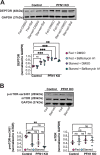
Figure EV1. Loss of PFN1 causes an upregulation of autophagy.
Related to Fig. 1. (A) Western blot of DEPTOR and GAPDH in Control and PFN1 KO cells (top). Cells were given normal media (fed) or were nutrient-deprived (starved) for 6 h and were treated with Bafilomycin A (Baf) to inhibit lysosome-mediated degradation or DMSO vehicle control for 4 h. Quantification of DEPTOR normalized against GAPDH (bottom). Data is shown as mean ± SEM and each data point is one biological replicate (n = 3). Significance was calculated using ANOVA and Tukey’s post hoc test. (B) Western blot of mTOR, phospho-S2481-mTOR (p-mTOR-ser2481), and GAPDH in control and PFN1 KO cells (top). Cells were given normal media (fed) or were nutrient-deprived (starved) for 6 h. Quantification of phospho-S2481-mTOR (p-mTOR) (bottom left) and mTOR (bottom right) normalized against GAPDH. Data is shown as mean ± SEM and each data point is one biological replicate (n = 3). Significance was calculated using ANOVA and Tukey’s post hoc test. Data information: ***p < 0.001, **p < 0.01, *p < 0.05, ns p > 0.05. Source data are available online for this figure
Figure EV2
Figure EV2. Loss of PFN1 disrupts mitochondrial morphology.
Related to Fig. 4. (A) Representative maximum intensity projections of Control and PFN1 KO cells expressing 4xmts-mNeonGreen (left). Quantification (right) of median mitochondria elongation and sum mitochondria volume in Control and PFN1 KO cells from live cell imaging experiments depicted in (A). Each data point represents one cell, in the case of mitochondria elongation, a data point represents the median elongation value of all mitochondria measured from one cell. (n = 45 cells for Control and PFN1 KO). Data is shown as median ± 95% CI. Significance was calculated using a Student’s t test. and time projections from the entire movie (bottom). (B) Time projections from live cell imaging of Control and PFN1 KO cells expressing 4xmts-mNeonGreen, color-coded according to the scale inserted in the right image (left). Quantification of median average velocity and median distance traveled of mitochondria (right). Each data point represents the median of all measurements made in one cell. (n = 45 cells for Control and PFN1 KO). Significance was calculated using a Student’s t test. Scale bar = 10 μm. (C) Representative images of the segmented TOM20 labeled mitochondria in PFN1 KO cells expressing GFP, GFP-PFN1 or the non-actin binding mutant GFP-PFN1R88E (left). Quantification of sum mitochondria volume. Each data point represents the sum mitochondria volume from one cell (n = 100 cells for GFP, n = 97 for GFP-PFN1, and n = 56 for GFP-PFN1R88E). Data is shown as median ± 95% CI. Significance was calculated using a Kruskal–Wallis test followed by Dunn’s multiple comparisons test. Scale bar = 10 μm. (D) Quantification of sum mitochondria and median mitochondria elongation in PFN1 KO cells expressing either GFP, GFP-PFN1, or the ALS-linked mutations GFP-PFN1M114T, GFP-PFN1E117G and GFP-PFN1G118V. Mitochondria elongation is measured by the length of the longest axis of a 3D object divided by the average of the two smaller axes. Each data point represents one cell, in the case of mitochondria elongation, a data point represents the median elongation value of all mitochondria measured from one cell. (n = 100 cells for GFP, n = 97 for GFP-PFN1, n = 77 for GFP-PFN1M114T, n = 52 for GFP-PFN1E117G, n = 59 for GFP-PFN1G118V). Data is shown as median ± 95% CI. Significance was calculated using a Kruskal–Wallis test followed by Dunn’s multiple comparisons test. (E) Quantification of sum mitochondria volume of control cells expressing either mCherry or mCherry-Parkin for 48 h. Each data point represents the sum mitochondria volume from one cell (n = 75 for Control and n = 103 for PFN1 KO). Data is shown as median ± 95% CI. Significance was calculated using a Mann–Whitney test. (F) Representative images of TOM20 labeled mitochondria and F-actin in Control and PFN1 KO cells mouse embryonic fibroblasts (MEFs) (top). Scale bar = 10 μm. (G) Quantification of median mitochondria elongation, total mitochondria volume, the number of TOM20 objects >1 μm3 per cell, and the number of mitochondria-derived vesicle (MDV) sized objects (TOM20 objects <0.03 μm3) per cell from (E). Mitochondria elongation is measured by the length of the longest axis of a 3D object divided by the average of the two smaller axes. Each data point represents one cell, in the case of mitochondria elongation, a data point represents the median elongation value of all mitochondria measured from one cell. (n = 51 cells for Control and PFN1 KO). Data is shown as median ± 95% CI. Significance was calculated using a Mann–Whitney test, except for MDV sized objects which used a Student’s t-test. Data information: ****p < 0.0001, ***p < 0.001, **p < 0.01, *p < 0.05, ns p > 0.05. Source data are available online for this figure
Figure EV3
Figure EV3. PFN1 is present inside mitochondria.
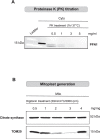
Related to Fig. 5. (A) Western blot showing titration of Proteinase K applied to the cytoplasmic fraction (Cyto) of CAD cells to identify the optimal concentration at which all cytoplasmic PFN1 is successfully digested. (B) Western Blot showing TOM20 (OMM protein) and Citrate synthase (matrix protein) levels from mitochondria treated with increasing amounts of Digitonin to dissolve the OMM to generate mitoplasts. Source data are available online for this figure.

Update of

References

    1. Abd Elghani F, Safory H, Hamza H, Savyon M, Farhoud M, Toren-Hershoviz M, Vitic Z, Ebanks K, Shani V, Bisharat S et al (2022) SIAH proteins regulate the degradation and intra-mitochondrial aggregation of PINK1: implications for mitochondrial pathology in Parkinson’s disease. Aging Cell 21:e13731 10.1111/acel.13731 - DOI - PMC - PubMed
    1. Adebayo M, Singh S, Singh AP, Dasgupta S (2021) Mitochondrial fusion and fission: the fine-tune balance for cellular homeostasis. FASEB J 35:e21620 10.1096/fj.202100067R - DOI - PMC - PubMed
    1. Aguilera MO, Beron W, Colombo MI (2012) The actin cytoskeleton participates in the early events of autophagosome formation upon starvation induced autophagy. Autophagy 8:1590–1603 10.4161/auto.21459 - DOI - PMC - PubMed
    1. Annis MG, Zamzami N, Zhu W, Penn LZ, Kroemer G, Leber B, Andrews DW (2001) Endoplasmic reticulum localized Bcl-2 prevents apoptosis when redistribution of cytochrome c is a late event. Oncogene 20:1939–1952 10.1038/sj.onc.1204288 - DOI - PubMed
    1. Aplin A, Jasionowski T, Tuttle DL, Lenk SE, Dunn Jr WA (1992) Cytoskeletal elements are required for the formation and maturation of autophagic vacuoles. J Cell Physiol 152:458–466 10.1002/jcp.1041520304 - DOI - PubMed

LinkOut - more resources