. 2024 Jul 18;8(1):148.
doi: 10.1038/s41698-024-00640-8.

Spatial tumor immune microenvironment phenotypes in ovarian cancer

Affiliations

Spatial tumor immune microenvironment phenotypes in ovarian cancer

Claudia Mateiou et al. NPJ Precis Oncol. .

Abstract

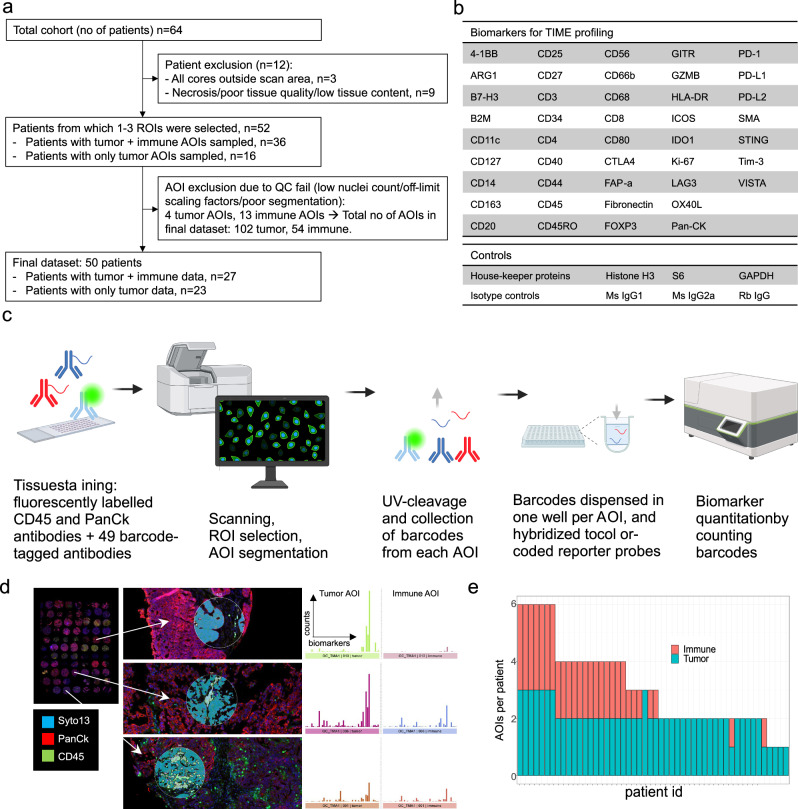
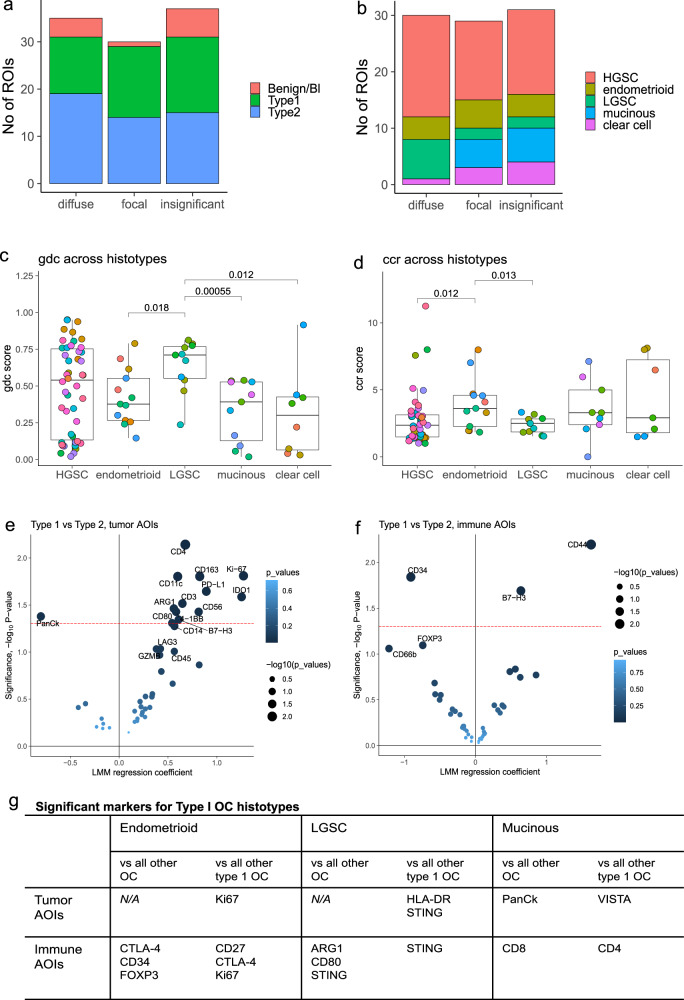
Immunotherapy has largely failed in ovarian carcinoma (OC), likely due to that the vast tumor heterogeneity and variation in immune response have hampered clinical trial outcomes. Tumor-immune microenvironment (TIME) profiling may aid in stratification of OC tumors for guiding treatment selection. Here, we used Digital Spatial Profiling combined with image analysis to characterize regions of spatially distinct TIME phenotypes in OC to assess whether immune infiltration pattern can predict presence of immuno-oncology targets. Tumors with diffuse immune infiltration and increased tumor-immune spatial interactions had higher presence of IDO1, PD-L1, PD-1 and Tim-3, while focal immune niches had more CD163 macrophages and a preliminary worse outcome. Immune exclusion was associated with presence of Tregs and Fibronectin. High-grade serous OC showed an overall stronger immune response and presence of multiple targetable checkpoints. Low-grade serous OC was associated with diffuse infiltration and a high expression of STING, while endometrioid OC had higher presence of CTLA-4. Mucinous and clear cell OC were dominated by focal immune clusters and immune-excluded regions, with mucinous tumors displaying T-cell rich immune niches.


Conflict of interest statement

The authors declare no competing interests.

Figures

Fig. 1
Fig. 1. Experimental overview.
a Sample inclusion. From a total of 64 patients, 12 were excluded due technical or quality reasons. Of 52 tumors deemed evaluable, 36 were estimated to have sufficient immune infiltration (> 20 CD45+ cells per ROI (Region of Interest)) for ROI segmentation into tumor (PanCk+ Syto13 + CD45-) and immune (CD45+ Syto13+ PanCk-) AOIs (Areas of Illumination). Following DSP (Digital Spatial Profiling) quantification of antibody-bound probes, 17 AOIs failed QC (quality control) process based low nuclei count, control normalization factor > 3 (indicating low probe binding), or poor segmentation. The final dataset consisted of 156 AOIs from 50 patients, with matched tumor and immune AOIs from 27 patients, and tumor only AOIs from 23 patients. b Specificities of antibodies used for tumor immune microenvironment (TIME) profiling. c Experimental workflow. The DSP technology includes staining FFPE (formalin-fixed paraffin-embedded) samples with panels of fluorescently labelled and barcoded antibodies. Immunofluorescence visualization through scanning is used to guide selection of ROIs. Upon exposure of UV light, barcodes are cleaved off, aspirated and dispensed in a microwell plate. Collected barcodes are hybridized to color-coded probes which are quantified in the nCounter instrument. d ROIs representing insignificant, focal and diffuse immune infiltration were selected from two TMA slides with 3x1mm cores per tumor (red=PanCk, green=CD45, blue=Syto13). Each ROI was segmented into AOIs of tumor (PanCk + , CD45-, Syto13 + , teal masks) and, when possible (> 20 immune cells per ROI), immune (CD45 + , PanCk-, Syto13 + , lime masks), for separate quantitation of biomarkers. Graphs show raw counts of biomarkers for tumor and immune AOIs, for the respective ROIs. e Data was collected from 50 patients, of which 27 had sufficient immune content per ROI for sampling of both immune and tumor AOIs. The number of AOIs collected per patient varied from 1-6.
Fig. 2
Fig. 2. Spatial patterns of immune infiltration.
a Six representative ROIs are shown for each of the spatial phenotypes; diffuse, focal and insignificant immune infiltration, three from each of the two TMA slides. Boundary of circular 300 µm diameter ROIs are shown on top, with segmented tumor/immune or tumor only AOIs below (red=PanCK, green = CD45, blue = Syto13). The segmentation masks are colored in teal (tumor) and lime (immune) for TMA1, and in pink (tumor) and lime (immune) for TMA2. b Tumor and immune protein signatures in spatial phenotypes of immune-insignificant and infiltrated tumors. Tumor segments in regions of insignificant immune infiltration had higher levels of CD25 and Fibronectin, while infiltrated tumor regions had higher CD45, PD-L1, HLA-DR, CD44, IDO1 and CD11c. c Immune segments from regions with low immune cell ratio were higher in CTLA-4, FOXP3 and PD-L2, while regions with high immune cell ratio were higher in CD3, beta-2-microglobulin (B2M), CD4, CD45, CD45RO, CD8, CD44, and STING. d Regions with diffuse immune infiltration had tumor segments that were higher in IDO1, PD-L1, B2M, CD45, and Tim-3, compared to regions with focal immune infiltration. e Immune segments of diffuse infiltration patterns were higher in IDO1, granzyme B (GZMB) and CD3, while focal immune segments were higher in CD163. Differential expression was assessed through linear mixed models (LMM) with Patient ID as random effect, including only malignant tumors. Significance (-log10 p-value) was plotted against LMM regression coefficient. Red dotted line marks p = 0.05.
Fig. 3
Fig. 3. Combined image analysis and digital biomarker profiling exemplified for diffuse and focal immune infiltration regions in one HGSC patient.
Immune infiltration of (a) diffuse and (b) focal patterns was identified in different cores of the same tumor (patient P387). Upper panels: Boundary of ROI (left) and segmentation into immune and tumor AOIs (right) in the DSP analysist (red=PanCk, green=CD45, blue=Syto13). Bottom panels: corresponding FIJI pre-processed ROI image (left), and DL-based segmentation and cell classification in QuPath (right). Right panels (larger image): Graph networks overlayed grey scale Syto13 ROI image. Nodes are colored in pink for tumor and green for immune. Connections within a 30-pixel (=12 µm) distance from centre of each node are displayed and were used to calculate spatial statistics. Scale bars represent 20 µm. c Normalized counts of selected biomarkers quantified in immune AOIs of diffuse and focal immune infiltration regions in tumor of P387. CD45 was similar in both AOIs. Diffuse immune infiltration was higher in CD3, CD8, CD44, and GZMB, and focal immune infiltration was higher in CD68, CD14 and CD20. d Spatial statistics derived from image analysis of the P387 tumor. Immune cell ratio was similar in diffuse and focal immune infiltration. Gdc was higher and tumor ccr lower in diffuse compared to focal infiltration. *the same y-axis scale are used for different spatial parameters; ccr scores, gdc scores and immune/(tumor+immune) ratio, respectively. ccr values have been scaled with a factor of 0.1 to enable visualization in the same plot.
Fig. 4
Fig. 4. Tumor immune phenotypes in OC subtypes.
a Diffuse, focal and insignificant immune infiltration were present in Type 1 and Type 2 malignant OC, as well as in benign and borderline samples. b Distribution of diffuse, focal and insignificant immune infiltration ROIs across histology subtypes of OC (malignant samples only). c gdc and (d) ccr across histotypes. ROIs are colored by patient IDs. Boxplots display median value (center line), first (lower hinge) and third (upper hinge) quartiles. Whiskers extend to the largest and smallest values, respectively. e, f Linear Mixed Models (LMM) with Patient ID as random effect and Type 1/2 as fixed effect to identify differences in immune infiltration between Type 1 and Type 2 OC in (e) tumor AOIs, and (f) immune AOIs. Only malignant tumors were included. Significance (-log10 p-value) were plotted against LMM regression coefficients. Red dotted line marks p = 0.05. g Biomarkers upregulated in low grade histotypes of OC as compared to all other samples and to other Type 1 histologies, respectively. Comparisons were made using LMM with Patient ID as random effect and histology as fixed effect. Biomarker significantly higher in each histotype are listed. Clear cell carcinoma is not included as no biomarkers were identified for that histotype.

References

    1. Siegel RL, Miller KD, Fuchs HE, Jemal A. Cancer Statistics, 2021. CA Cancer J. Clin. 2021;71:7–33. doi: 10.3322/caac.21654. - DOI - PubMed
    1. Kurnit KC, Fleming GF, Lengyel E. Updates and New Options in Advanced Epithelial Ovarian Cancer Treatment. Obstet. Gynecol. 2021;137:108–121. doi: 10.1097/AOG.0000000000004173. - DOI - PMC - PubMed
    1. Banerjee S, et al. Maintenance olaparib for patients with newly diagnosed advanced ovarian cancer and a BRCA mutation (SOLO1/GOG 3004): 5-year follow-up of a randomised, double-blind, placebo-controlled, phase 3 trial. Lancet Oncol. 2021;22:1721–1731. doi: 10.1016/S1470-2045(21)00531-3. - DOI - PubMed
    1. Foo T, George A, Banerjee S. PARP inhibitors in ovarian cancer: An overview of the practice-changing trials. Genes Chromosomes Cancer. 2021;60:385–397. doi: 10.1002/gcc.22935. - DOI - PubMed
    1. Jiang Y, Wang C, Zhou S. Targeting tumor microenvironment in ovarian cancer: Premise and promise. Biochim Biophys. Acta Rev. Cancer. 2020;1873:188361. doi: 10.1016/j.bbcan.2020.188361. - DOI - PubMed

LinkOut - more resources