. 2024 Jul;56(7):1667-1681.
doi: 10.1038/s12276-024-01287-y. Epub 2024 Jul 18.

Accelerated aging of skeletal muscle and the immune system in patients with chronic liver disease

Affiliations

Accelerated aging of skeletal muscle and the immune system in patients with chronic liver disease

Thomas Nicholson et al. Exp Mol Med. 2024 Jul.

Abstract

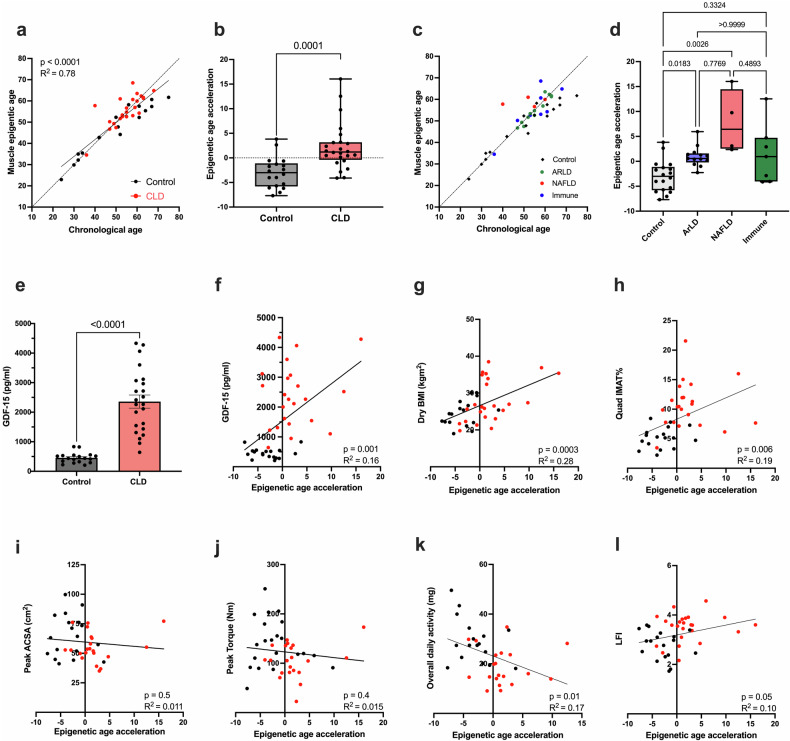
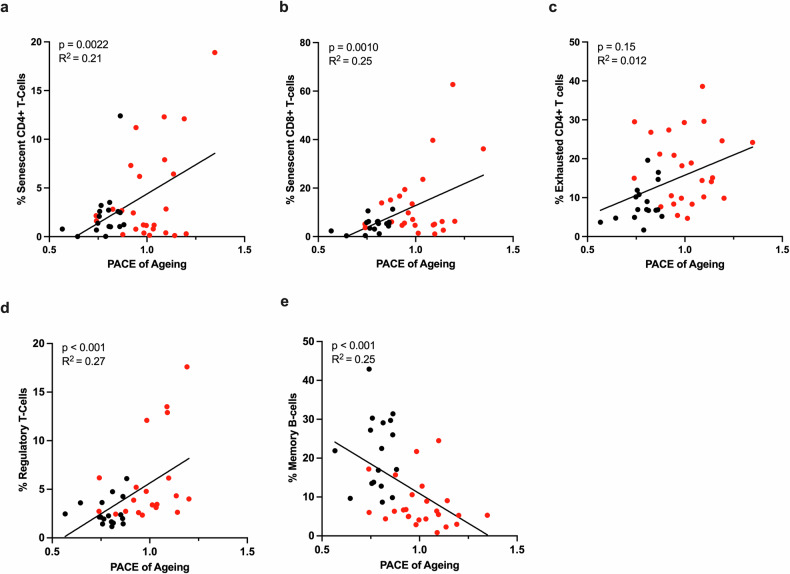
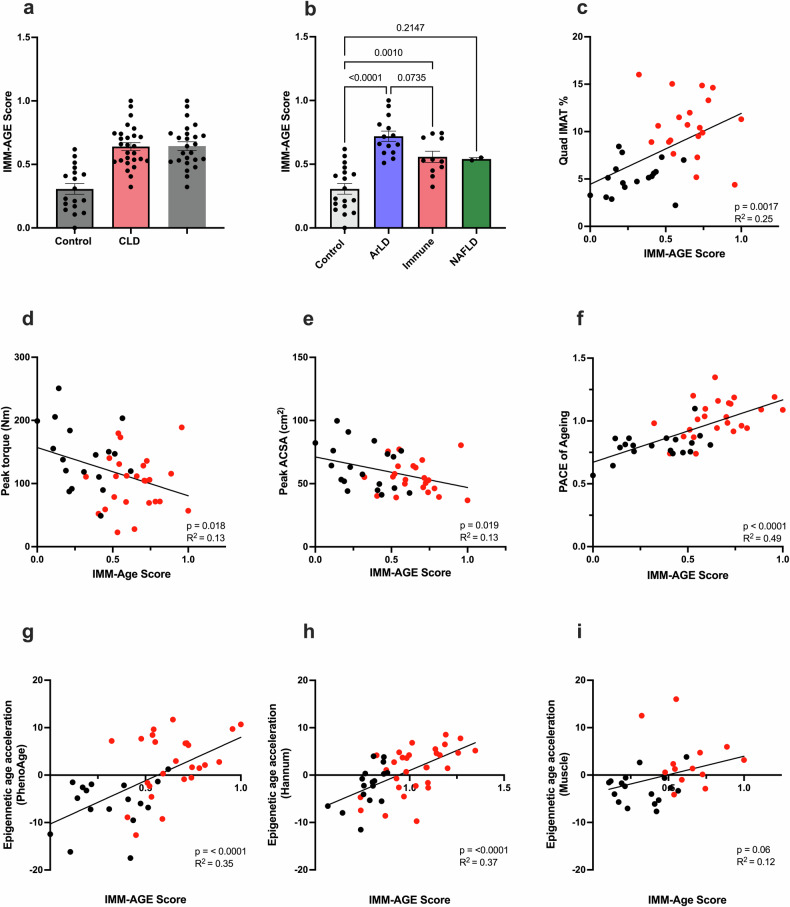
Patients with chronic liver disease (CLD) often present with significant frailty, sarcopenia, and impaired immune function. However, the mechanisms driving the development of these age-related phenotypes are not fully understood. To determine whether accelerated biological aging may play a role in CLD, epigenetic, transcriptomic, and phenotypic assessments were performed on the skeletal muscle tissue and immune cells of CLD patients and age-matched healthy controls. Accelerated biological aging of the skeletal muscle tissue of CLD patients was detected, as evidenced by an increase in epigenetic age compared with chronological age (mean +2.2 ± 4.8 years compared with healthy controls at -3.0 ± 3.2 years, p = 0.0001). Considering disease etiology, age acceleration was significantly greater in both the alcohol-related (ArLD) (p = 0.01) and nonalcoholic fatty liver disease (NAFLD) (p = 0.0026) subgroups than in the healthy control subgroup, with no age acceleration observed in the immune-mediated subgroup or healthy control subgroup (p = 0.3). The skeletal muscle transcriptome was also enriched for genes associated with cellular senescence. Similarly, blood cell epigenetic age was significantly greater than that in control individuals, as calculated using the PhenoAge (p < 0.0001), DunedinPACE (p < 0.0001), or Hannum (p = 0.01) epigenetic clocks, with no difference using the Horvath clock. Analysis of the IMM-Age score indicated a prematurely aged immune phenotype in CLD patients that was 2-fold greater than that observed in age-matched healthy controls (p < 0.0001). These findings suggested that accelerated cellular aging may contribute to a phenotype associated with advanced age in CLD patients. Therefore, therapeutic interventions to reduce biological aging in CLD patients may improve health outcomes.


Conflict of interest statement

The authors declare no competing interests.

Figures

Fig. 1
Fig. 1. Evidence of accelerated skeletal muscle aging in patients with chronic liver disease.
a Scatter plot comparing skeletal muscle epigenetic age with chronological age for patients with CLD (n = 24) and healthy control individuals (n = 18). b Skeletal muscle epigenetic age acceleration in CLD patients and healthy controls. c Scatter plot comparing skeletal muscle epigenetic age with chronological age for CLD etiology subgroups and healthy controls (ArLD, n = 13; NAFLD, n = 4; immune-mediated, n = 7). d Skeletal muscle epigenetic age acceleration for CLD etiology subgroups and healthy controls. e Serum concentration of GDF-15 in matched muscle biopsy samples from CLD patients (n = 24) and healthy controls (n = 18). f Scatter plot displaying the association between serum GDF-15 concentrations and skeletal muscle epigenetic age acceleration in CLD patients and healthy controls. gl Scatter plots showing the associations of muscle epigenetic age with BMI, quadricep intramuscular adipose tissue, quad peak ACSA, peak isokinetic knee extensor torque, overall daily activity, and liver frailty index for CLD patients and healthy controls. The black symbols denote healthy controls, and the red symbols denote CLD patients. Normally distributed data are presented as the mean ± SEM. Nonparametric data are presented as box and whisker plots with medians and lower and upper quartiles. IMAT intermuscular adipose tissue, ACSA anatomical cross-sectional area, ArLD alcohol-related liver disease, LFI liver frailty index, NAFLD nonalcoholic fatty liver disease.
Fig. 2
Fig. 2. Evidence of increased senescence in patients with chronic liver disease.
a SenMayo gene set enrichment analysis of the skeletal muscle tissue of CLD patients (n = 24) compared to that of healthy controls (n = 18). The data are presented as an enrichment plot (left) and a heatmap of the top 10 most enriched SenMayo genes in the CLD group (right). b Top 10 most enriched SenMayo genes in the skeletal muscle tissue of CLD patients c, d Serum concentrations of TNF-alpha and TNF-beta in CLD patients (n = 23) and healthy controls (n = 18). e Serum concentrations of KITLG (pseudonyms: stem cell factor (SCF) and mast cell growth factor (MGF)) in patients with CLD and healthy controls. fh Enrichment plots following gene set enrichment analysis of the SenMayo gene set in the skeletal muscle tissue of the ArLD (n = 13), immune-mediated (n = 7), and NAFLD (n = 4) subgroups in comparison to healthy controls. The data are presented as the mean ± SEM. ArLD alcohol-related liver disease, NAFLD nonalcoholic fatty liver disease.
Fig. 3
Fig. 3. Evidence of accelerated epigenetic aging of the immune system in patients with chronic liver disease.
a DunedinPACE scores based on the DNA methylome of PBMCs from CLD patients (n = 31) and healthy controls (n = 17). bd Epigenetic age acceleration of PBMCs calculated by the PhenoAge, Horvath, and Hannum clock scores. e, f Scatter plot showing the relationship between skeletal muscle epigenetic age acceleration and PBMC PhenoAge and Hannum epigenetic age acceleration in patient-matched samples (n = 17 CLDs and n = 17 controls). gi PBMC DunedinPACE scores, PhenoAge epigenetic age acceleration, and Hannum epigenetic age acceleration for CLD patients subgrouped by disease etiology (ArLD, n = 14; NAFLD n = 5; immune-mediated, n = 12) and healthy controls (n = 17). The black symbols denote healthy controls, and the red symbols denote CLD patients. The data are presented as the means ± SEMs or as box-and-whisker plots displaying the medians, lower quartiles, upper quartiles, and means (+). ArLD alcohol-related liver disease, NAFLD nonalcoholic fatty liver disease.
Fig. 4
Fig. 4. Associations of PBMC age with physical parameters.
ad Scatter plots showing the relationships of PBMC epigenetic DunedinPACE score with BMI, quad IMAT, serum leptin concentrations, and serum KITLG concentrations. eh Scatter plots showing the relationships of PhenoAge epigenetic age acceleration with BMI, quad IMAT, serum leptin concentrations, and serum KITLG concentrations. il Scatter plots showing the relationships of Hannum epigenetic age acceleration with dry BMI (CLD, n = 30; controls, n = 16), quad IMAT (CLD, n = 29; controls, n = 16), serum leptin concentrations (CLD, n = 26; controls, n = 17), and serum KITLG concentrations (CLD, n = 27; controls, n = 17). The black symbols denote healthy controls, and the red symbols denote CLD patients. ArLD alcohol-related liver disease, IMAT intramuscular adipose tissue, NAFLD nonalcoholic fatty liver disease.
Fig. 5
Fig. 5. Association of PBMC DunedinPACE scores with immune cell subsets.
Scatter plots displaying the association of PBMC epigenetic DunedinPACE score and a percent of senescent CD4+ T cells (CLD n = 24, control n = 17), b percent of senescent CD8+ T cells (CLD, n = 25; control, n = 17), c percent of exhausted CD4 + T cells (CLD n = 25, control n = 17), d percent of regulatory T cells, and e percent of memory B cells (CLD n = 25, control n = 17). The black symbols denote healthy controls, and the red symbols denote CLD patients.
Fig. 6
Fig. 6. Patients with chronic liver disease exhibit accelerated immune system aging according to phenotypic measures.
a IMM-AGE scores calculated for immune cell subsets in CLD patients (n = 27) and healthy controls (n = 18). b IMM-AGE scores calculated from immune cell subsets for CLD patients subgrouped by disease etiology (ArLD, n = 14; NAFLD, n = 2; immune-mediated, n = 11) and healthy controls (n = 18). ce Scatter plots showing the associations between the IMM-AGE scores of the PBMCs and the physical parameters of quad IMAT%, peak knee extensor torque, and peak quadricep ACSA (n = 26 CLD, n = 17 control). fh Scatter plots showing the association of PBMC IMM-AGE scores with PBMC epigenetic DunedinPACE scores, PhenoAge epigenetic age acceleration, and Hannum epigenetic age acceleration (CLD, n = 25; Control, n = 17). i Scatter plots showing the association between IMM-AGE scores of PBMCs and age-matched muscle epigenetic acceleration (CLD, n = 13; control, n = 17). The black symbols denote healthy controls, and the red symbols denote CLD patients. The data are presented as the mean ± SEM. ACSA anatomical cross-sectional area, ArLD alcohol-related liver disease, IMAT intramuscular adipose tissue, NAFLD nonalcoholic fatty liver disease.

References

    1. Tapper, E. B. & Parikh, N. D. Mortality due to cirrhosis and liver cancer in the United States, 1999-2016: observational study. BMJ362, k2817 (2018). 10.1136/bmj.k2817 - DOI - PMC - PubMed
    1. Allen, S. L. et al. Sarcopenia in chronic liver disease: mechanisms and countermeasures. Am. J. Physiol. Gastrointest. Liver Physiol.320, G241–g257 (2021). 10.1152/ajpgi.00373.2020 - DOI - PMC - PubMed
    1. Montano-Loza, A. J. et al. Inclusion of Sarcopenia Within MELD (MELD-Sarcopenia) and the prediction of mortality in patients with cirrhosis. Clin. Transl. Gastroenterol.6, e102 (2015). 10.1038/ctg.2015.31 - DOI - PMC - PubMed
    1. Hazeldine, J. & Lord, J. M. Innate immunesenescence: underlying mechanisms and clinical relevance. Biogerontology16, 187–201 (2015). 10.1007/s10522-014-9514-3 - DOI - PubMed
    1. Larsson, L. et al. Sarcopenia: aging-related loss of muscle mass and function. Physiol. Rev.99, 427–511 (2019). 10.1152/physrev.00061.2017 - DOI - PMC - PubMed