. 2024 Jul 18;4(1):146.
doi: 10.1038/s43856-024-00559-y.

Precision imaging of cardiac function and scar size in acute and chronic porcine myocardial infarction using ultrahigh-field MRI

Affiliations

Precision imaging of cardiac function and scar size in acute and chronic porcine myocardial infarction using ultrahigh-field MRI

David Lohr et al. Commun Med (Lond). .

Abstract

Background: 7 T cardiac magnetic resonance imaging (MRI) studies may enable higher precision in clinical metrics like cardiac function, ventricular mass, and more. Higher precision may allow early detection of functional impairment and early evaluation of treatment responses in clinical practice and pre-clinical studies.

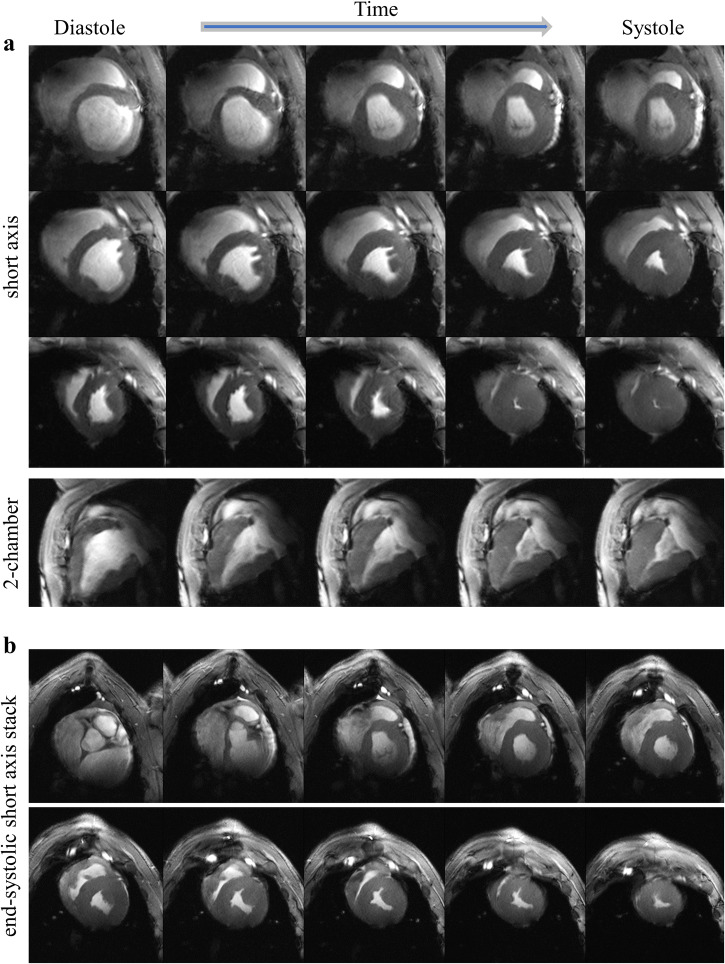
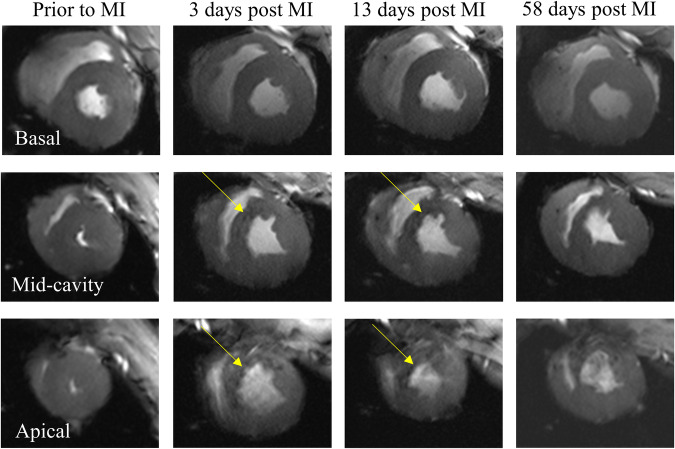
Methods: Seven female German Landrace pigs were scanned prior to and at three time points (3-4 days, 7-10 days, and ~60 days) post myocardial infarction using a whole body 7 T system and three radiofrequency (RF) coils developed and built in-house to accompany animal growth.

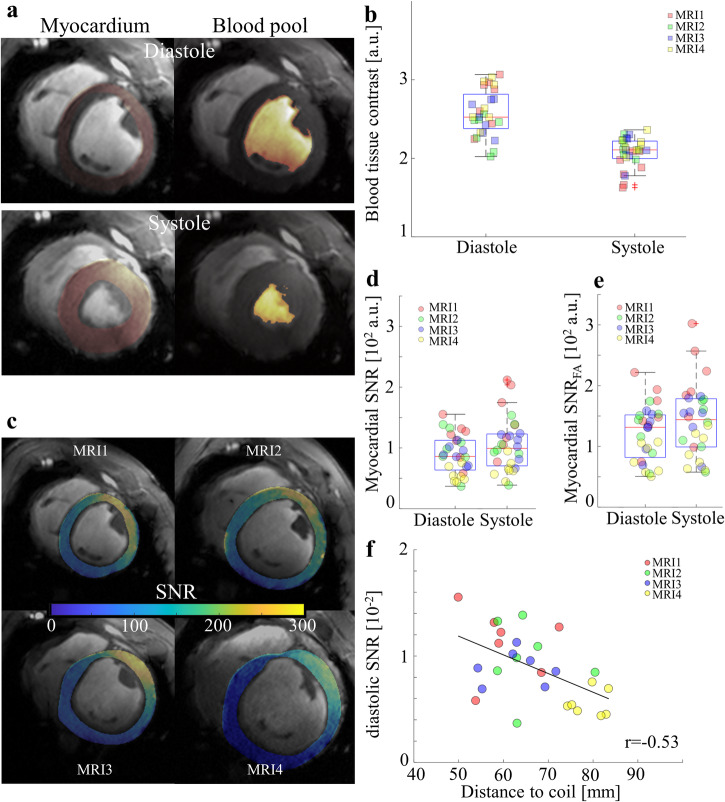
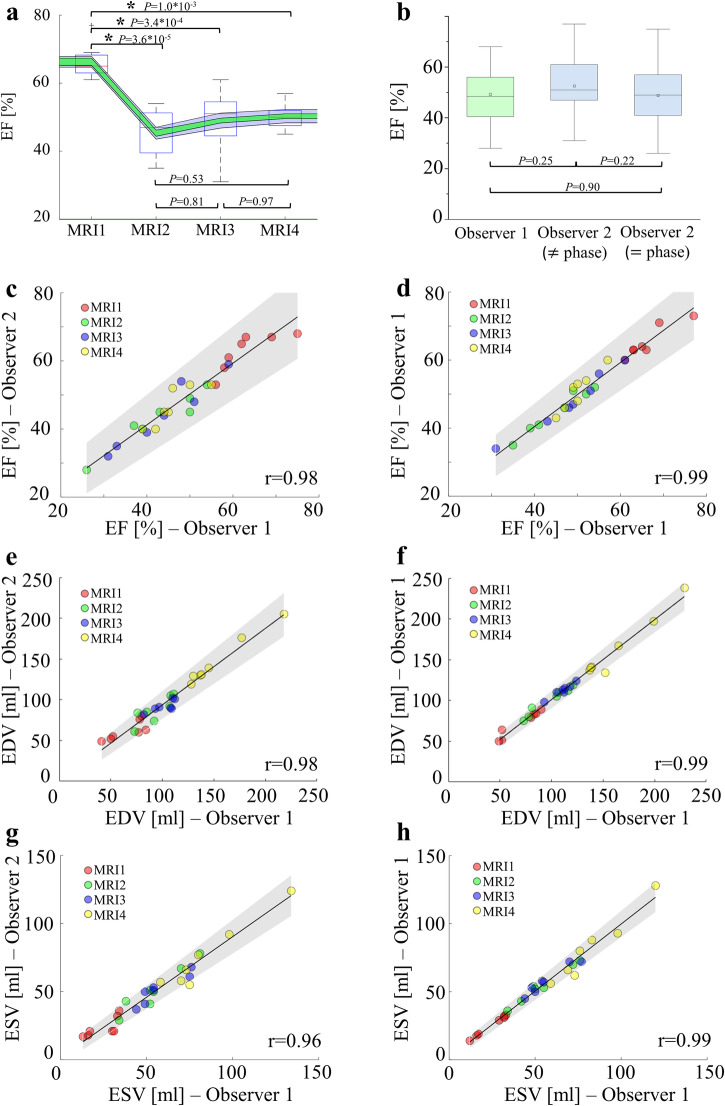
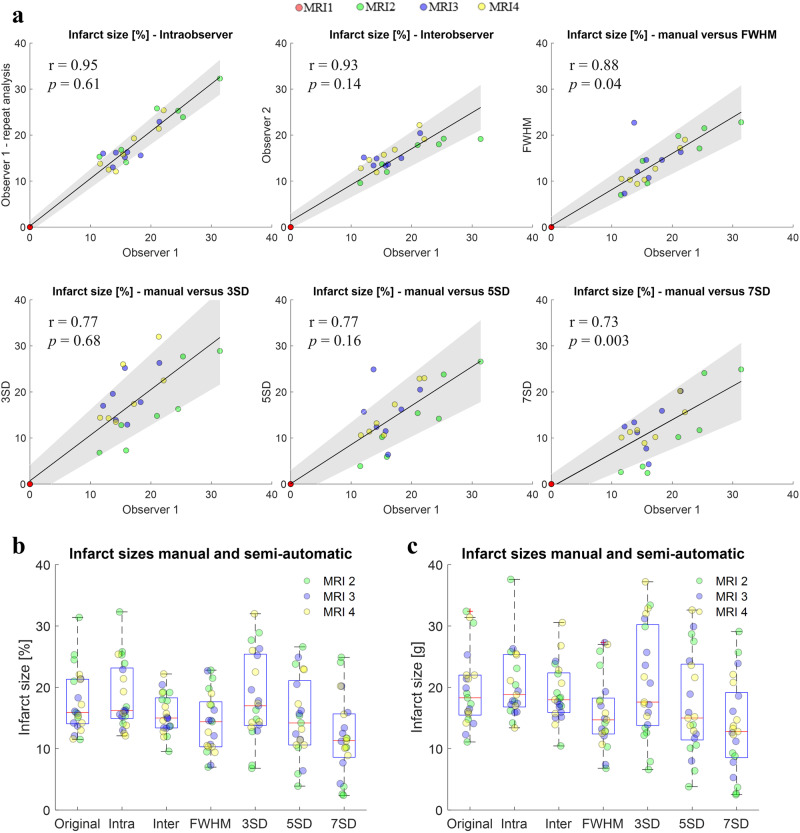
Results: The combination of dedicated RF hardware and 7 T MRI enables a longitudinal study in a pig model of acute and chronic infarction, providing consistent blood tissue contrast and high signal-to-noise ratio (SNR) in measurements of cardiac function, as well as low coefficients of variation (CoV) for ejection fraction (CoVintra-observer: 2%, CoVinter-observer: 3.8%) and infarct size (CoVintra-observer: 8.4%, CoVinter-observer: 3.8%), despite drastic animal growth.

Conclusions: Best results are achieved via manual segmentation. We define state-of-the-art procedures for large animal studies at 7 T.

Plain language summary

In magnetic resonance imaging (MRI), scanners use magnets to generate detailed images of structures in the body, such as the heart. Stronger magnets can produce stronger magnetic fields, which can be leveraged for better image quality and developing new methods for disease diagnosis. In clinical practice, such systems using strong magnets are not yet used for imaging of the heart and some safety aspects remain challenging. We apply such an imaging approach in pigs, in which heart structure and function are similar to humans. We focus on the most important clinical imaging aspects following a heart attack, namely heart function and scar detection. We demonstrate that the high magnetic strength system enabled consistent image quality and accuracy. These findings may help to guide future developments in MRI of the heart, for example in patients who have had a heart attack.


Conflict of interest statement

L.M.S. receives research support by Siemens Healthineers. The position of D.L. is partially paid using this research support. Other authors have no competing interests to declare.

Figures

Fig. 1
Fig. 1. Blood tissue contrast and SNR in 7 T CINE MRI of animals (healthy and post MI) within a weight range of 30–82 kg.
a Representative segmentation for a basal slice in systole. The area with red overlay corresponds to the myocardium, while the yellow area corresponds to the blood pool. The blood pool segmentation includes papillary muscle and cannot directly be used to get an average blood pool signal. We apply a filter that removes all voxels within a signal intensity of one standard deviation of the mean myocardial signal (Supplementary Fig. 4). The displayed blood pool contours are post-application of the filter. Papillary muscles are removed from the segmentation. b Blood tissue contrast for all measurements for diastole and systole. c Myocardial SNR maps (animal) for MRI1 (baseline, weight range: 30-45 kg), MRI2 (acute, 4 ± 1 days post MI, weight range: 35–50 kg), MRI3 (sub-acute, 12 ± 1 days post MI, weight range: 40-53 kg), and MRI4 (chronic, 58 ± 2 days post MI, weight range: 70–82 kg). Wall thinning in the anterolateral wall post MI can be seen particularly well for MRI3 and MRI4. d Raw, unmodified, myocardial SNR for diastole and systole. e Myocardial SNR after flip angle normalization based on measured B1 maps for diastole and systole. f Diastolic SNR plotted against the shortest distance measured from the LV center to the coil housing. This distance was measured using gradient echo images with very short echo time (1.1 ms). The expected negative correlation (Pearson, n = 28) is observed. Color-coding in (b), and (df) corresponds to measurement time points prior to and post MI. Boxes in boxplots depict 25th to 75th percentiles, while medians are marked as horizontal line. Whiskers extend to the most extreme data points and outliers are indicated by red pluses. Sample size in all plots is n = 28. LV left ventricle, MI myocardial infarction, MRI magnetic resonance imaging, SNR signal-to-noise ratio.
Fig. 2
Fig. 2. UHF cardiac MRI provides data on cardiac function with higher resolution than is feasible in clinical routine.
Representative high resolution (0.4 × 0.4 mm2 in-plane) cine images of a baseline (healthy) MRI (animal F). To illustrate image quality over the cardiac cycle, five equidistant time points of a RR-interval are displayed. Images were acquired with coil1. a Short axis view for a basal, a mid-cavity, and an apical slice as well as a 2-chamber view. b End-systolic short axis stack. MRI magnetic resonance imaging, UHF ultra-high field.
Fig. 3
Fig. 3. UHF cardiac MRI in a pig before infarct induction enables the visualization of fine structures currently not assessed in clinical routine and improves delineation of tissue boundaries.
Comparison of moderate (0.6 × 0.6 mm2) and high spatial in-plane resolution (0.4 × 0.4 mm2), systolic, short axis CINE stack (animal F). Minor artifacts are visible in the right ventricle, in the left ventricle near blood-myocardium interfaces (dark rim artifact), and at lung-tissue boundaries. Arrows (yellow: valves, blue: vasculature, purple: RV) point towards examples for improved visibility of fine anatomical structures due to the higher resolution. a Basal segments in both resolutions. The increased resolution enables the identification branching coronary arteries. b mid-cavity segments in both resolutions. The increased resolution led to better delineation of coronary arteries and myocardial boundaries and indications of crypt-like features in the myocardium. c apical segments in both resolutions. The increased resolution led to better delineation of the RV. MRI magnetic resonance imaging, RV right ventricle, UHF ultra-high field.
Fig. 4
Fig. 4. Susceptibility effects in CINE acquisitions at 7 T (animal H).
Representative basal, mid-cavity, and apical CINE images of the same animal prior to and at three time points after myocardial infarction. Arrows indicate areas with susceptibility induced signal loss in mid-cavity and apical slices in the acute and sub-acute phase post MI, which are most likely caused by hemorrhage and structural changes in the myocardium after myocardial infarction. Susceptibility induced signal loss was significantly less severe in chronic stages of MI. Images in the chronic phase show severe wall thinning in the infarct region. MI myocardial infarction.
Fig. 5
Fig. 5. Assessment of cardiac function in a large animal model of acute and chronic infarction.
a Ejection fraction at baseline (MRI1), acute (MRI2, 4 ± 1 days post MI), sub-acute (MRI3, 12 ± 1 days post MI), and chronic (MRI4, 58 ± 2 days post MI) phases of the study. The asterisk indicates significant differences in a paired t-test (n = 7, p < 0.05). Green and gray backgrounds illustrate the impact of inter-observer and intra-observer variability, respectively. b Influence of the selection of end-diastole and end-systole on derived ejection fraction compared to another observer. Selecting identical phases for end-diastole and end-systole (“harmonization”) shows that manual segmentation between the two observers matches well for all time points. Statistical differences were tested using a paired t-test (n = 28, p < 0.05). c, e, g Correlation of EF, EDV, and ESV values determined by two different Observers. d, f, h Correlation of EF, EDV, and ESV values determined by the same Observer. Gray shading in (ch) indicates 95% confidence intervals of the fit. Color-coding in (ch) corresponds to measurement time points prior to and post MI. Boxes in boxplots depict 25th to 75th percentiles, while medians are marked as horizontal line. Whiskers extend to the most extreme data points and outliers are indicated by red pluses. Sample size in boxplots for (a) is n = 7 each. Sample size in boxplots for (b) was n = 28 each. EF ejection fraction, EDV end-diastolic volume, ESV end-systolic volume, MI myocardial infarction, MRI magnetic resonance imaging.
Fig. 6
Fig. 6. 7 T late gadolinium enhancement in large animals (30–82 kg) with acute and chronic infarction.
a Representative short axis LGE images both in vivo and ex vivo 57 days post MI. Images demonstrate great correlation between in vivo and ex vivo measurements, in particular for PSIR data. Images are windowed for scar visibility. b 2-chamber magnitude and PSIR LGE images 12 and 57 days post MI. c Comparison of in vivo and ex vivo LGE as well as TTC data for a basal, mid-cavity, and an apical slice. LGE images were selected to visualize individual artifacts such as signal enhancement in the lateral wall due to insufficient inversion or streaking artifacts due to trigger inconsistencies in the mid-cavity slice. Corresponding TTC images, particularly the basal slice, showcase the difficulty for segmentation regarding endo- and epicardial borders for MI quantification. LGE late gadolinium enhancement, MI myocardial infarction, PSIR phase sensitive inversion recovery, TTC triphenyl tetrazolium chloride.
Fig. 7
Fig. 7. Correlation of manual and semi-automatic infarct quantification based on PSIR images.
a Correlation plots for intra-observer variability, inter-observer variability, and the semi-automatic methods FWHM, 3SD, 5SD, and 7SD relative to manual segmentation. b Boxplot for infarct size [%] distributions for all segmentations. c Boxplot for infarct size [g] distributions for all segmentations. Color-coding corresponds to measurement time points prior to and post MI. Significance values are based on paired t-tests (p < 0.05) with the original segmentation. Significant differences post Bonferoni correction are marked with an asterisk. MRI indices refer to baseline (MRI1), acute (MRI2, 4 ± 1 days post MI), sub-acute (MRI3, 12 ± 1 days post MI), and chronic (MRI4, 58 ± 2 days post MI) phases of the study. Boxes in boxplots depict 25th to 75th percentiles, while medians are marked as horizontal line. Whiskers extend to the most extreme data points and outliers are indicated by red pluses. Sample size in boxplots was n = 21 each. Gray shading in a indicates 95% confidence intervals of the fit. Color-coding in (ac) corresponds to measurement time points prior to and post MI. FWHM full width half maximum, MI myocardial infarction, MRI magnetic resonance imaging, PSIR phase sensitive inversion recovery, SD standard deviation.
Fig. 8
Fig. 8. Correlation of infarct sizes derived from in vivo and ex vivo LGE images as well as TTC staining.
a Correlation plots for infarct sizes in % derived from PSIR and magnitude LGE images. r-values denote Pearson correlation coefficients (n = 7) and significance values are based on a Bonferroni corrected paired t-test (n = 7). b Method dependent infarct sizes [%] over the whole LV volume for all seven animals. c Method dependent infarct sizes [g] over the whole LV volume for all seven animals. “iv” denotes in vivo scans, “pm” denotes post mortem scans. TTC(mean), TTC(bot), and TTC(top) refer to the way infarct sizes were determined from TTC images. Values for TTC(bot) were derived from the bottom view of the slice (line of sight from apex to base), values for TTC(top) from the top view (line of sight from base to apex), and values for TTC(mean) as the mean of both views. Color-coding in (b, c) corresponds to the different animals. Boxes in boxplots depict 25th to 75th percentiles, while medians are marked as horizontal line. Whiskers extend to the most extreme data points and outliers are indicated by red pluses. Sample size in boxplots was n = 7 each. Gray shading in (a) indicates 95% confidence intervals of the fit. Color-coding in (a) corresponds to the measurement time point post MI (MRI4). Color-coding in (bc) corresponds to the individual animals. iv in vivo, pm post mortem, LGE late gadolinium enhancement, MAG magnitude, MI myocardial infarction, PSIR phase sensitive inversion recovery, TTC triphenyl tetrazolium chloride.

Similar articles

Cited by

References

    1. Hundley WG, et al. ACCF/ACR/AHA/NASCI/SCMR 2010 expert consensus document on cardiovascular magnetic resonance. Circulation. 2010;121:2462–2508. doi: 10.1161/CIR.0b013e3181d44a8f. - DOI - PMC - PubMed
    1. Ibanez B, et al. Cardiac MRI endpoints in myocardial infarction experimental and clinical trials: JACC scientific expert panel. J. Am. Coll. Cardiol. 2019;74:238–256. doi: 10.1016/j.jacc.2019.05.024. - DOI - PMC - PubMed
    1. Bulluck H, Dharmakumar R, Arai AE, Berry C, Hausenloy DJ. Cardiovascular magnetic resonance in acute ST-segment–elevation myocardial infarction. Circulation. 2018;137:1949–1964. doi: 10.1161/CIRCULATIONAHA.117.030693. - DOI - PMC - PubMed
    1. Stäb, D. et al. Cardiac magnetic resonance imaging at 7 Tesla. JoVE143, e55853 (2019). - PubMed
    1. Reiter T, et al. On the way to routine cardiac MRI at 7 Tesla - a pilot study on consecutive 84 examinations. PloS ONE. 2021;16:e0252797. doi: 10.1371/journal.pone.0252797. - DOI - PMC - PubMed

LinkOut - more resources