. 2024 Jul 18;25(1):191.
doi: 10.1186/s13059-024-03318-3.

Single-cell decoding of drug induced transcriptomic reprogramming in triple negative breast cancers

Affiliations

Single-cell decoding of drug induced transcriptomic reprogramming in triple negative breast cancers

Farhia Kabeer et al. Genome Biol. .

Abstract

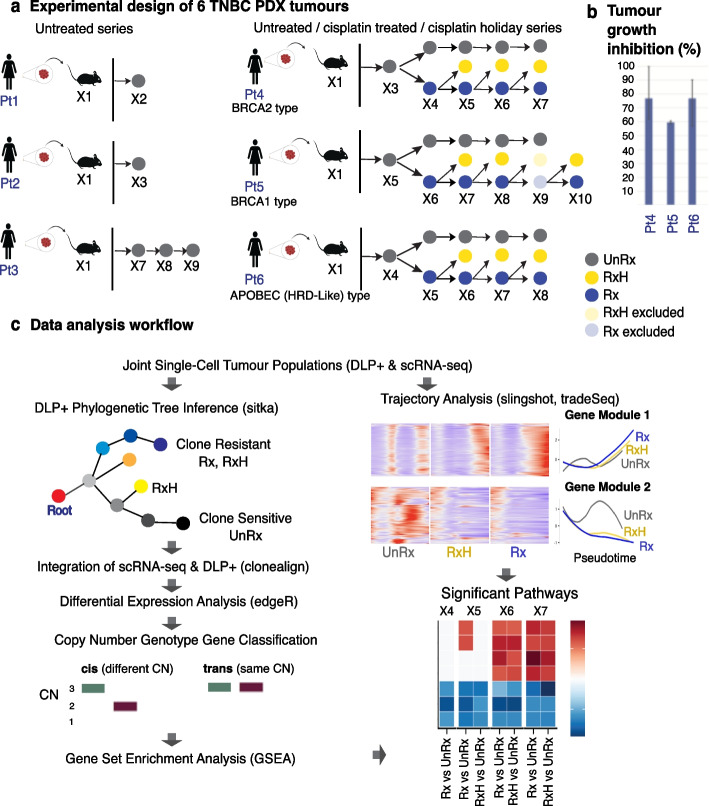
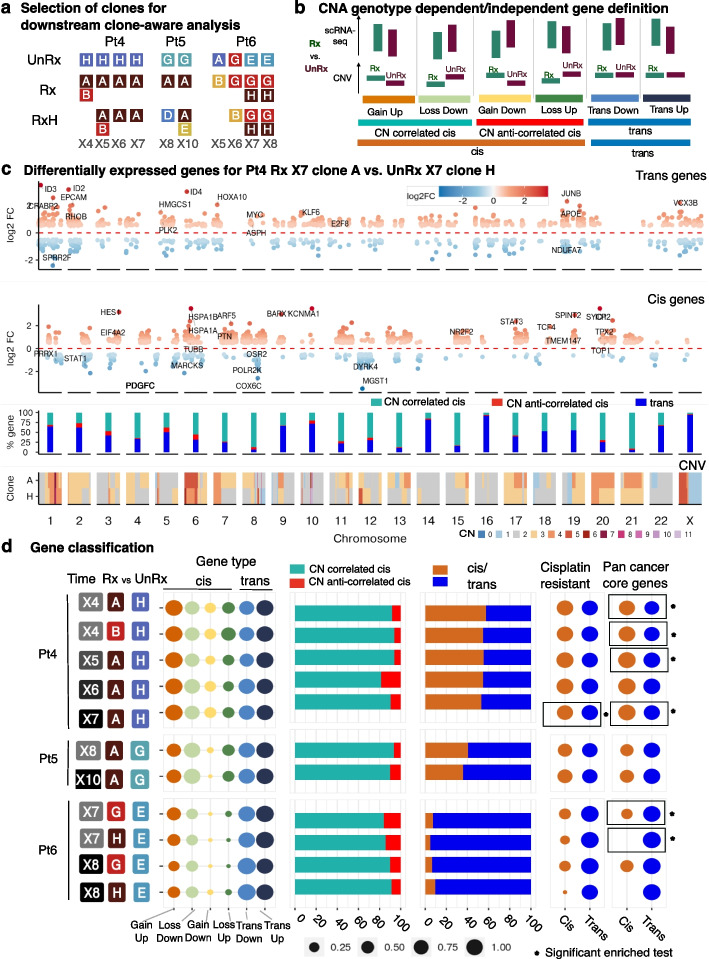
Background: The encoding of cell intrinsic drug resistance states in breast cancer reflects the contributions of genomic and non-genomic variations and requires accurate estimation of clonal fitness from co-measurement of transcriptomic and genomic data. Somatic copy number (CN) variation is the dominant mutational mechanism leading to transcriptional variation and notably contributes to platinum chemotherapy resistance cell states. Here, we deploy time series measurements of triple negative breast cancer (TNBC) single-cell transcriptomes, along with co-measured single-cell CN fitness, identifying genomic and transcriptomic mechanisms in drug-associated transcriptional cell states.

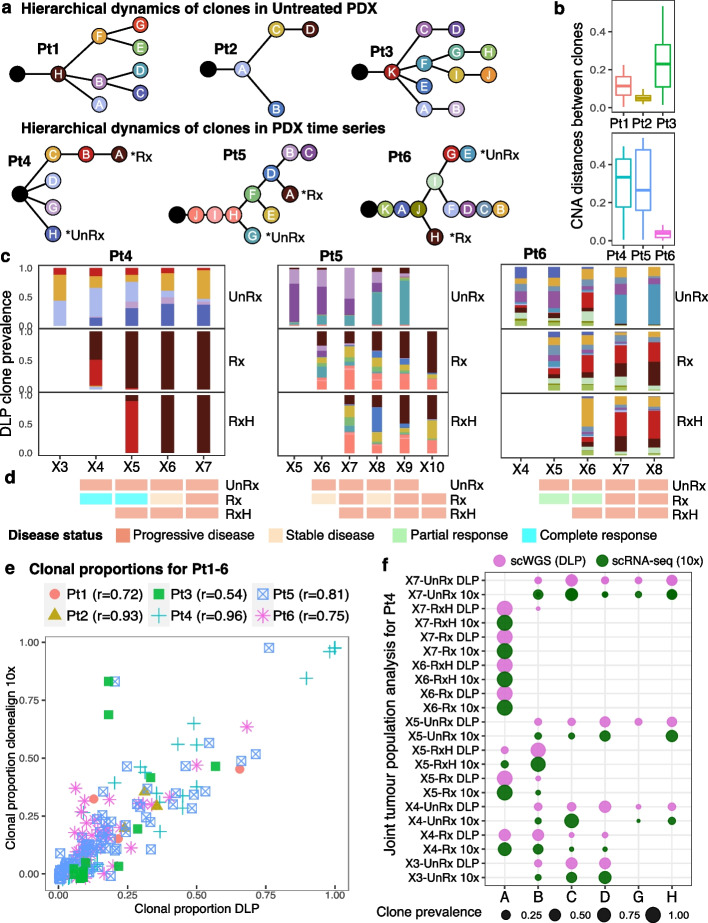
Results: We present scRNA-seq data (53,641 filtered cells) from serial passaging TNBC patient-derived xenograft (PDX) experiments spanning 2.5 years, matched with genomic single-cell CN data from the same samples. Our findings reveal distinct clonal responses within TNBC tumors exposed to platinum. Clones with high drug fitness undergo clonal sweeps and show subtle transcriptional reversion, while those with weak fitness exhibit dynamic transcription upon drug withdrawal. Pathway analysis highlights convergence on epithelial-mesenchymal transition and cytokine signaling, associated with resistance. Furthermore, pseudotime analysis demonstrates hysteresis in transcriptional reversion, indicating generation of new intermediate transcriptional states upon platinum exposure.

Conclusions: Within a polyclonal tumor, clones with strong genotype-associated fitness under platinum remained fixed, minimizing transcriptional reversion upon drug withdrawal. Conversely, clones with weaker fitness display non-genomic transcriptional plasticity. This suggests CN-associated and CN-independent transcriptional states could both contribute to platinum resistance. The dominance of genomic or non-genomic mechanisms within polyclonal tumors has implications for drug sensitivity, restoration, and re-treatment strategies.

Keywords: Cisplatin treatment; Clone aware analysis; DLP+ single-cell sequencing; In-cis/in-trans genes; PDX; Sensitive/resistant clones; Single-cell RNA sequencing.


Conflict of interest statement

Samuel Aparicio is founder of Genome Therapeutics Ltd, outside the scope of this study. The remaining authors declare that they have no competing interests.

Figures

Fig. 1
Fig. 1
Workflow of experimental and study design for tracking drug induced transcriptome reprogramming. a Tumor biopsies from 6 TNBC patients were transplanted in immunodeficient mice. Three TNBC untreated time-series (Pt1-3) and three cisplatin-treated time-series (Pt4-6) with its counter drug holiday samples. UnRx: Grey-untreated, Rx: Blue-cisplatin treated, RxH: Yellow-cisplatin drug holiday (kept untreated for that cycle of treatment). The treated, drug holiday samples at X9, Pt5 were excluded from analysis due to its sample qualities. b Tumor growth inhibition graphs for Pt4, Pt5 and Pt6. c Data analysis workflow, including phylogenetic tree inference using DLP single-cell copy number profiles from previously published work [27], followed by clonal alignment from DLP copy number to RNA-seq gene expression with clonealign [28]. Differentially expressed genes are then classified into in-cis and in-trans based on overlapping genomic regions, and based on the positive or negative directions of copy number tendency and gene expression trend (upregulated or downregulated). Significant pathways were determined by applying gene set enrichment analysis. Pseudotime analysis identified genes with significant change in expression along the trajectories of evolution through drug treatment
Fig. 2
Fig. 2
Assignment of structural-copy number clone structure to scRNA-seq. Summary results of phylogenetic trees and clone alignment correlations. a Inferred phylogenetic trees of three untreated PDX patients Pt1-3, and three drug treatment time-series data Pt4-6. Resistant, sensitive cell clones were developed at different branches far from each other. (*) denote high fitness coefficient clones in each branch based on the previously published work [26]. b Manhattan copy number distances between median copy number profiles of paired clones in each series denote the variance level in the copy number DLP tree. c Clonal evolution of cells with/without drug treatment across time. d Disease classification at each time point and treatment status for Pt4-6. e Each point shows the clonealign-inferred scRNA-seq clonal proportion (y-axis) versus the corresponding DLP+ clonal proportion (x-axis) for each clone in each sample. Each patient is denoted by a different shape. Pearson correlation coefficients for each patient are reported at the top. f Pearson correlation between clonal proportions in DLP, and inferred clonal proportions in 10x – scRNA-seq expression at the same passages from patient Pt4 using clonealign. Strong positive correlation demonstrates that clonealign is able to provide accurate alignment
Fig. 3
Fig. 3
In-cis and In-trans gene proportions and gene set memberships. a For Pt4-6, the clones at the same passage that were the fittest or most abundant and had at least 100 scRNA-seq cells were selected for further clone-aware analysis. Examples of comparisons include: Pt4 X4 Rx:A vs. UnRx:H, or Pt5 X10 RxH:E vs. UnRx:G. b Gene classification: genes are divided into in-cis (located in regions of CN differences) and in-trans (no CN differences). In-cis gene expression is denoted as CN correlated cis (concordant with CNA change) or CN anti-correlated (discordant with CNA change). c Differentially expressed genes for Pt4 between resistant clone A in Rx passage X7 versus sensitive clone H in UnRx passage X7, classified into “in-trans” (top panel) and “in-cis” genes (second panel). Red and blue gradient colors denote the degree of log2 fold change (FC) in positive and negative directions. Each dot is one significant DE gene with selected conditions abs(log2FC) > 0.5, FDR < 0.01, p value < 0.05. Third panel: % in-cis CN correlated—light green, CN anti-correlated—red, and in-trans genes—blue color per chromosome. Bottom panel: median copy number profile of genomic regions for the two clones from DLP+ results. d Differentially expressed genes between resistant clones versus sensitive clones in Pt4-6 were classified into different gene types. The dot size represents the proportion of each gene type based on the definition in b. Gene set membership: mapping of in-cis and in-trans genes to 2 reference gene sets: our curated cisplatin resistance gene set from the literature and Pan cancer core genes set [31]. Rectangles with * show significant enrichment of reference gene sets - results of statistical tests using GSEA [32] with p-adj values < 0.05
Fig. 4
Fig. 4
Gene level dynamic changes. a Schematic showing our gene selection criteria for Pt4-6: genes in b, c, d are differentially expressed (DE, fdr < 0.01, |log2 fold change| =|logFC|> 0.5) at Rx vs. UnRx and non-DE (fdr > 0.1) at Rx vs. RxH; genes in e, f, g are DE at Rx vs. RxH and intersected with all the genes in Rx and UnRx. The clones in Fig. 3a were used for comparisons. b Number of in-cis or in-trans treatment induced (logFC > 0.5) and repressed (logFC <− 0.5) genes for Pt4-6, when comparing the clones listed in the bottom panel. Genes are selected as explained in panel a. The in-cis and in-trans gene annotation uses the copy numbers at Rx and UnRx. c Scatter plots for logFC of Rx vs. UnRx (y axis) against logFC of Rx vs. UnRx (x axis) for the comparisons with the largest numbers in panel b. Each point is a gene. The color legend is the same as in panel b. d Two examples of induced and repressed genes for Pt4 and Pt6. e Number of in-cis or in-trans holiday diverged genes, split in two main categories: “towards UnRx” if logFC of Rx vs. RxH has the same sign as logFC of Rx vs. UnRx, and “away from UnRx” otherwise. The comparisons are as explained in panel a. The in-cis and in-trans gene annotation uses the copy numbers at Rx and RxH. f Scatter plots for logFC of Rx vs. UnRx (y axis) against logFC of Rx vs. UnRx (x axis) for Pt4 X5 (UnRx:H, Rx: A, RxH:B). Each point is a gene. The color legend is the same as in panel e. g Two examples of diverged genes away from (left) and towards (right) UnRx
Fig. 5
Fig. 5
Hallmark significant pathways in Rx, or RxH versus UnRx for Pt4-Pt6. a Significantly enriched pathways (p < 0.05, vertical axis) from a ranked gene set enrichment analysis (GSEA) [32], using the Hallmark gene set collection from MSigDB [32, 35]. Each column corresponds to one comparison between a treated or holiday clone versus an untreated clone (as denoted in Fig. 3a), for a specific patient and time point. The color intensity signifies the normalized enrichment score (NES) results of enrichment analysis obtained by using all the edgeR differentially expressed genes for that comparison at FDR < 0.01 and |log2 fold change|> = 0.25. Only the common pathways that are enriched in at least three DE comparisons across all patients are shown. b The distribution of in-cis and in-trans pathway gene proportions for all the comparisons in a. c The number of upregulated and downregulated pathways in each column in a. d Pathway status of treated-untreated comparisons against the pathway status of their respective holiday-untreated comparisons, split into four types of changes: (i) “Rx only” include pathways that are enriched in treated, but not in holiday; (ii) “RxH only” are pathways that were not enriched in treated, but are enriched in holiday; (iii) “both same direction” are pathways that are enriched in the same direction in treated and holiday; and (iv) “both reverse direction” are pathways that are enriched in a different direction in treated and holiday samples
Fig. 6
Fig. 6
Dynamic gene regulation modules across treatment are captured using pseudotime analysis in Pt4 and Pt5. a, b UMAP visualization with individual cell lineages—output of pseudotime analysis for Pt4 (a) and Pt5 (b) coloured by actual drug treatment status (UnRx: untreated cells, Rx: drug treatment, RxH: drug holiday). Green circle denotes starting point of a lineage, red circle denotes the end point of a lineage. c, d Heatmap of gene expression across the pseudotime of different lineages for Pt4 (c) and Pt5 (d). X-axis: relative smoothed gene expression of each gene in each lineage, colors denoting gene expression level, blue—low expression, red—high expression. Gene types of each individual gene across different lineages, dark chocolate: in-cis, blue: in-trans gene. Chromatin status of each gene module: active—red, bivalent—cyan, repressed—blue. Y-axis: each row is an individual gene. Rows are grouped by regulatory gene modules (M denotes a gene module), i.e., M1(132) means gene module 1 and contains 132 genes. e, f Summary of relative gene expression for individual lineages in each gene module from heatmap panels c, d and list of Hallmark enriched pathways related to each gene module based on enrichment analysis gprofilers statistical tests with P-adj < 0.05. Bar size denotes the number of genes in each gene module that belong to significant Hallmark gene sets (M6 in panel e did not have any significant gene sets; therefore, we included the pathways that had the most number of genes). x-axis: pseudotime, y-axis: relative expression scaled from −2 to 2

References

    1. Sherman MS, Lorenz K, Lanier MH, Cohen BA. Cell-to-cell variability in the propensity to transcribe explains correlated fluctuations in gene expression. Cell Syst. 2015;1:315–325. doi: 10.1016/j.cels.2015.10.011. - DOI - PMC - PubMed
    1. Elowitz MB, Levine AJ, Siggia ED, Swain PS. Stochastic gene expression in a single cell. Science. 2002;297:1183–1186. doi: 10.1126/science.1070919. - DOI - PubMed
    1. van Oudenaarden A. Nature, nurture, or just blind chance: Stochastic gene expression and its consequences. Biophys J. 2009:15a. 10.1016/j.bpj.2008.12.975. - PMC - PubMed
    1. Strober BJ, Elorbany R, Rhodes K, Krishnan N, Tayeb K, Battle A, et al. Dynamic genetic regulation of gene expression during cellular differentiation. Science. 2019;364:1287–1290. doi: 10.1126/science.aaw0040. - DOI - PMC - PubMed
    1. Shaffer SM, Dunagin MC, Torborg SR, Torre EA, Emert B, Krepler C, et al. Rare cell variability and drug-induced reprogramming as a mode of cancer drug resistance. Nature. 2017;546:431–435. doi: 10.1038/nature22794. - DOI - PMC - PubMed

MeSH terms

Substances

LinkOut - more resources