. 2024 Jul 18;22(1):423.
doi: 10.1186/s12951-024-02711-1.

Adipose-derived stem cell exosomes loaded with icariin alleviates rheumatoid arthritis by modulating macrophage polarization in rats

Affiliations

Adipose-derived stem cell exosomes loaded with icariin alleviates rheumatoid arthritis by modulating macrophage polarization in rats

Qiqi Yan et al. J Nanobiotechnology. .

Abstract

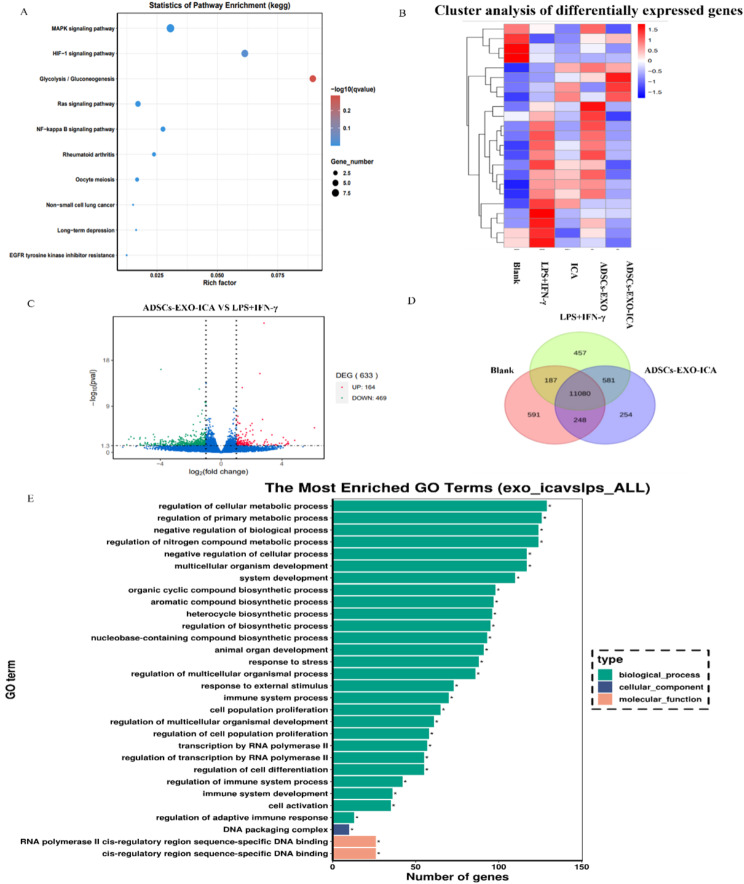
Rheumatoid arthritis (RA) is a chronic autoimmune disease marked by synovitis and cartilage destruction. The active compound, icariin (ICA), derived from the herb Epimedium, exhibits potent anti-inflammatory properties. However, its clinical utility is limited by its water insolubility, poor permeability, and low bioavailability. To address these challenges, we developed a multifunctional drug delivery system-adipose-derived stem cells-exosomes (ADSCs-EXO)-ICA to target active macrophages in synovial tissue and modulate macrophage polarization from M1 to M2. High-performance liquid chromatography analysis confirmed a 92.4 ± 0.008% loading efficiency for ADSCs-EXO-ICA. In vitro studies utilizing cellular immunofluorescence (IF) and flow cytometry demonstrated significant inhibition of M1 macrophage proliferation by ADSCs-EXO-ICA. Enzyme-linked immunosorbent assay, cellular transcriptomics, and real-time quantitative PCR indicated that ADSCs-EXO-ICA promotes an M1-to-M2 phenotypic transition by reducing glycolysis through the inhibition of the ERK/HIF-1α/GLUT1 pathway. In vivo, ADSCs-EXO-ICA effectively accumulated in the joints. Pharmacodynamic assessments revealed that ADSCs-EXO-ICA decreased cytokine levels and mitigated arthritis symptoms in collagen-induced arthritis (CIA) rats. Histological analysis and micro computed tomography confirmed that ADSCs-EXO-ICA markedly ameliorated synovitis and preserved cartilage. Further in vivo studies indicated that ADSCs-EXO-ICA suppresses arthritis by promoting an M1-to-M2 switch and suppressing glycolysis. Western blotting supported the therapeutic efficacy of ADSCs-EXO-ICA in RA, confirming its role in modulating macrophage function through energy metabolism regulation. Thus, this study not only introduces a drug delivery system that significantly enhances the anti-RA efficacy of ADSCs-EXO-ICA but also elucidates its mechanism of action in macrophage function inhibition.

Keywords: A novel drug delivery system—adipose-derived stem cells-exosomes (ADSCs-EXO)-ICA; Adipose-derived stem cell exosomes; Collagen-induced arthritis; Macrophage polarization; Rheumatoid arthritis; Synergistic effect; icariin.


Conflict of interest statement

The authors declare no competing interests.

Figures

Fig. 1
Fig. 1
(A-C) The drug delivery system—adipose-derived stem cell exosomes (ADSCs-EXO) loaded with icariin (ICA)—synergistically inhibits M1-type macrophage inflammation induced by lipopolysaccharide (LPS) and interferon-gamma, as well as the arthritic symptoms in collagen-induced arthritis (CIA) rats. ADSCs-EXO-ICA adjust macrophage polarization by inhibiting glycolysis mediated by the ERK1/2/HIF-1α/GLUT1 pathway
Fig. 2
Fig. 2
Characterization of ADSCs-EXO and ADSCs-EXO-ICA using TEM, NTA, and Western Blot. (A, D) TEM images of ADSCs-EXO and ADSCs-EXO-ICA. (B, C, E, and F) NTA characterization of ADSCs-EXO and ADSCs-EXO-ICA. (G) Western Blot analysis of ADSCs-EXO and ADSCs-EXO-ICA. (H, I) Encapsulation rate of ADSCs-EXO-ICA determined by HPLC. (J) Quantitative analysis of the average fluorescence intensity for both ADSCs-EXO and ADSCs-EXO-ICA. Data were expressed as mean ± SD (n = 3, *p < 0.05 vs. the ADSCs-EXO group). (K) Immunofluorescence imaging of PKH-67-labeled ADSCs-EXO and ADSCs-EXO-ICA
Fig. 3
Fig. 3
ICA, ADSCs-EXO, and ADSCs-EXO-ICA reduce macrophage polarization towards the M1-type, particularly ADSCs-EXO-ICA. (A) Expression of iNOS in LPS + IFN-γ-induced macrophages treated with ICA, ADSCs-EXO, and ADSCs-EXO-ICA. (B) Percentage of M1 macrophages (F4/80+CD86+) treated with the interventions. (C) Immunofluorescence results and quantitative analysis of M1-type with different interventions. (D) Flow cytometry results and qualitative analysis of M1-type with different interventions. (E-G) Levels of cytokines (TNF-α, IL-6, and IL-10) in the cell supernatant. Data were expressed as mean ± SD (n = 3, **** p < 0.0001 vs. the Blank group, #p < 0.05, ###p < 0.001 and ####p < 0.0001 vs. the LPS + IFN-γ group, &p < 0.05, &&&p < 0.001, and &&&&p < 0.0001 vs. the ADSCs-EXO group, ++p < 0.01, +++p < 0.001, and ++++p < 0.0001 vs. the ICA group, ^^p < 0.01 vs. the ICA group, MFI represented mean fluorescence intensity. Blue = DAPI channel, red = iNOS channel. Scale bar = 50 μm)
Fig. 4
Fig. 4
Molecular mechanisms of ADSCs-EXO-ICA. (A) KEGG pathway analysis of activated RAW264.7 macrophages treated with ICA, ADSCs-EXO, and ADSCs-EXO-ICA. (B) Differential gene clustering diagram of ERK1/2, HIF-1α and GLUT1. (C) Differential Gene Volcano diagram. (D) Differential Gene Venn diagram. (E) GO enrichment histogram
Fig. 5
Fig. 5
(A-C) Relative mRNA expression levels of Glut1, HIF-1α, and ERK1/2 in activated RAW264.7 macrophages incubated with ADSCs-EXO-ICA detected by quantitative real-time PCR (qRT-PCR). (D-E) Relative mRNA expression of TNF-α (marked M1-type macrophage) and TGF-β (marked M2-type macrophage) examined by qRT-PCR. (F-H) Relative mRNA expression of HKII, G6PD and LDHA examined by qRT-PCR. (J-L) Levels of Succinic acid, Citric acid, G6PD and HKII in cell supernatant. Datas were expressed as mean ± SD (n = 3, ** p < 0.01 *** p < 0.001 and **** p < 0.0001 vs. the Blank group, # #p < 0.01, ###p < 0.001 and ####p < 0.0001 vs. the LPS + IFN-γ group, &p < 0.05, &&p < 0.01, &&&p < 0.001, and &&&&p < 0.0001 vs. the ADSCs-EXO group, +++p < 0.001, and ++++p < 0.0001 vs. the ICA group, ^^p < 0.01 and ^^^^p < 0.0001 vs. the ICA group)
Fig. 6
Fig. 6
Biodistribution and therapeutic treatment of ADSCs-EXO, ADSCs-EXO-ICA200, and ADSCs-EXO-ICA400 in CIA rats. (A) Real-time fluorescence imaging of CIA rats in vivo and ex vivo imaging of organs 24 h after intravenous injection of ADSCs-EXO, ADSCs-EXO-ICA200, and ADSCs-EXO-ICA400 (n = 3). (B) Semi-quantitation of fluorescence intensity in joints and organs. (C) Fluorescence intensity in CIA rats 24 h post-intravenous injection of the respective treatments. (Datas were expressed as mean ± SD, n = 3, *p < 0.05 vs. the ADSCs-EXO, ##p < 0.01 vs. the ADSCs-EXO group)
Fig. 7
Fig. 7
ADSCs-EXO-ICA demonstrates superior anti-inflammatory efficacy in early arthritis in CIA rats. (A) Arthritis score in different treatment groups over 14 days (n = 5). (B) Paw thickness in different groups over 14 days. (C-D) Levels of Rheumatoid Factor (RF) and Collagen II (CII) in CIA rats. (E-H) Cytokine levels (CRP, TNF-α, IL-1β, IL-6, and IL-10) in the serum of CIA rats. (Data were expressed as mean ± SD (n = 3, *p < 0.05, **p < 0.01 and ****p < 0.0001 vs. the Control group, #p < 0.05, ##p < 0.01, ###p < 0.001 and ####p < 0.0001 vs. the CIA group, &p < 0.05, &&p < 0.01, &&&p < 0.001,and &&&&p < 0.0001 vs. the ADSCs-EXO group, +p < 0.05, ++p < 0.01, +++p < 0.001and ++++p < 0.0001 vs. the ICA group, •• p < 0.01 and •••• p < 0.0001 vs. the ADSCs-EXO-ICA400 group, Δp < 0.05 and ΔΔΔΔp < 0.0001 vs. the MTX group, ns = no significance)
Fig. 8
Fig. 8
Therapeutic efficacy of different treatments, especially ADSCs-EXO-ICA200. (A) Study procedure for a therapeutic regimen in a CIA rat model. (B) Exterior images of rats receiving different treatments. (C, H) Representative Hematoxylin-eosin (H, E) staining of ankle joint samples from different drug groups in histological analysis. Red arrows indicate the synovium. (D, I) Representative Safranin O-Fast green (S-O) staining of ankle joint samples from different drug groups in histological analysis. Green arrows point to articular cartilage. (E, J) Representative tartrate-resistant acid phosphatase (TRAP) staining of ankle joint samples from different drug groups in histological analysis. Yellow arrows to osteoclasts (scale bars: H&E and S-O = 200 μm, TRAP = 100 μm). (F-K) Representative micro-CT images and quantitative analyses of ankle joints from rats with different treatments. (G-L) Representative micro-CT images and quantitative analyses of knee joints from rats with different treatments. (n = 3, BS/BV, BMD, BV/TV, Tb.Sp, Tb.N). Data were expressed as mean ± SD (n = 3, *p < 0.05, **p < 0.01 and ****p < 0.0001 vs. the Control group, #p < 0.05, ##p < 0.01, ###p < 0.001 and ####p < 0.0001 vs. the CIA group, &p < 0.05, &&p < 0.01, &&&p < 0.001,and &&&&p < 0.0001 vs. the ADSCs-EXO group, +p < 0.05, ++p < 0.01, +++p < 0.001, and ++++p < 0.0001 vs. the ICA group, • p < 0.05, •• p < 0.01 •••• p < 0.0001 vs. the ADSCs-EXO-ICA200 group, ΔΔp < 0.01 and ΔΔΔΔp < 0.0001 vs. the ADSCs-EXO-ICA200 group, ns = no significance)
Fig. 9
Fig. 9
ADSCs-EXO-ICA inhibited early arthritis in CIA rats, potentially by inhibiting glycolysis in macrophages, thus reducing M1-type macrophage polarization. (A) Representative images and immunofluorescence analysis of iNOS expression in ankle joint samples with different treatments (white arrows indicate iNOS-labeled M1-type macrophages, scale bar = 100 μm). (B-G) Levels of glycolysis indicators (SA, CA, LDHA, HKII, G6PD, ATP, and glucose consumption) in serum from CIA rats. (H) WB images and (I-M) relative protein expression of iNOS, Arg1, LDHA, PKM2, and HKII. Data were expressed as mean ± SD (n = 3, *p < 0.05 and ****p < 0.0001 vs. the Control group, #p < 0.05, ##p < 0.01, ###p < 0.001 and ####p < 0.0001 vs. the CIA group, &p < 0.05, &&p < 0.01, &&&p < 0.001,and &&&&p < 0.0001 vs. the ADSCs-EXO group, +p < 0.05, ++p < 0.01, +++p < 0.001, and ++++p < 0.0001 vs. the ICA group, •••• p < 0.0001 vs. the ADSCs-EXO-ICA200 group, Δp < 0.05, ΔΔp < 0.01 and ΔΔΔΔp < 0.0001 vs. the ADSCs-EXO-ICA200 group, ns = no significance)
Fig. 10
Fig. 10
ADSCs-EXO-ICA200 reduces macrophage polarization towards the M1-type by inhibiting the ERK1/2/HIF-1α/GLUT1 pathway-mediated macrophage glycolysis. (A) Western blot (WB) images showing the expression of GLUT1, HIF-1α, ERK1/2, and p-ERK1/2 proteins. (B-I) Relative protein expression levels of GLUT1, HIF-1α, ERK1/2, and p-ERK1/2. Data were expressed as mean ± SD (n = 3, ****p < 0.0001 vs. the Control group, #p < 0.05, ##p < 0.01, ###p < 0.001 and ####p < 0.0001 vs. the CIA group, &p < 0.05, &&p < 0.01, &&&p < 0.001,and &&&&p < 0.0001 vs. the ADSCs-EXO group, ++++p < 0.0001 vs. the ICA group, ••• p < 0.001 and •••• p < 0.0001 vs. the ADSCs-EXO-ICA200 group, ΔΔp < 0.01 and ΔΔΔp < 0.001 vs. the ADSCs-EXO-ICA200 group, ns = no significance)
Fig. 11
Fig. 11
(A-B) H&E staining of liver and kidney across different groups (scale bar = 100 μm). (C-E) Biochemical indicators of liver and kidney function across different groups. Data were expressed as mean ± SD (n = 3, ****p < 0.0001 vs. the Control group, ##p < 0.01 and ####p < 0.0001 vs. the CIA group, &p < 0.05 and &&&&p < 0.0001 vs. the ADSCs-EXO group, +p < 0.05 and ++++p < 0.0001 vs. the ICA group, •p < 0.05 vs. the ADSCs-EXO-ICA200 group, ns = no significance)

References

    1. Smolen JS, Aletaha D, McInnes IB. Lancet. 2016;388:2023–38. doi: 10.1016/S0140-6736(16)30173-8. - DOI - PubMed
    1. Boutet MA, Courties G, Nerviani A, Le Goff B, Apparailly F, Pitzalis C. F. Blanchard Autoimmun Rev 2021,20,102758. - PubMed
    1. Komatsu N. H Takayanagi Nat Rev Rheumatol. 2022;18:415–29. doi: 10.1038/s41584-022-00793-5. - DOI - PubMed
    1. Tu J, Huang W, Zhang W, Mei J, Zhu C. Front Immunol. 2021;12:655477. doi: 10.3389/fimmu.2021.655477. - DOI - PMC - PubMed
    1. Takeuchi T, Yoshida H. S Tanaka Autoimmun Rev. 2021;20:102884. doi: 10.1016/j.autrev.2021.102884. - DOI - PubMed

LinkOut - more resources