. 2024 Jul 18;24(1):95.
doi: 10.1186/s40644-024-00736-1.

Deformation-based morphometry: a sensitive imaging approach to detect radiation-induced brain injury?

Affiliations

Deformation-based morphometry: a sensitive imaging approach to detect radiation-induced brain injury?

Carole Brunaud et al. Cancer Imaging. .

Abstract

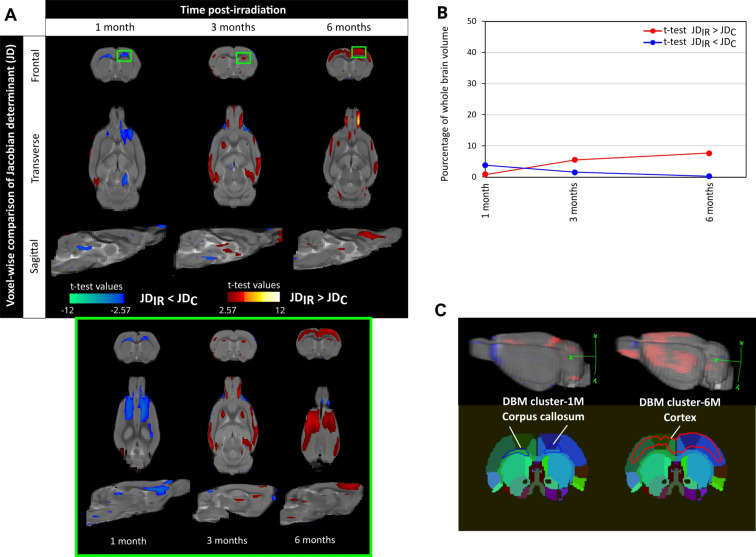
Background: Radiotherapy is a major therapeutic approach in patients with brain tumors. However, it leads to cognitive impairments. To improve the management of radiation-induced brain sequalae, deformation-based morphometry (DBM) could be relevant. Here, we analyzed the significance of DBM using Jacobian determinants (JD) obtained by non-linear registration of MRI images to detect local vulnerability of healthy cerebral tissue in an animal model of brain irradiation.

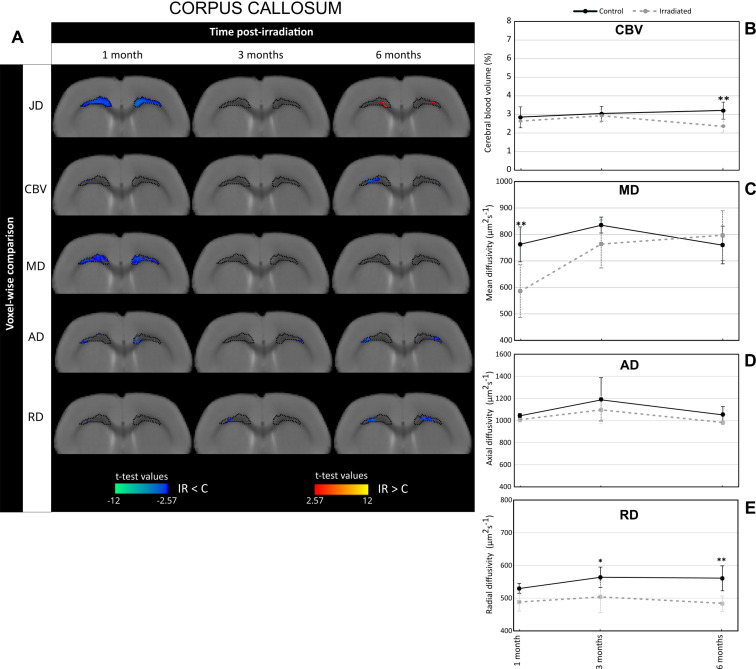
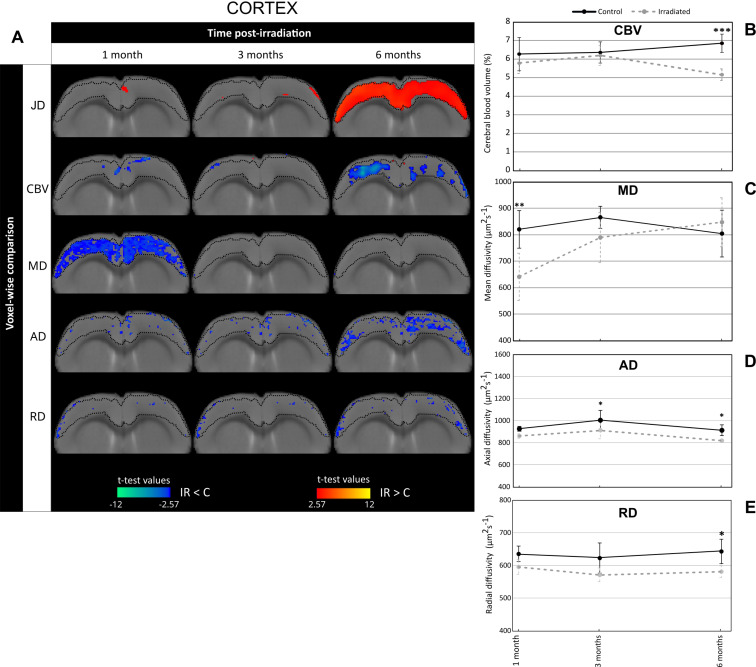
Methods: Rats were exposed to fractionated whole-brain irradiation (WBI, 30 Gy). A multiparametric MRI (anatomical, diffusion and vascular) study was conducted longitudinally from 1 month up to 6 months after WBI. From the registration of MRI images, macroscopic changes were analyzed by DBM and microscopic changes at the cellular and vascular levels were evaluated by quantification of cerebral blood volume (CBV) and diffusion metrics including mean diffusivity (MD). Voxel-wise comparisons were performed on the entire brain and in specific brain areas identified by DBM. Immunohistology analyses were undertaken to visualize the vessels and astrocytes.

Results: DBM analysis evidenced time-course of local macrostructural changes; some of which were transient and some were long lasting after WBI. DBM revealed two vulnerable brain areas, namely the corpus callosum and the cortex. DBM changes were spatially associated to microstructural alterations as revealed by both diffusion metrics and CBV changes, and confirmed by immunohistology analyses. Finally, matrix correlations demonstrated correlations between JD/MD in the early phase after WBI and JD/CBV in the late phase both in the corpus callosum and the cortex.

Conclusions: Brain irradiation induces local macrostructural changes detected by DBM which could be relevant to identify brain structures prone to radiation-induced tissue changes. The translation of these data in patients could represent an added value in imaging studies on brain radiotoxicity.

Keywords: Brain; Deformation-based morphometry; Macrostructural changes; Magnetic resonance imaging; Radiotherapy.


Conflict of interest statement

The authors declare no competing interests.

Figures

Fig. 1
Fig. 1
Deformation-based morphometry reveals local macrostructural changes over time induced by brain irradiation in cerebral structures. (A) Voxel-wise comparison of Jacobian determinant (JD) between control and irradiated groups (noted C and IR respectively) at 1, 3 and 6 months after irradiation (Student’s t-test with significant threshold set at p < 0.01). The JD was quantified from T2w images that were registered on a rat brain template performed on control rats at the specific post-irradiation time studied. The statistically different voxels are located on the rat brain template (T2w image). The blue clusters correspond to significant t-test when JD values of irradiated group are lower than those of the control group. The red clusters correspond to significant t-test when JD values of irradiated group are higher than those of the control group. The green box depicts a zoom of the clusters at 1, 3 and 6 months after irradiation. (B) Longitudinal quantification of proportion of significant voxels relative to the whole brain volume. Blue line represents the blue clusters (significant t-test for JD irradiated < JD control) and red line corresponds to red clusters (significant t-test for JD irradiated > JD control). (C) From deformation-based morphometry (DBM), the significant large clusters identified at 1 month (DBM-1 M in blue) and 6 months (DBM-6 M in red) after irradiation were registered on a rat brain atlas to identify the most vulnerable brain areas. The cluster DBM-1 M is located in the corpus callosum and the cluster DBM-6 M is located in the cortex. The number of animals for the control group is N = 6–9 rats and for the irradiated group is N = 6–7 rats
Fig. 2
Fig. 2
Irradiation induces changes in cerebral blood volume and MRI-derived diffusion parameters in the corpus callosum. (A) Voxel-wise comparison of Jacobian determinant (JD), cerebral blood volume (CBV), mean diffusivity (MD), axial diffusivity (AD) and radial diffusivity (RD) in the corpus callosum between control and irradiated groups (noted C and IR respectively) at different times after whole-brain irradiation (Student’s t-test with significant threshold set at p < 0.01). The macrostructural changes highlighted by DBM in the corpus callosum at 1 month post-irradiation are demarcated on the T2w images by dotted lines. The statistically different voxels are located on the rat brain template (T2w image). The blue clusters correspond to significant t-test when MRI parameter values of irradiated group are lower than those of the control group. The red clusters correspond to significant t-test when MRI parameter values of irradiated group are higher than those of the control group. (B-E) Quantification of CBV (B), MD (C), AD (D) and RD (E) in the corpus callosum at 1, 3 and 6 months after whole-brain irradiation. Black line corresponds to the control group and gray line to the irradiated group. The number of animals for the control group is N = 6 rats and for the irradiated group is N = 4–6 rats. Mean ± SD, two-way ANOVA (group and time effects) followed by Fisher’s LSD test: * p < 0.05, ** p < 0.01
Fig. 3
Fig. 3
Irradiation induces changes in cerebral blood volume and diffusion MRI-derived parameters in the cortex. (A) Voxel-wise comparison of Jacobian determinant (JD), cerebral blood volume (CBV), mean diffusivity (MD), axial diffusivity (AD) and radial diffusivity (RD) in the cortex between control and irradiated groups (noted C and IR respectively) at different times after whole-brain irradiation (Student’s t-test with significant threshold set at p < 0.01). The macrostructural changes highlighted by DBM in the cortex at 6 months post-irradiation are demarcated on the T2w images by dotted lines. The statistically different voxels are located on the rat brain template (T2w image). The blue clusters correspond to significant t-test when MRI parameter values of irradiated group are lower than those of the control group. The red clusters correspond to significant t-test when MRI parameter values of irradiated group are higher than those of the control group. (B-E) Quantification of CBV (B), MD (C), AD (D) and RD (E) in the cortex at 1, 3 and 6 months after whole-brain irradiation. Black line corresponds to the control group and gray line to the irradiated group. The number of animals for the control group is N = 6 rats and for the irradiated group is N = 4–6 rats. Mean ± SD, two-way ANOVA (group and time effects) followed by Fisher’s LSD test: * p < 0.05, *** p < 0.001
Fig. 4
Fig. 4
Correlations between MRI parameters in the brain structures identified by DBM: corpus callosum and cortex. (A-B) Correlation matrix by confounding both the time studied and the control and irradiated animals in the corpus callosum (A) and cortex (B). (C) Correlation matrix in the corpus callosum by focusing on Jacobian determinant measured at 1 month post-irradiation as a reference point. This specific time point was chosen for the correlation analyses due to the significant blue clusters identified in the DBM analysis that was found to be major in the corpus callosum. (D) Correlation matrix in the cortex by focusing on Jacobian determinant measured at 6 months post-brain irradiation as a reference point. This specific time point was chosen for the correlation analyses due to the significant red clusters identified in the DBM analysis that was found to be major in the cortex. For all correlation matrices, the coloured squares correspond to the Pearson’s correlation coefficient (r value) and the gray squares indicate a significant p-value. The correlations are performed between the MRI parameters studied: Jacobian determinant (JD), mean diffusivity (MD), axial diffusivity (AD), radial diffusivity (RD)

References

    1. Makale MT, McDonald CR, Hattangadi-Gluth J, Kesari S. Brain irradiation and long-term cognitive disability: current concepts. Nat Rev Neurol. 2017;13(1):52–64. doi: 10.1038/nrneurol.2016.185. - DOI - PMC - PubMed
    1. Yao S, Zuo H, Li W, Cai Y, Zhang Q, Pang L, et al. The correlations between psychological distress, cognitive impairment and quality of life in patients with brain metastases after whole-brain radiotherapy. Clin Transl Oncol. 2023;25(1):207–17. doi: 10.1007/s12094-022-02927-3. - DOI - PubMed
    1. Di Perri D, Jmil S, Lawson TM, Van Calster L, Whenham N, Renard L. Health-related quality of life and cognitive failures in patients with lower-grade gliomas treated with radiotherapy. Cancer/Radiothérapie. 2023;27(3):219–24. doi: 10.1016/j.canrad.2022.10.004. - DOI - PubMed
    1. Pazzaglia S, Briganti G, Mancuso M, Saran A. Neurocognitive decline following Radiotherapy: mechanisms and therapeutic implications. Cancers. 2020;12(1):146. doi: 10.3390/cancers12010146. - DOI - PMC - PubMed
    1. Yang L, Yang J, Li G, Li Y, Wu R, Cheng J, et al. Pathophysiological responses in rat and mouse models of Radiation-Induced Brain Injury. Mol Neurobiol. 2017;54(2):1022–32. doi: 10.1007/s12035-015-9628-x. - DOI - PMC - PubMed

MeSH terms

LinkOut - more resources