. 2024 Apr 11;15(7):2286-2299.
doi: 10.1039/d4md00057a. eCollection 2024 Jul 17.

Synthesis, biological evaluation and metadynamics simulations of novel N-methyl β-sheet breaker peptides as inhibitors of Alzheimer's β-amyloid fibrillogenesis

Affiliations

Synthesis, biological evaluation and metadynamics simulations of novel N-methyl β-sheet breaker peptides as inhibitors of Alzheimer's β-amyloid fibrillogenesis

Federica Moraca et al. RSC Med Chem. .

Abstract

Several scientific evidences report that a central role in the pathogenesis of Alzheimer's disease is played by the deposition of insoluble aggregates of β-amyloid proteins in the brain. Because Aβ is self-assembling, one possible design strategy is to inhibit the aggregation of Aβ peptides using short peptide fragments homologous to the full-length wild-type Aβ protein. In the past years, several studies have reported on the synthesis of some short synthetic peptides called β-sheet breaker peptides (BSBPs). Herein, we present the synthesis of novel (cell-permeable) N-methyl BSBPs, designed based on literature information on the structural key features of BSBPs. Three-dimensional GRID-based pharmacophore peptide screening combined with PT-WTE metadynamics was performed to support the results of the design and microwave-assisted synthesis of peptides 2 and 3 prepared and analyzed for their fibrillogenesis inhibition activity and cytotoxicity. An HR-MS-based cell metabolomic approach highlighted their cell permeability properties.


Conflict of interest statement

There are no conflicts to declare.

Figures
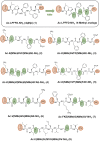
Fig. 1
Fig. 1. Two-dimensional structures of parent BSBP iAβ5p (1) and the designed peptides library (2–8). NMe in round brackets highlight N-methylated residues. N-Terminal and C-terminal end-protection groups are highlighted with orange circles, while N-methyl groups are displayed with green circles.
Fig. 2
Fig. 2. In situ real-time ThT fluorescence assays of Aβ alone (black symbols) and upon incubation with BSBP peptides (ten-fold molar excess). In all the cases, the reported data is derived from three independent experiments.
Fig. 3
Fig. 3. Cell viability is expressed as the percentage of mitochondrial redox activity of the cells treated with the three peptides (A for peptide 1, B for peptide 2, and C for peptide 3) compared to the untreated control. The values are the mean ± SD of six measurements, carried out in three independent experiments.
Fig. 4
Fig. 4. (A) Total ion current chromatograms of pure peptides 2 and 3; (B) XIC (extracted ion chromatogram) of the protonated molecular ions at m/z 705.39 (peptide 2) and at m/z 852.46 (peptide 3); (B.i) representative images of peptide 2-treated cells; (B.ii) representative images of peptide 3-treated cells; (C) TOF-MS and TOF-MS/MS spectra of peptides 2 and 3 detected in cell pellets (in line with those of pure peptides in Fig. S2 and S3, ESI†).
Fig. 5
Fig. 5. Cell viability inhibition of SH-SY5Y cells, pre-treated for 24 hours with Aβ25–35 at 100 μM concentration level (B) and then exposed to peptides 1–3 (C–E). The percentage of the inhibition of mitochondrial redox activity (RAI, %) of the cells was in reference to the control cells, which did not undergo any treatment. Negative values are in line with no inhibition occurrence. The values are the mean ± SD of six measurements, carried out in three independent experiments. Representative images of cells acquired by the inverted phase contrast bright field Zeiss Primovert microscope are reported. (A) Untreated control cells and other relative RAI graph (B) Aβ25–35-treated cells; (C) Aβ25–35 and peptide 1 treated cells; (D) Aβ25–35 and peptide 2 treated cells; (E) Aβ25–35 and peptide 3 treated cells.
Fig. 6
Fig. 6. Pharmacophore pseudomolecules generated by FLAPpharm from the training set alignment. (A) Model1 (S-score: 0.667) extracted as common pharmacophoric interaction fields (PIFs) and common pharmacophoric pseudofields (pseudoPIFs). (B) Model2 (S-score: 0.517) extracted as common pharmacophoric interaction fields (PIFs) and common pharmacophoric pseudofields (pseudoPIFs). Hydrophobic fields (DRY) are displayed in yellow, hydrogen bond donor fields (N1) are shown in blue, hydrogen-bond acceptor fields (O) are represented in red, while the shape (H) probe is shown as a white solid transparent surface area.
Fig. 7
Fig. 7. The reweighted FES of iAβ5p obtained after 150 ns of PT-WTE simulation as a function of Rgyr and H-bond CVs. (A) The most representative conformation of iAβ5p extracted from the energetic minimum A, characterized by a β-sheet-like arrangement. (B) The most representative conformation of iAβ5p extracted from the higher energetic minimum B, characterized by β-turn arrangement, with two intramolecular H-bonds displayed as yellow dashed lines. (C) Superposition between the conformation of iAβ5p extracted from the energetic minimum A (blue sticks) and the conformation found by FLAPpharm to build Model2 (wheat sticks) (RMSD: 0.86 Å). Explicit hydrogen atoms are not displayed for clarity reasons.
Fig. 8
Fig. 8. The reweighted FES of (A) peptide 2 (orange sticks) and (B) peptide 3 (light-green sticks) obtained after 150 ns of PT-WTE simulation as a function of Rgyr and H-bond CVs. Hydrogen bond interactions are displayed as yellow dashed lines. Explicit hydrogen atoms are not displayed for clarity reasons.

References

    1. Baig M. H. Ahmad K. Rabbani G. Choi I. Front. Aging Neurosci. 2018;10:21. doi: 10.3389/fnagi.2018.00021. doi: 10.3389/fnagi.2018.00021. - DOI - DOI - PMC - PubMed
    1. Iizuka T. Shoji M. Kawarabayashi T. Sato M. Kobayashi T. Tada N. Kasai K. Matsubara E. Watanabe M. Tomidokoro Y. Hirai S. Biochem. Biophys. Res. Commun. 1996;218:238–242. doi: 10.1006/bbrc.1996.0042. doi: 10.1006/bbrc.1996.0042. - DOI - DOI - PubMed
    1. Volloch V. Rits S. Med. Sci. 2018;6:45. doi: 10.3390/medsci6020045. - DOI - PMC - PubMed
    1. Acosta D. M. Á. V. Vega B. C. Basurto J. C. Morales L. G. F. Hernández M. C. R. Int. J. Mol. Sci. 2018;19:2415. doi: 10.3390/ijms19082415. doi: 10.3390/ijms19082415. - DOI - DOI - PMC - PubMed
    1. Aleksis R. Oleskovs F. Jaudzems K. Pahnke J. Biverstål H. Biochimie. 2017;140:176–192. doi: 10.1016/j.biochi.2017.07.011. doi: 10.1016/j.biochi.2017.07.011. - DOI - DOI - PubMed

LinkOut - more resources