[Preprint]. 2025 Feb 18:2024.07.11.603140.
doi: 10.1101/2024.07.11.603140.

Antagonistic Roles for MITF and TFE3 in Melanoma Plasticity

Affiliations

Antagonistic Roles for MITF and TFE3 in Melanoma Plasticity

Jeremy Chang et al. bioRxiv. .

Update in

  • Antagonistic roles for MITF and TFE3 in melanoma plasticity.
    Chang J, Campbell-Hanson KR, Vanneste M, Bartschat NI, Nagel R, Arnadottir AK, Vu HN, Montgomery C, Yevdash J, Jiang J, Bhinu A, Helverson A, Henry MD, Steingrímsson E, Weigel RJ, Cornell RA, Kenny C. Chang J, et al. Cell Rep. 2025 Apr 22;44(4):115474. doi: 10.1016/j.celrep.2025.115474. Epub 2025 Mar 25. Cell Rep. 2025. PMID: 40138313 Free PMC article.

Abstract

Melanoma cells have the ability to switch from a melanocytic and proliferative state to a mesenchymal and invasive state and back again. This plasticity drives intra-tumoral heterogeneity, progression, and therapeutic resistance. Microphthalmia-associated Transcription Factor (MITF) promotes the melanocytic/proliferative phenotype, but factors that drive the mesenchymal/invasive phenotype and the mechanisms that effect the switch between cell states are unclear. Here, we identify the MITF paralog TFE3 and the non-canonical mTORC1 pathway as regulators of the mesenchymal state. We show that TFE3 expression drives the metastatic phenotype in melanoma cell lines and tumors. Deletion of TFE3 in MITF-low melanoma cell lines suppresses their ability to migrate and metastasize. Further, MITF suppresses the mesenchymal phenotype by directly or indirectly activating expression of FNIP1, FNIP2, and FLCN, which encode components of the non-canonical mTORC1 pathway, thereby promoting cytoplasmic retention and lysosome-mediated degradation of TFE3. These findings highlight a molecular pathway controlling melanoma plasticity and invasiveness.

Keywords: MITF; Melanoma; TFE3; cell plasticity; mTORC1; metastasis; phenotype-switching; protein stability.


Conflict of interest statement

Declaration of Interests: All authors declare no competing interests.

Figures
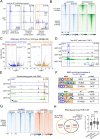
Figure 1:
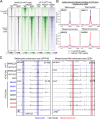
Figure 1:. MITF inhibits TFE3 occupancy at thousands of genomic loci in SKMEL28 cell lines.
(A) Screenshot of IGV genome browser (GRCH37/hg19) visualization of bigwig files generated from anti-MITF CUT&RUN sequencing in MITF-wild-type (WT) or MITF-KO (D6) cells. Three groups of anti-MITF peaks (true MITF, persistent-paralog, and gained paralog) were identified based on the presence or absence of an anti-MITF peak in MITF-KO cells. The number of each peak type is indicated. Peaks were called using MACS2 software with FDR <0.05, with IgG serving as background control. (B) Density heatmap of true MITF peaks (upper panels) and gained-paralog peaks (lower panels), showing anti-MITF (blue) and anti-H3K27Ac (green) CUT&RUN signal in MITF-WT and MITF-KO cells, with peaks sorted on anti-MITF-signal in MITF-WT cells. (C) Volcano plot showing 2,144 differentially expressed genes (DEGs) with an adjusted p-value < 0.05 in D6 versus EV-SKMEL28 cells. RNA-Seq data was re-analyzed from Dilshat et al (2021) , and DEGs were overlapped with genes flanked by true MITF peaks and gained paralog peaks. Peaks were assigned to genes based on proximity (±100 kb from the gene’s transcription start site [TSS]). A hypergeometric analysis was performed to determine the association of true MITF peaks and gained paralog peaks with DEGs. p-values are labeled, and significant associations are indicated in red text. (D-E) Screenshots of IGV browser illustrating (D) a true MITF peak near TYRP1, and (E) a gained-paralog peak near ZEB1. Additional tracks include ATAC-Seq (black), and anti-H3K27Ac CUT&RUN (green) in MITF-WT and MITF-KO cells. (F) Enrichment of transcription-factor motifs at true MITF peaks (upper panel) and at gained-paralog peaks (lower panel), as assessed using HOMER . (G) Density heatmap of anti-MITF CUT&RUN-seq in MITF-WT and MITF-KO cells (both D6 and D2 lines), and of anti-TFE3 CUT&RUN-seq in MITF-KO and double MITF/TFE3-KO cells (D2/TFE3-KO), at gained-paralog peaks. (H) Venn diagram illustrating the overlap of genes that are upregulated in MITF-KO (D2) vs MITF-WT cells (depicted by the orange circle), and the genes that are downregulated in double TFE3/MITF-KO (D2/TFE3-KO) vs. MITF-KO (D2) cells (depicted by the black circle). Gene numbers in red parenthesis illustrate TFE3 occupied genes (peak within 100kb of a genes TSS) in MITF-KO cells. Box-plot visualization of Log normalized counts of the overlapping genes (n=632). Student’s t-test; ****p-value <0.0001.
Figure 2:
Figure 2:. Gained TFE3 peaks in MITF-KO cells overlap with active enhancers in A375 and patient-derived “mesenchymal-like” cell lines, distinguishing them from true MITF bound “melanocytic” enhancers.
(A) Density heatmap depicting ATAC-Seq (black) and anti-H3K27Ac (green) CUT&RUN-seq in MITF-WT and MITF-KO SKMEL28 cells, alongside ATAC-Seq (black), anti-H3K27Ac (green), and H3K9Ac (purple) CUT&RUN-seq in A375 cells. The density heatmap is ordered by true MITF peaks (upper panel) and gained-TFE3 peaks (lower panel), as identified in MITF-WT and MITF-KO SKMEL28 cells, respectively. (B) Summary plots illustrating normalized ATAC-Seq read counts at true MITF (blue line) and gained-TFE3 peaks (red line) for “melanocytic” (MM001), “intermediate” (MM074), and two “mesenchymal-like” (MM029, MM099) human patient-derived melanoma cell lines . (C) Screenshot of IGV genome browser (GRCH37/hg19) visualization of enhancers activated by true MITFs (blue highlight) near the melanocytic gene GPR143, and enhancers activated by gained TFE3-peaks (red highlight) near the EMT gene ZEB1. Bigwig files of anti-MITF CUT&RUN-seq and ATAC-Seq from MITF-WT and MITF-KO SKMEL28 cells, as well as ATAC-Seq traces from melanocytic (blue), intermediate (black), and mesenchymal-like (red) melanoma cells are shown.
Figure 3:
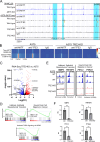
Figure 3:. TFE3 establishes a mesenchymal-like transcriptional profile in A375 cell lines.
(A) Screenshot of IGV genome browser (GRCH37/hg19) visualization of bigwig files generated from anti-MITF CUT&RUN sequencing in MITF-WT and MITF-KO (D6) SKMEL28 cells, as well as anti-MITF, anti-TFE3, and IgG CUT&RUN sequencing in TFE3-WT or TFE3-KO A375 cells. Gained paralog peaks in MITF-KO cells near the ZEB1 gene are highlighted in blue, and TFE3 occupancy at gained paralog peaks in A375 cells are indicated by yellow asterisks. (B) Density heatmap illustrating anti-MITF, anti-TFE3, and IgG CUT&RUN bigwig signals in TFE3-WT or TFE3-KO A375 cells, at genomic regions bound by true MITF peaks in MITF-WT, and at gained-TFE3 peaks in MITF-KO SKMEL28 cells cell lines. (C) Volcano plot showing differentially expressed genes (DEGs) with qval <0.05; among these DEGs, 3344 were downregulated (blue) and 3206 upregulated (red) log2-fold change (log2FC) ≥ |1| in TFE3-KO vs. TFE3-WT A375 cells. (D) Enrichment scores for gene ontology (GO) terms and pathways based on gene set enrichment analysis (GSEA) of TFE3-KO and TFE3-WT A375 cell lines. The enrichment score is indicated by green lines, the number of genes by vertical black lines, and changes in gene expression (positive or negative) by the red to blue heatmap (high to low). (E) Screenshot of IGV genome browser (GRCH37/hg19) visualization of bigwig files generated from anti-MITF and anti-TFE3 CUT&RUN sequencing in TFE3-WT (blue) and TFE3-KO (orange) A375 cells, near the indicated TFE3-activated genes associated with the epithelial to mesenchymal transition (EMT) and neural crest-cell migration in cancer. (F) qPCR validation of RNA-Seq data shown in (C). Bar chart representing the relative expression levels of genes identified as directly TFE3-dependent in TFE3-WT and TFE3-KO A375 cells. Control (Ctrl) samples were transfected with non-targeting gRNAs and CRISPR/Cas9 protein complex, while TFE3-KO samples represent bulk CRISPR/Cas9-mediated knockout of TFE3 in A375 cells. Error bars indicate the standard deviation of triplicate experiments. Statistical significance was determined using Student’s t-test: *p < 0.05; **p < 0.01.
Figure 4:
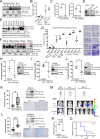
Figure 4:. TFE3 accelerates cell invasion and distant lung colonization in MITF-low melanoma cell lines and patient derived xenografts.
(A) Immunoblotting for anti-TFE3, of cytoplasmic (C) and nuclear (N) fractions of lysates from MITF-high SKMEL24 cells, MITF-low RPMI-7951 and A375 cells. anti-LAMIN A/C and anti-GAPDH served as loading controls for the nuclear and cytoplasmic fractions, respectively. The ~82 kDa band represents the full-length TFE3 and the ~72 kDa band represents the short-length TFE3. (B) Scatterplot comparing invasive capacity of SKMEL28, SKMEL24, A375 and RPMI-7951cells through Matrigel coated Boydan chambers over 24 hours. Individual dots represent biological experiments with three technical replicates. Statistical analysis was performed using the Student’s t-test. **P-value <0.01, ***P-value <0.001. (C) Scatterplot comparing the invasive capacity of A375 and RPMI-7951 cell lines following bulk CRISPR/Cas9-mediated TFE3 knockdown (TFE3-KD) or scrambled control (Ctrl), at 24 hours. Individual dots represent biological experiments (n=3) with three technical replicates. Statistical analysis was performed using the Student’s t-test. **P-value <0.01. (D) Immunoblotting of anti-TFE3 in A375 and RPMI-7951 cell lines following bulk CRISPR/Cas9-mediated TFE3 knockdown (TFE3-KD) or scrambled control (Ctrl). Anti-GAPDH served as loading control. (E) Immunoblotting of anti-TFE3 and anti-MITF of protein lysates from patient-derived xenograft (PDX) cell lines as labeled, dashed red boxes indicate full-length TFE3. Anti-GAPDH served as loading control. (F) Immunoblotting of anti-TFE3 from protein lysates of cytoplasmic and nuclear fractions of TFE3-low PDX cell lines (PDX10, PDX15) and of TFE3-high PDX cell lines (PDX16, PDX34 and PDX31). anti-LAMIN A/C and anti-GAPDH served as loading controls for the nuclear and cytoplasmic fractions, respectively. Dashed red boxes indicate full-length TFE3 in nuclear cell fractions. (G) Scatterplot comparing invasive capacity of MITF-high and MITF-low PDX cell lines through Matrigel coated Boyden chambers over 24 hours, as labeled. Individual dots represent biological experiments (n=4) with four technical replicates. Statistical analysis was performed using the Student’s t-test. **P-value <0.01, ***P-value <0.001. Representative images of invaded PDX cell lines labeled with crystal violet are shown. (H-J) Invasive capacity of (H) PDX16, (I) PDX28 and (J) PDX34, following CRISPR/Cas9-mediated TFE3 knockdown. Control (Ctrl) samples include non-targeting gRNA. Immunoblotting confirms TFE3 knockdown for each cell line. (K-L) Boxplot comparing invasive capacity of (K) PDX10 and (L) SKMEL28 following overexpression of MYC-tagged TFE3 compared to empty vector control (Ctrl). Individual dots represent biological experiments with four technical replicates. Statistical analysis was performed using the Student’s t-test. *P-value <0.05; ****P-value <0.0001. Immunoblotting of anti-TFE3 confirms TFE3 OE for each cell line tested. Representative images of invaded PDX10 and SKMEL28 cell lines labeled with crystal violet as shown. (M) Design of lung colonization assay by cells injected via tail vein, with tumor size measured via photon flux (radiance). (N) Scatterplot quantitation of size of metastasis in animals shown in (M) at 5 weeks post inoculation. Individual dots represent biological replicates. Statistical analysis using the Student’s t-test. **** P-value <0.0001. (O) Kaplan Meier curve of metastasis-free survival. Statistical analysis using Log-Rank Test.
Figure 5:
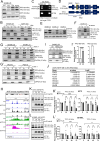
Figure 5:. MITF regulates the stability and nuclear localization of full length TFE3 protein by directly activating FNIP2-mediated non-canonical mTORC1 signaling.
(A) Immunoblotting of anti-TFE3 and anti-MITF in lysates from MITF-WT and MITF-KO (D2 and D6) SKMEL28 cells, and A375 cells. anti-GAPDH served as a loading control. The ~82 kDa band represents the full-length TFE3 and the ~72 kDa band represents the short-length TFE3. (B) RT-PCR-based visualization of distinct (full-length and short-length) TFE3 transcripts in MITF-WT and MITF-KO (D2) SKMEL28 cells. Primers targeting actin mRNA were used as a control to ensure equal RNA input and efficient cDNA synthesis across samples. (C) Schematic of the full-length and short-length TFE3 transcripts. Indicated are the exons and 5’UTRs, as well as the degron sequence in exon 2 that is unique to the full-length transcript (yellow bar). The TFE3 variants share the same transcriptional start site but have different ribosome entry sites, producing distinct protein products of 72 kDa and 82 kDa. (D) Immunoblotting for anti-TFE3, of cytoplasmic (C) and nuclear (N) fractions from lysates of MITF-WT and MITF-KO (D2) SKMEL28 cells incubated with +/− fetal calf serum (FBS) for 24 hours. LAMIN A/C and GAPDH served as loading controls for the nuclear and cytoplasmic fractions, respectively. (E) Immunoblotting for anti-TFE3, in total protein from lysates of SKMEL28, SKMEL24, and SKMEL3 cell lines, −/+ 3 μM MLN4924 for 24 hours. GAPDH served as a loading control. (F) Immunoblotting for TFE3, of cytoplasmic and nuclear fractions of lysates from MITF-WT SKMEL28 cells following treatment with −/+ 3 μM MLN4924 for 24 hours. LAMIN A/B and GAPDH served as loading controls for nuclear and cytoplasmic fractions, respectively. (G-G’) Immunoblotting for anti-TFE3, in cytoplasmic and nuclear fractions of lysates from (G) SKMEL28 and SKMEL24 cells, and (G’) PDX10 and PDX15 cells, following treatment with Torin 1 (1 uM) for 24 hours. LAMIN A/C and GAPDH served as loading controls for the nuclear and cytoplasmic fractions, respectively. (H) Screenshot of IGV genome browser (GRCH37/hg19) visualization of bigwig files generated from anti-MITF, anti-H3K27Ac, and anti-H3K4Me3 CUT&RUN-seq and ATAC-seq, at the FNIP2 locus in MITF-WT or MITF-KO (D6) SKMEL28 cells. (I-I’) Immunoblotting for anti-TFE3, in cytoplasmic and nuclear fractions of lysates from SKMEL28 following CRISPR/Cas9-mediated knockout of FNIP1 and FNIP2. anti-LAMIN A/C and anti-GAPDH served as loading controls for the nuclear and cytoplasmic fractions, respectively. (I’) Histogram showing densitometric analysis of full-length and short-length nuclear TFE3 signals, described in (I), quantified using ImageJ. Data represent three independent biological experiments, with individual dots indicating values from each experiment. (J) RNA-Seq analysis comparing A375 cells and A375 cells overexpressing MITF. Shown are genes within the mTORC1 pathway that are upregulated upon MITF overexpression, with q-values and Log2 fold change (Log2FC) indicated. RNA-Seq was analyzed from . (K-L) Immunoblotting for anti-TFE3 and anti-MITF in doxycycline-inducible (K) A375 cells and (L) 501MEL cells at 24, 48, and 72 hours following either mock treatment or doxycycline treatment at the indicated concentrations. (K’-L’) Histograms showing densitometric analysis of full-length and short-length TFE3 signals in doxycycline treated (K’) A375 and (L’) 501MEL cell lines, as described in (K) and (L), and normalized to the empty vector controls, across 72 hours. Quantification was performed using ImageJ. Data represent three independent biological experiments (n=3), with individual dots indicating values from each experiment. Statistical analysis using the Student’s t-test. * P-value <0.05; **P-value <0.01

References

    1. Torborg S.R., Li Z., Chan J.E., and Tammela T. (2022). Cellular and molecular mechanisms of plasticity in cancer. Trends Cancer 8, 735–746. 10.1016/j.trecan.2022.04.007. - DOI - PMC - PubMed
    1. Pérez-González A., Bévant K., and Blanpain C. (2023). Cancer cell plasticity during tumor progression, metastasis and response to therapy. Nat Cancer 4, 1063–1082. 10.1038/s43018-023-00595-y. - DOI - PMC - PubMed
    1. Fanelli G.N., Naccarato A.G., and Scatena C. (2020). Recent Advances in Cancer Plasticity: Cellular Mechanisms, Surveillance Strategies, and Therapeutic Optimization. Front Oncol 10, 569. 10.3389/fonc.2020.00569. - DOI - PMC - PubMed
    1. Wouters J., Kalender-Atak Z., Minnoye L., Spanier K.I., De Waegeneer M., Bravo González-Blas C., Mauduit D., Davie K., Hulselmans G., Najem A., et al. (2020). Robust gene expression programs underlie recurrent cell states and phenotype switching in melanoma. Nat Cell Biol 22, 986–998. 10.1038/s41556-020-0547-3. - DOI - PubMed
    1. Rambow F., Rogiers A., Marin-Bejar O., Aibar S., Femel J., Dewaele M., Karras P., Brown D., Chang Y.H., Debiec-Rychter M., et al. (2018). Toward Minimal Residual Disease-Directed Therapy in Melanoma. Cell 174, 843–855.e819. 10.1016/j.cell.2018.06.025. - DOI - PubMed

Publication types

LinkOut - more resources