[Preprint]. 2024 Jul 12:2024.07.09.602707.
doi: 10.1101/2024.07.09.602707.

Amino acids trigger MDC-dependent mitochondrial remodeling by altering mitochondrial function

Affiliations

Amino acids trigger MDC-dependent mitochondrial remodeling by altering mitochondrial function

Nidhi Raghuram et al. bioRxiv. .

Abstract

Cells utilize numerous pathways to maintain mitochondrial homeostasis, including a recently identified mechanism that adjusts the content of the outer mitochondrial membrane (OMM) through formation of OMM-derived multilamellar domains called mitochondrial-derived compartments, or MDCs. MDCs are triggered by perturbations in mitochondrial lipid and protein content, as well as increases in intracellular amino acids. Here, we sought to understand how amino acids trigger MDCs. We show that amino acid-activation of MDCs is dependent on the functional state of mitochondria. While amino acid excess triggers MDC formation when cells are grown on fermentable carbon sources, stimulating mitochondrial biogenesis blocks MDC formation. Moreover, amino acid elevation depletes TCA cycle metabolites in yeast, and preventing consumption of TCA cycle intermediates for amino acid catabolism suppresses MDC formation. Finally, we show that directly impairing the TCA cycle is sufficient to trigger MDC formation in the absence of amino acid stress. These results demonstrate that amino acids stimulate MDC formation by perturbing mitochondrial metabolism.


Figures
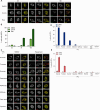
Figure 1.
Figure 1.. Cellular growth and respiratory state are important for MDC Biogenesis
(A) Super-resolution images of yeast cells grown to saturation overnight and diluted in fresh media for 0h, 3h or 16h, and then treated with concA or rap for 2h. Yeast cells are expressing Tom70-GFP and Tim50-mCherry. White arrow indicates MDC. Scale bar, 2μm. (B) Quantification of (A) showing the percentage of cells with MDCs. Error bars show Standard Error of Mean (+/− SEM) for N=3 replicates with n=100 cells per replicate. (C) Super-resolution images of yeast cells grown in high amino acid media (YPA) containing different carbon sources and treated with rap as indicated. Yeast cells are expressing Tom70-GFP and Tim50-mCherry. White arrow indicates MDC. Scale bar, 2μm. (D) Quantification of rap-induced MDC formation in cells grown in high amino acid (YPA) media containing varying carbon sources as indicated. Error bars show +/− SEM for N=3 replicates with n=100 cells per replicate. (E) Quantification of concA-induced MDC formation in cells grown in high amino acid (YPA) media containing varying carbon sources as indicated. Error bars show +/− SEM for N=3 replicates with n=100 cells per replicate.
Figure 2.
Figure 2.. Genetically stimulating mitochondrial biogenesis blocks MDC formation
(A) Schematic showing glucose repression of HAP4 and further regulation of TCA cycle and electron transport chain (ETC) genes by HAP4. (B) Heat maps showing z-scores of transcripts for TCA cycle genes from RNA sequencing analysis conducted on yeast strains overexpressing HAP4. Red=upregulated, Blue=downregulated. (C) Heat maps showing z-scores of transcripts for genes in the oxidative phosphorylation pathway from RNA sequencing analysis conducted on yeast strains overexpressing HAP4. Red=upregulated, Blue=downregulated. (D) Super-resolution images of HAP4 overexpressing or empty vector (EV) control cells treated with concA or rap. Yeast cells are expressing Tom70-GFP and Tim50-mCherry. White arrow indicates MDC. Scale bar, 2μm. (E) Quantification of (D) showing the percentage of cells with MDCs. Error bars show +/− SEM for N=3 replicates with n=100 cells per replicate.
Figure 3.
Figure 3.. Elevated amino acids cause depletion of TCA cycle intermediates in yeast
(A) Schematic of cellular glucose, TCA cycle, amino acids metabolism and transamination reaction. (B) Analysis of whole cell α-kg and succinic acid metabolite levels in yeast cells grown in high amino acid media (YPA) containing glucose or glycerol and treated with concA for 2 hours as indicated. Error bars show +/− SEM for N=4 replicates. Statistical comparison shows difference to the corresponding DMSO control and difference to the corresponding glucose control. n.s., not significant, *p<0.0332, ***p<0.0002, One-way ANOVA with Šídák’s multiple comparisons test. (C) Analysis of whole cell α-kg and succinic acid metabolite levels in yeast cells grown in high amino acid media (YPA) containing glucose or glycerol and treated with rap for 2 hours as indicated. Error bars show +/− SEM for N=4 replicates. Statistical comparison shows difference to the corresponding DMSO control and difference to the corresponding glucose control. n.s., not significant, *p<0.0332, ***p<0.0002, ****<0.0001, One-way ANOVA with Šídák’s multiple comparisons test. (D) Analysis of whole cell α-kg and succinic acid metabolite levels in EV and HAP4 OE cells treated with concA for 2 hours. Error bars show +/− SEM for N=4 replicates. Statistical comparison shows difference to the corresponding DMSO control and difference to the corresponding EV control. n.s., not significant, *p<0.0332, ***p<0.0002, ****<0.0001, One-way ANOVA with Šídák’s multiple comparisons test.
Figure 4.
Figure 4.. Increasing TCA cycle activity inhibits MDC formation
(A). Schematic showing activation of the retrograde pathway and its target genes under conditions of mitochondrial dysfunction, linking the mitochondria and nucleus. (B). Heat map showing z-score of transcripts from RNA sequencing analysis conducted on WT, mks1Δ and rtg1Δ yeast strains. Red=upregulated, Blue=downregulated. Gene function indicated. (C). Analysis of whole cell α-kg and succinic acid metabolite levels in WT and mks1Δ mutant cells treated with concA for 2 hours. Error bars show +/− SEM for N=3 replicates. Statistical comparison shows difference to the corresponding DMSO control and difference to the corresponding WT control. n.s., not significant, **p<0.0021, ****<0.0001, One-way ANOVA with Šídák’s multiple comparisons test. (D). Widefield images of WT and mks1Δ mutant cells treated with concA or rap. Cells are expressing Tom70-GFP and Tim50-mCherry. White arrow indicates MDC. Images show maximum intensity projections. Scale bar, 2μm. (E). Quantification of (D) showing the percentage of cells with MDCs. Error bars show +/− SEM for N=3 replicates with n=100 cells per replicate. (F). Western blot showing time course of auxin induced Bat2-AID*-FLAG depletion in the presence or absence of OsTir1. (G). Analysis of whole cell α-kg metabolite levels in WT+OsTir1 and indicated mutant cells pretreated with auxin for 1h followed by DMSO+auxin or rap+auxin treatment for 2 hours. Error bars show +/− SEM for N=3 replicates. Statistical comparison shows difference to the corresponding DMSO control and difference to the corresponding WT control. n.s., not significant, *p<0.0332, **p<0.0021, ***p<0.0002, Two-way ANOVA with Tukey test. (H). Quantification of MDC formation in WT+OsTir1 and indicated mutant cells pretreated with auxin for 1h followed by DMSO+auxin or rap+auxin treatment for 2 hours. Error bars show +/− SEM for N=3 replicates with n=100 cells per replicate. (I). Widefield images of WT+OsTir1 and indicated mutant cells pretreated with auxin for 1h followed by DMSO+auxin or rap+auxin treatment for 2 hours. Cells are expressing Tom70-GFP and Tim50-mCherry. White arrow indicates MDC. Images show maximum intensity projections. Scale bar, 2μm.
Figure 5.
Figure 5.. Impairing the TCA cycle is sufficient to activates the MDC pathway
(A) Analysis of whole cell pyruvate and TCA cycle metabolite levels in WT and rtg1Δ mutant cells. Error bars show +/− SEM for N=4 replicates. Statistical comparison shows difference to the corresponding WT control. n.s., not significant, *p<0.0332, ****<0.0001, Two-way ANOVA with Šídák’s multiple comparisons test. (B) Widefield images of WT and rtg1Δ mutant cells. Cells are expressing Tom70-GFP and Tim50-mCherry. White arrow indicates MDC. Images show maximum intensity projections. Scale bar, 2μm. (C) Quantification of MDC formation in WT and rtg1Δ mutant cells. Error bars show +/− SEM for N=3 replicates with n=100 cells per replicate. (D) Quantification of MDC formation in EV and indicated mutant cells. Error bars show +/− SEM for N=3 replicates with n=100 cells per replicate. (E) Quantification of concA-induced MDC formation in WT and rtg1Δ mutant cells, grown in low amino acid media. Error bars show +/− SEM for N=3 replicates with n=100 cells per replicate. (F) Quantification of MDC formation in WT and rtg1Δ mutant cells, grown in low amino acid media supplemented with 2.5, 5 or 10 mg/ml leucine. Error bars show +/− SEM for N=3 replicates with n=100 cells per replicate. (G) Quantification of MDC formation in WT and rtg1Δ mutant cells, grown in high amino acid media (YPA), containing glucose or glycerol and treated with rap as indicated. Error bars show +/− SEM for N=3 replicates with n=100 cells per replicate. (H) Quantification of MDC formation in EV and indicated mutant cells. Error bars show +/− SEM for N=3 replicates with n=100 cells per replicate. (I) Quantification of MDC formation in WT and aco1Δ mutant cells. Error bars show +/− SEM for N=3 replicates with n=100 cells per replicate. (J) Described left to right. Excess intracellular amino acids(AA) caused by concA, rap or cHX trigger internalization of PM transporters through the MVB pathway. Excess AA also trigger MDC pathway activation. Excess AA create a strain on the TCA cycle by utilizing the TCA cycle metabolite α-kg to support AA catabolism and activate the MDC pathway. Directly impairing the TCA cycle by deletion of RTG1 or ACO1 activates the MDC pathway. Preventing depletion of TCA cycle by deletion of MKS1, overexpression of HAP4, growth in nonfermentable carbon source or bat1Δ Bat2-AID*-FLAG OsTir1 inhibits MDC formation even in conditions of AA stress.

References

    1. Alan L., Scorrano L., 2022. Shaping fuel utilization by mitochondria. Curr. Biol. 32, R618–R623. 10.1016/j.cub.2022.05.006 - DOI - PubMed
    1. Baker Brachmann C., Davies A., Cost G.J., Caputo E., Li J., Hieter P., Boeke J.D., 1998.Designer deletion strains derived fromSaccharomyces cerevisiae S288C: A useful set of strains and plasmids for PCR-mediated gene disruption and other applications. Yeast 14, 115–132. 10.1002/(SICI)1097-0061(19980130)14:2&lt;115::AID-YEA204&gt;3.0.CO;2-2 - DOI - PubMed
    1. Butow R.A., Avadhani N.G., 2004. Mitochondrial Signaling:The Retrograde Response. Mol. Cell 14, 1–15. 10.1016/S1097-2765(04)00179-0 - DOI - PubMed
    1. Canelas A.B., Ten Pierick A., Ras C., Seifar R.M., Van Dam J.C., Van Gulik W.M., Heijnen J.J., 2009. Quantitative Evaluation of Intracellular Metabolite Extraction Techniques for Yeast Metabolomics. Anal. Chem. 81, 7379–7389. 10.1021/ac900999t - DOI - PubMed
    1. Chandel N.S., 2014. Mitochondria as signaling organelles. BMC Biol. 12, 34. 10.1186/1741-7007-12-34 - DOI - PMC - PubMed

Publication types

LinkOut - more resources