[Preprint]. 2024 Jul 10:2024.07.09.602730.
doi: 10.1101/2024.07.09.602730.

RBM10 loss induces aberrant splicing of cytoskeletal and extracellular matrix mRNAs and promotes metastatic fitness

Affiliations

RBM10 loss induces aberrant splicing of cytoskeletal and extracellular matrix mRNAs and promotes metastatic fitness

Gnana P Krishnamoorthy et al. bioRxiv. .

Update in

Abstract

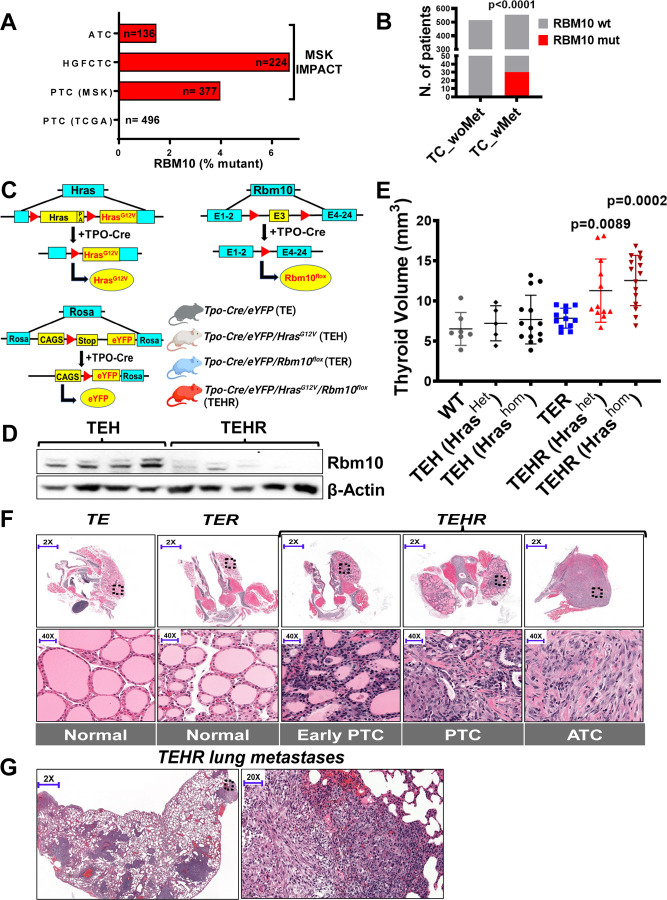
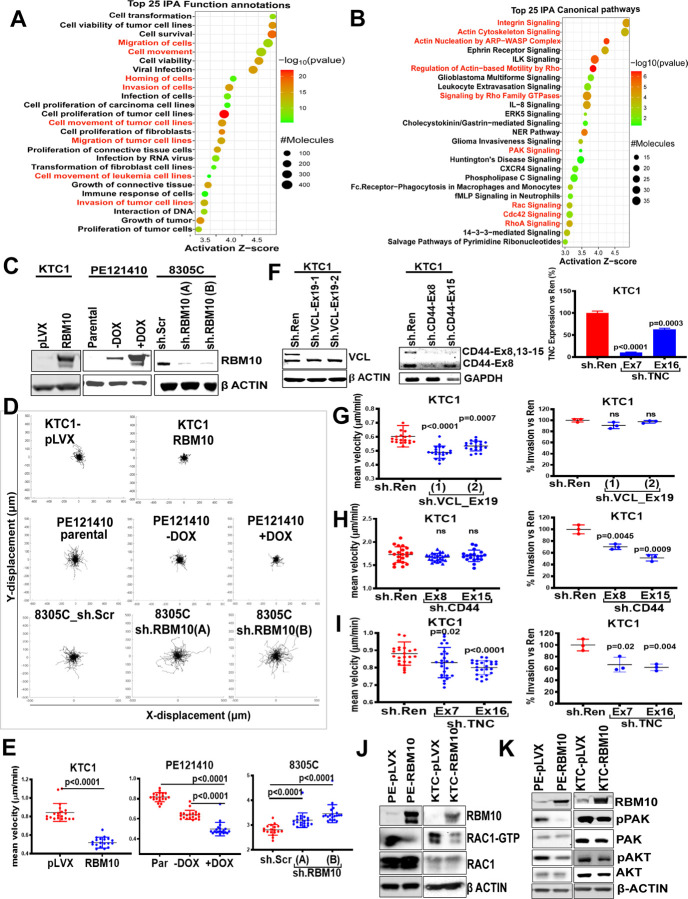
RBM10 modulates transcriptome-wide cassette exon splicing. Loss-of-function RBM10 mutations are enriched in thyroid cancers with distant metastases. Analysis of transcriptomes and genes mis-spliced by RBM10 loss showed pro-migratory and RHO/RAC signaling signatures. RBM10 loss increases cell velocity. Cytoskeletal and ECM transcripts subject to exon-inclusion events included vinculin (VCL), tenascin C (TNC) and CD44. Knockdown of the VCL exon inclusion transcript in RBM10-null cells reduced cell velocity, whereas knockdown of TNC and CD44 exon-inclusion isoforms reduced invasiveness. RAC1-GTP levels were increased in RBM10-null cells. Mouse Hras G12V /Rbm1O KO thyrocytes develop metastases that are reversed by RBM10 or by combined knockdown of VCL, CD44 and TNC inclusion isoforms. Thus, RBM10 loss generates exon inclusions in transcripts regulating ECM-cytoskeletal interactions, leading to RAC1 activation and metastatic competency. Moreover, a CRISPR-Cas9 screen for synthetic lethality with RBM10 loss identified NFkB effectors as central to viability, providing a therapeutic target for these lethal thyroid cancers.

Keywords: CD44; RBM10; TNC; cassette-exon splicing; cell migration; cytoskeletal and ECM remodeling genes; meta-vinculin; metastases; thyroid cancer.


Conflict of interest statement

J.A.F. is a co-inventor of intellectual property focused on HRAS as a biomarker for treating cancer using tipifarnib which has been licensed by MSK to Kura Oncology. J.A.F. received prior research funding from Eisai and was a former consultant for LOXO Oncology, both unrelated to the current manuscript. B.R.U. and J.A.K are co-inventors of intellectual property (HRAS as a biomarker of tipifarnib efficacy) that has been licensed by MSK to Kura Oncology. O.A.-W. has served as a consultant for H3B Biomedicine, Foundation Medicine Inc., Merck, Prelude Therapeutics, and Janssen, and is on the Scientific Advisory Board of Envisagenics Inc., AIChemy, Harmonic Discovery Inc., and Pfizer Boulder. O.A.-W. has received prior research funding from H3B Biomedicine, Nurix Therapeutics, Minovia Therapeutics, and LOXO Oncology unrelated to the current manuscript. R.K.B. is an inventor on patent applications filed by Fred Hutchinson Cancer Center related to modulating splicing for cancer therapy. R.K.B. and O.A.-W. are founders and scientific advisors of Codify Therapeutics, hold equity in this company and receive research support from this company unrelated to the current manuscript. R.K.B. is a founder and scientific advisor of Synthesize Bio and holds equity in this company. A.R.G is currently an Associate Professor of Surgery at the University of Sydney, Australia. M.S. is currently employed by Loxo Oncology.The remaining authors declare no competing interests.

Figures

Figure 1:
Figure 1:. Thyroid cancer phenotypes associated with RBM10 mutations:
(A) Frequency of RBM10 mutations in histological subtypes of thyroid cancer samples from MSK-clinical cohort (n=737) sequenced by MSK-IMPACT and PTC from TCGA (n=496). PTC: papillary thyroid cancer; HGFCTC: High grade follicular cell-derived thyroid cancer; ATC: anaplastic thyroid cancer. (B) Proportion of RBM10 mutation in non-anaplastic (PTC+HGFCTC) thyroid cancers from MSK-IMPACT and TCGA showing association of RBM10 mutation in patients with distant metastases; 2-sided Fisher’s exact t-test p<0.0001. (C) Diagram of Hras, Rbm10 and EYFP transgenes in the mouse model. In the presence of Tpo-Cre, YFP and mutant Hras are expressed and Rbm10 is inactivated in thyrocytes. (D) Western blot showing Rbm10 expression in mouse thyroid lysates from the indicated genotypes. (E) Thyroid volume measurement by ultrasound of 25-week-old mice for the indicated genotypes; p values derived by unpaired t test vs WT. (F) Low (top) and high power (bottom) magnification of H&E-stained thyroids of the indicated genotypes showing representative histology. (G) H&E-stained sections of thyroid cancer metastases to lung from a TEHR mouse; low (left) and high magnification (right).
Figure 2:
Figure 2:. RBM10 regulates AS of ECM and cytoskeletal transcripts:
(A) Western blot of RBM10 in isogenic human thyroid cancer cell lines. (B) Experimental strategy to identify molecular mechanisms of thyroid cancer growth and metastases in RBM10-deficient cells; Illustration by Biorender. (C) Average changes in aberrant splicing (AS) events in RBM10 deficient detected by high depth RNAseq in the RBM10 isogenic cell lines; SE – cassette exon inclusion isoforms; RI – retained intron; A3SS and A5SS – most intron-proximal isoform for competing 3’ or 5’ splice sites. (D) Gene ontology using ranked differentially spliced genes by GORILLA showing enrichment in pathways involved in cell adhesion and cytoskeleton reorganization. (E) Volcano plot showing differentially expressed alternative spliced isoforms detected by Partek flow RNAseq alt-splicing analysis in the combined isogenic PE121410 and KTC1 cells. Arrows point to representative isoforms of the indicated genes. Black arrows: ECM/cytoskeletal modifying transcripts. Blue arrows: known RBM10 AS genes. (F) RT-PCR showing indicated exon inclusion isoforms of VCL, CD44 and TNC in PE121410 and KTC1 cells and their decrease with RBM10 expression. Constitutive isoforms and GAPDH were used as controls. Red - cassette exon; Green - constitutive exon; Dotted arrow - primer placement. (G) Relative ratio of the indicated inclusion isoforms of VCL, CD44 and TNC determined by qRT-PCR in PE121410 and KTC1 cells −/+ RBM10. (H) Western blot of vinculin and β actin in the indicated cells. Arrow points to VCL and MVCL.
Figure 3:
Figure 3:. Impact of RBM10-induced AS of VCL, CD44 and TNC on cell motility and invasiveness:
IPA of RNAseq of RBM10-null vs RBM10-expressing PE121410 cells showing top 25 functional annotations (A) and canonical pathways (B). Highlighted in red are pathways involved in cell migration, movement, invasiveness, RHO-RAC signaling and ECM-cytoskeleton interactions. (C) Western blotting for RBM10 and β Actin in the indicated cell lines. (D) Top two rows: Representative cell trajectories by time lapse imaging of RBM10-null KTC1 and PE121410 at baseline and after dox-induction of RBM10 for 48h. Third row: Cell trajectory of 8305C cells transduced with scrambled or RBM10 shRNAs. (E) Mean cell velocity quantified by time lapse imaging for the 3 cell lines −/+ RBM10. (F) Western blot (left), RT-PCR (middle) and qRT-PCR (right) for VCL, CD44 and TNC, respectively, in KTC1 cells transduced with sh.Renilla or sh.RNAs targeting the indicated exons demonstrating isoform-specific KDs. (G-I) Cell migration velocity by time lapse imaging (left) and cell invasion by transwell assay (right) in control vs. isoform-specific KD of VCL (G), CD44 (H) and TNC (I); p values by unpaired t test vs sh.Ren. (J & K) Increased RAC1-GTP levels (J) and RAC1 downstream signaling (pPAK1, pAKT-S473) (K) in RBM10-null PE121410 and KTC1 cells.
Figure 4:
Figure 4:. RBM10-induced exon inclusions of ECM and cytoskeletal transcripts govern metastatic propensity in vivo.
(A) Scheme of HrasG12V/Rbm10flox mouse thyroid cancer lung metastases-derived cell line (64860M) and phenotype rescue experiments by Rbm10 re-expression or isoform-specific KD of Vcl (sh.Vcl_Ex19), Cd44 (sh.Cd44_Ex8) and Tnc (sh.Tnc_Ex14); Illustration by Biorender. (B) Western blot of 64860M cells expressing empty vector (pLVX) and Rbm10. (C) Mean cell migration velocity by time-lapse imaging in 64860M cells −/+ Rbm10. (D) Transwell matrigel invasion assay in 64860M cells −/+ Rbm10. (E) Effect of Rbm10 expression in Luc+ 64860M cells on lung bioluminescence quantification 2 weeks after tail vein injection; p value by unpaired t test. (F) Effect of Rbm10 expression on number of mice with lung metastases assessed by lung H&E, 3–4 weeks after orthotopic implantation of Luc+ 64860M cells into the thyroid; p value by 2-sided Fisher’s exact t-test. (G) Bioluminescence imaging and quantitation of tail vein-injected Luc+ 64860M cells with or without dual and triple isoform-specific KD of Vcl (Vcl_Ex19), Cd44 (Cd44_Ex8) and Tnc (Tnc_Ex14); p value by unpaired t test vs sh.Scr. (H) Vcl, Cd44 and Tnc dual isoform specific KDs in 64860M cells show decreased cell migration velocity compared to sh-Scr transfected cells; p value by unpaired t test vs sh.Scr. (I & J) Decreased Rac1-GTP levels (H) and Rac1 downstream signaling (J) in 64860M cells expressing Rbm10. (K) Isoform-specific triple KD of Vcl, Cd44 and Tnc (sh.3KD) show decreased Rac1-GTP and downstream signaling.
Figure 5:
Figure 5:. Synthetic lethal interaction of RBM10 loss with NFκB:
(A) CRISPR/Cas9 dropout screen strategy to identify genes required for cell survival in RBM10-null KTC1 cells; Illustration by Biorender (top). Volcano plot (bottom) showing relative fold-change of depleted genes (light blue) in pLVX vs RBM10-expressing KTC1 cells calculated from an average of 4 sgRNAs targeting each gene. Gene label, red: Top 10 depleted genes; blue: other relevant hits. (B) KEGG pathway enrichment analysis performed in ShinyGO tool showing activation of NFκB and NFκB-related pathways (red). (C) Western blot of pNFκB (p65) and total NFκB in PE and KTC1 cells at baseline and in the presence of TNF-α. (D) Western blot demonstrating dox-induced KD of RELA (NFκB) in KTC1 cells. (E) Effect dox-induced KD of RELA on growth of RBM10-mutant KTC1 cells. (F) Dose-response curves of KTC1 cells −/+RBM10 treated with various concentrations of TPCA in the presence of TNFα in 1% FBS. (G) Effect of RELA KD on apoptosis in the presence or absence of TNFα (100ng/ml) and dabrafenib (200nM) as determined by annexin flow cytometry in KTC1 cells.

References

    1. ARUFFO A., STAMENKOVIC I., MELNICK M., UNDERHILL C. B. & SEED B. 1990. CD44 is the principal cell surface receptor for hyaluronate. Cell, 61, 1303–13. - PubMed
    1. BAGHERI-YARMAND R., BUSAIDY N. L., MCBEATH E., DANYSH B. P., EVANS K. W., MOSS T. J., AKCAKANAT A., NG P. K. S., KNIPPLER C. M., GOLDEN J. A., WILLIAMS M. D., MULTANI A. S., CABANILLAS M. E., SHAW K. R., MERIC-BERNSTAM F., SHAH M. H., RINGEL M. D. & HOFMANN M. C. 2021. RAC1 Alterations Induce Acquired Dabrafenib Resistance in Association with Anaplastic Transformation in a Papillary Thyroid Cancer Patient. Cancers (Basel), 13. - PMC - PubMed
    1. BECHARA E. G., SEBESTYEN E., BERNARDIS I., EYRAS E. & VALCARCEL J. 2013. RBM5, 6, and 10 differentially regulate NUMB alternative splicing to control cancer cell proliferation. Mol Cell, 52, 720–33. - PubMed
    1. BELKIN A. M., ORNATSKY O. I., GLUKHOVA M. A. & KOTELIANSKY V. E. 1988a. Immunolocalization of meta-vinculin in human smooth and cardiac muscles. J Cell Biol, 107, 545–53. - PMC - PubMed
    1. BELKIN A. M., ORNATSKY O. I., KABAKOV A. E., GLUKHOVA M. A. & KOTELIANSKY V. E. 1988b. Diversity of vinculin/meta-vinculin in human tissues and cultivated cells. Expression of muscle specific variants of vinculin in human aorta smooth muscle cells. J Biol Chem, 263, 6631–5. - PubMed

Publication types