[Preprint]. 2024 Jul 10:2024.07.05.602241.
doi: 10.1101/2024.07.05.602241.

Pathogenicity is associated with population structure in a fungal pathogen of humans

Affiliations

Pathogenicity is associated with population structure in a fungal pathogen of humans

E Anne Hatmaker et al. bioRxiv. .

Update in

Abstract

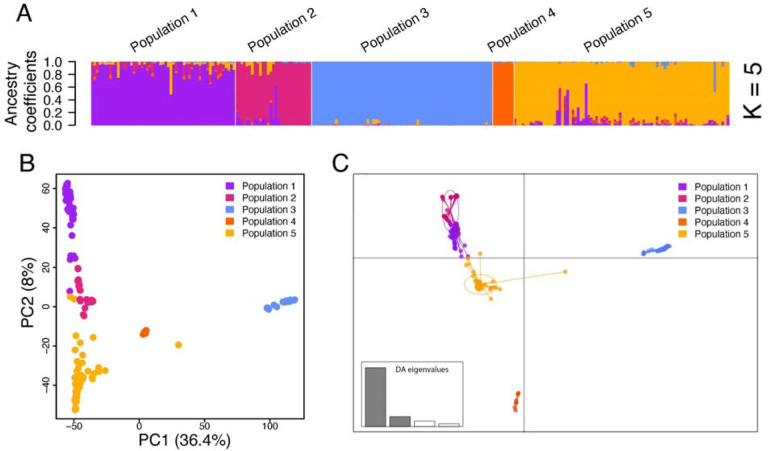
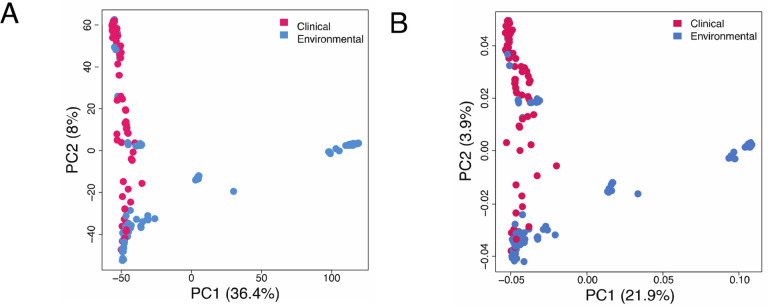
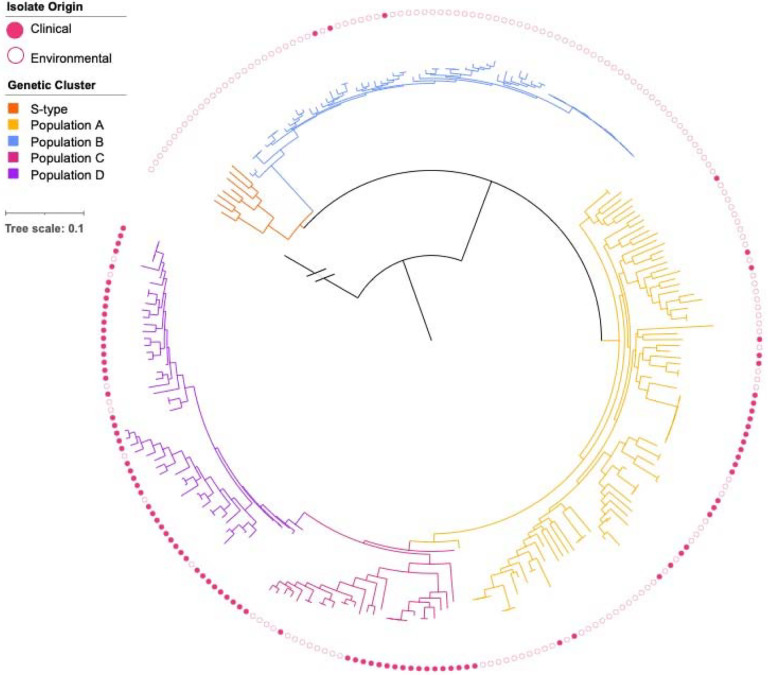
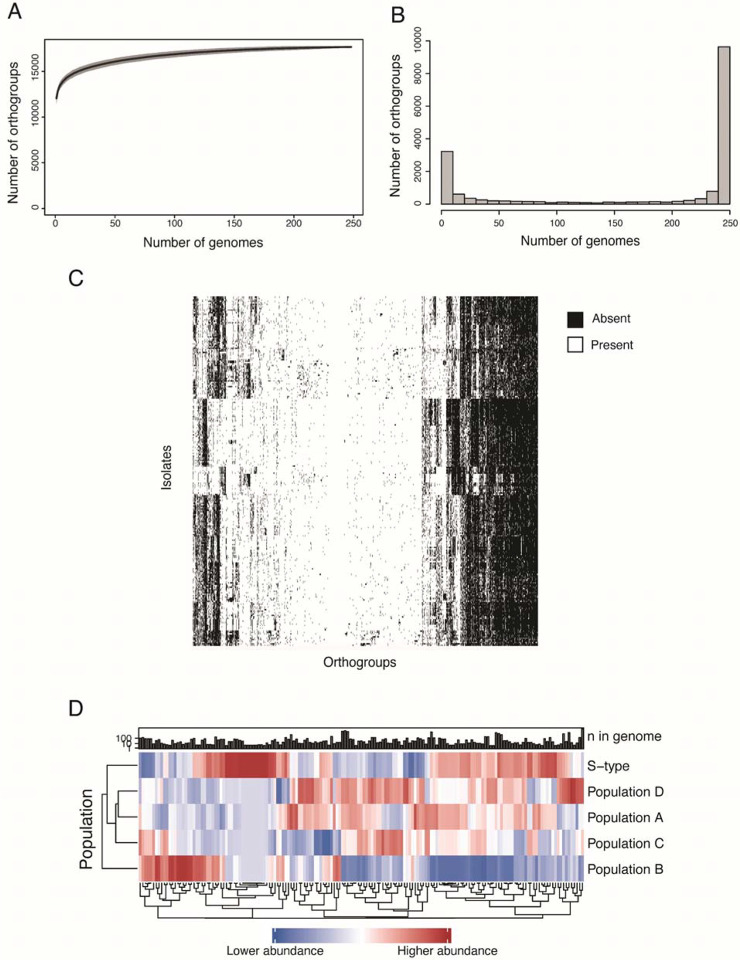
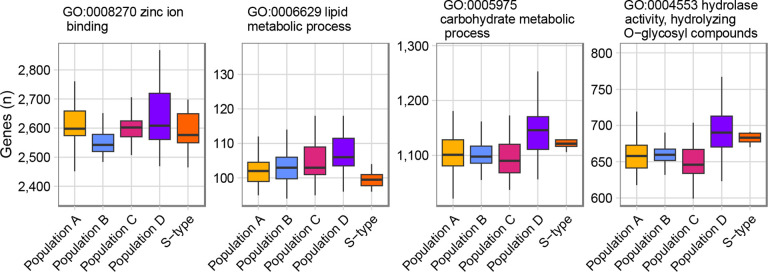
Aspergillus flavus is a clinically and agriculturally important saprotrophic fungus responsible for severe human infections and extensive crop losses. We analyzed genomic data from 250 (95 clinical and 155 environmental) A. flavus isolates from 9 countries, including 70 newly sequenced clinical isolates, to examine population and pan-genome structure and their relationship to pathogenicity. We identified five A. flavus populations, including a new population, D, corresponding to distinct clades in the genome-wide phylogeny. Strikingly, > 75% of clinical isolates were from population D. Accessory genes, including genes within biosynthetic gene clusters, were significantly more common in some populations but rare in others. Population D was enriched for genes associated with zinc ion binding, lipid metabolism, and certain types of hydrolase activity. In contrast to the major human pathogen Aspergillus fumigatus, A. flavus pathogenicity in humans is strongly associated with population structure, making it a great system for investigating how population-specific genes contribute to pathogenicity.

Keywords: Aspergillus flavus; aspergillosis; clinical isolates; keratitis; pan-genome; pathogenicity; population genomics.


Conflict of interest statement

Conflict of interests A.R. is a scientific consultant for LifeMine Therapeutics, Inc. The other authors declare no other competing interests.

Figures

Figure 1.
Figure 1.. Population structure of Aspergillus flavus reveals genetic isolation reflecting five populations, including a new population, D.
Analyses are based on 909,551 biallelic single nucleotide variants. A) Estimates of individual ancestry, with K = 5, conducted using the software package LEA [53], which estimates individual admixture coefficients from a genotypic matrix [89]. We estimated admixture for K = 2 through 6, with K = 5 providing the best fit for our data according to the cross-entropy criterion [54,55]. B) A principal coordinates analysis displaying relative genetic distances of individual isolates, here represented by dots, using Nei’s genetic distance matrix. Axes indicate the two principal coordinates retained and the percentage of variance explained by each coordinate. Populations A, C, and D varied primarily along PC2 rather than PC1; population B showed genetic differentiation from all other populations and varied primarily along PC1. C) Discriminant analysis of principal components shows admixture among populations A, C, and D, as well as clear separation of populations B and S-type. Dots represent individuals and ellipses indicate group clustering of individuals. Populations are color coded as indicated in the top right. The discriminant analysis eigenvalues are shown on the bottom left, with the darker bars showing eigenvalues retained.
Figure 2.
Figure 2.. Principal coordinates analysis shows that clinical and environmental isolates of Aspergillus flavus are genetically distinct.
Each dot represents an individual isolate. Colors indicate the isolation environment of each isolate (clinical or environmental). A) Principal coordinates analysis using Nei’s genetic distance. B) Principal coordinates analysis using Euclidean distance.
Figure 3.
Figure 3.. Maximum likelihood phylogeny supports the existence of five populations and non-random distribution of clinical isolates across populations.
Filled in circles along the outer track indicate clinical isolates; empty circles indicate environmental isolates. Branch colors correspond with population assignment based on the discriminant analysis of principal components (DAPC; Figure 1): the S-type population is indicated in orange; population A in yellow; population B in blue, population C in pink, and population D in purple. The outgroup, Aspergillus minisclerotigenes, is represented in black. Apart from the outgroup, each tip represents an A. flavus isolate and branch lengths denote sequence divergence. Out of 131 nodes, 101 had strong support (BS ≥ 95). The phylogeny was constructed using 925,311 SNPs.
Figure 4.
Figure 4.. The pan-genome of Aspergillus flavus is closed and contains 17,676 orthogroups.
A) Rarefaction curve of number of orthogroups added with each additional genome, excluding singletons. B) Histogram of orthogroup frequency determined by number of genomes in which each orthogroups is present. The core genome contains 10,161 orthogroups. The accessory genome of A. flavus contains 7,515 orthogroups. C) Presence/absence heatmap of accessory orthogroups. D) Heatmap of abundance of gene ontology (GO) annotations with significant differences in abundance among populations. Significance determined by one-way ANOVA. Bonferroni-corrected, p < 0.05.
Figure 5.
Figure 5.. Gene ontology (GO) terms more prevalent in population D than other populations include zinc ion binding and hydrolase activity, among others.
Boxplots indicate the number of genes annotated with each GO term per isolate, by population assignment. The Y axis scale is adjusted for each GO term to better show differences among populations.

References

    1. Rudramurthy SM, Paul RA, Chakrabarti A, Mouton JW, Meis JF. Invasive Aspergillosis by Aspergillus flavus: Epidemiology, Diagnosis, Antifungal Resistance, and Management. Journal of Fungi. 2019;5. doi: 10.3390/jof5030055 - DOI - PMC - PubMed
    1. Bongomin F, Gago S, Oladele RO, Denning DW. Global and multi-national prevalence of fungal diseases—estimate precision. Journal of Fungi. 2017;3: 57. doi: 10.3390/jof3040057 - DOI - PMC - PubMed
    1. Chong WH, Neu KP. Incidence, diagnosis and outcomes of COVID-19-associated pulmonary aspergillosis (CAPA): a systematic review. Journal of Hospital Infection. 2021;113: 115–129. - PMC - PubMed
    1. Nasir N, Farooqi J, Mahmood SF, Jabeen K. COVID-19-associated pulmonary aspergillosis (CAPA) in patients admitted with severe COVID-19 pneumonia: an observational study from Pakistan. Mycoses. 2020;63: 766–770. - PMC - PubMed
    1. Schauwvlieghe AFAD, Rijnders BJA, Philips N, Verwijs R, Vanderbeke L, Van Tienen C, et al. Invasive aspergillosis in patients admitted to the intensive care unit with severe influenza: a retrospective cohort study. Lancet Respir Med. 2018;6: 782–792. - PubMed

Publication types

LinkOut - more resources