[Preprint]. 2024 Jul 13:2024.07.10.602410.
doi: 10.1101/2024.07.10.602410.

eIF1 and eIF5 dynamically control translation start site fidelity

Affiliations

eIF1 and eIF5 dynamically control translation start site fidelity

Rosslyn Grosely et al. bioRxiv. .

Update in

Abstract

Translation initiation defines the identity of a synthesized protein through selection of a translation start site on a messenger RNA. This process is essential to well-controlled protein synthesis, modulated by stress responses, and dysregulated in many human diseases. The eukaryotic initiation factors eIF1 and eIF5 interact with the initiator methionyl-tRNAi Met on the 40S ribosomal subunit to coordinate start site selection. Here, using single-molecule analysis of in vitro reconstituted human initiation combined with translation assays in cells, we examine eIF1 and eIF5 function. During translation initiation on a panel of RNAs, we monitored both proteins directly and in real time using single-molecule fluorescence. As expected, eIF1 loaded onto mRNAs as a component of the 43S initiation complex. Rapid (~ 2 s) eIF1 departure required a translation start site and was delayed by alternative start sites and a longer 5' untranslated region (5'UTR). After its initial departure, eIF1 rapidly and transiently sampled initiation complexes, with more prolonged sampling events on alternative start sites. By contrast, eIF5 only transiently bound initiation complexes late in initiation immediately prior to association of eIF5B, which allowed joining of the 60S ribosomal subunit. eIF5 association required the presence of a translation start site and was inhibited and destabilized by alternative start sites. Using both knockdown and overexpression experiments in human cells, we validated that eIF1 and eIF5 have opposing roles during initiation. Collectively, our findings demonstrate how multiple eIF1 and eIF5 binding events control start-site selection fidelity throughout initiation, which is tuned in response to changes in the levels of both proteins.


Conflict of interest statement

Competing interests: The authors declare no competing financial interests.

Figures

Figure 1.
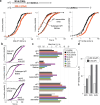
Figure 1.. eIF1 stably binds and dynamically samples individual complexes.
(a) Structure of a human translation initiation complex prior to recognition of the translation start site (PDB ID: 6ZMW). The positions of U46 on Met-tRNAiMet (green) and C94 of eIF1 (red) are indicated, which are separated by about 50 Å. (b) Schematic of the real-time single-molecule assay. (c) Example single-molecule fluorescence data where tRNAi-Cy3 (green), eIF1-Cy5 (red), and eIF5B-Cy3.5 (orange) were monitored during translation initiation on β-globin mRNA. (d) Heat map of tRNAi-to-eIF1 FRET signal on all analyzed complexes synchronized to its initial appearance. (e-i) Cumulative probability plots of the indicated parameters (defined as in panel c and Fig. S2a). Lines represent fit to exponential functions, which we used to derive the reported rates. In all experiments here, eIF1-Cy5 was present at a final concentration of 40 nM (by Cy5) and unlabeled eIF5 was present at either 290 or 5 nM, as indicated. See Table S1 for all rates and the number of complexes and binding events analyzed in each experiment.
Figure 2.
Figure 2.. eIF1 kinetics depend on 5’UTR length and the identity of the translation start site.
(a) Cartoon schematic of the model mRNAs with 50 nt (black) or 200 nt (orange) long 5’UTRs. Cumulative probability plots of the indicated eIF1 events observed on eIF5B-bound initiation complexes (successful). Lines represent fits to exponential functions. (b) Cumulative probability plots of the indicated eIF1 events observed on any loaded initiation complexes (both unsuccessful and successful). Lines represent fits to exponential functions. (c) Plot of the mean elapsed time (t1/2 value) of the indicated eIF1 parameters on the indicated mRNAs. All values plotted here were derived from events that occurred on eIF5B-bound initiation complexes (successful). (d) Plot of the mean elapsed time (t1/2 value) of the eIF1 binding window on the indicated mRNAs in the presence of 290 nM or 5 nM unlabeled eIF5. All values plotted here were derived from events that occurred on eIF5B-bound initiation complexes (successful). In all experiments, eIF1-Cy5 was present at a final concentration of 40 nM (by Cy5) and unlabeled eIF5 was present at either 290 or 5 nM, as indicated. See Table S1 for all rates and the number of complexes and binding events analyzed in each experiment.
Figure 3.
Figure 3.. eIF5 transiently binds initiation complexes.
(a) Structure of a human translation initiation complex present at the translation start site (PDB ID: 8OZ0). The positions of U46 on Met-tRNAiMet (green) and the N-terminus of eIF5 (purple) are indicated, which are separated by about 35 Å. (b) Schematic of the real-time single-molecule assay. (c) Example single-molecule fluorescence data where tRNAi-Cy3 (green), eIF5-Cy5.5 (purple), eIF5B-Cy3.5 (orange), and 60S-Cy5 (red) were monitored during translation initiation on β-globin mRNA. (d) Heat map of the tRNAi-Cy3 (top) and eIF5-Cy5.5 (bottom) fluorescent signals on all analyzed complexes (the 40 nM eIF5 experiment) synchronized to initial appearance of the tRNAi-Cy3 signal. (e) Heat map of the eIF5-Cy5.5 (top), eIF5B-Cy3.5 (middle), and 60S-Cy5 (bottom) fluorescent signals on all analyzed complexes (the 40 nM eIF5 experiment) synchronized to appearance of the eIF5-Cy5.5 signal. (f) Cumulative probability plots of the observed eIF5 lifetime in the 40 nM experiment. The line represents the fit to a double-exponential function, which we used to derive the indicated rates. (g) Plot of the observed eIF5 association rates at the indicated concentrations. Lines represent fits via linear regression analysis to derive the indicated rates. (h) Cumulative probability plots of the observed eIF5B association time in the 40 nM experiment. The line represents a fit to an exponential function, which we used to estimate the indicated rate. (i) Example single-molecule data where the eIF5-Cy5.5 signal extended into the eIF5B-Cy3.5 binding event. In all experiments, the final concentration of eIF5-Cy5.5 is as indicated (by Cy5.5 dye) and unlabeled eIF1 was present at 290 nM. See Table S3 for all rates and the number of complexes and binding events analyzed in each experiment.
Figure 4.
Figure 4.. The identity of the translation start site alters eIF5 dynamics.
(a) Plot of the percent of initiation complexes that contained at least one eIF5 binding event on the indicated mRNA. The percentage was corrected to account for an eIF5-Cy5.5 labeling efficiency of 50%. (b) Cumulative probability plots of the eIF5 association times (left) and eIF5 lifetimes (right) on the indicated mRNAs. For complexes with multiple eIF5 binding events, only the final eIF5 binding event was included in these plots. Lines represent fits to exponential functions. (c) Plot of the mean time (s) for the indicated kinetic parameters, which is defined as the reciprocal of the observed rate. The parameters are defined as in Figure S6a. (d) Kinetic model derived from our single-molecule studies on eIF1 and eIF5 (this study) and our previous study on eIF1A and eIF5B. In all experiments, the final concentration of eIF5-Cy5.5 was 40 nM (by Cy5.5 dye) and unlabeled eIF1 was present at 290 nM. See Table S3 for all rates and the number of complexes and binding events analyzed in each experiment.
Figure 5.
Figure 5.. eIF1 and eIF5 have opposing roles in cells.
(a) Plot of the relative translation activity of the indicated reporter mRNAs. The top 6 mRNAs contained unstructured 5’UTRs 50 nt in length, which were comprised of CAA repeates. For all 6, translation activity was quantified relative to model mRNA with an AUG in ideal Kozak context. The bottom mRNA was derived from the native 5’UTR of eIF5, which contains multiple upstream start sites in poor context. For this mRNA, translation activity was quantified relative to the same mRNA except the potential upstream start sites were eliminated. (b) Plot of the fold change of the translation activity of the indicated mRNAs upon siRNA-mediated knockdown of eIF1 and eIF5. (c) Plot of the fold change of the translation activity of the indicated mRNAs upon overexpression of eIF1 and eIF5. n = 5 and n = 6 for the knockdown and overexpression data, respectively. * indicates p < 0.01 for Student’s t-test (2 tailed) tests that compared eIF1 and eIF5 effects on the given mRNAs.

References

    1. Kozak M. Context effects and inefficient initiation at non-AUG codons in eucaryotic cell-free translation systems. Mol Cell Biol 9, 5073–5080 (1989). - PMC - PubMed
    1. Peabody D. S. Translation initiation at non-AUG triplets in mammalian cells. J Biol Chem 264, 5031–5035 (1989). - PubMed
    1. Kearse M. G. & Wilusz J. E. Non-AUG translation: a new start for protein synthesis in eukaryotes. Genes Dev 31, 1717–1731 (2017). - PMC - PubMed
    1. Andreev D. E. et al. Non-AUG translation initiation in mammals. Genome Biology 23, 111 (2022). - PMC - PubMed
    1. Dever T. E., Ivanov I. P. & Hinnebusch A. G. Translational regulation by uORFs and start codon selection stringency. Genes Dev. 37, 474–489 (2023). - PMC - PubMed

Publication types